Physical fitness is considered one of the most important determinants of health status in children and adolescents (Ortega et al., Reference Ortega, Ruiz, Castillo and Sjöström2008). Therefore, it is crucial to identify low levels of physical fitness (PF) among young populations before encouraging them to participate in exercise programs aimed at increasing it, which is a current health prevention strategy developed worldwide (Myer et al., Reference Myer, Faigenbaum, Stracciolini, Hewett, Micheli and Best2013). Physical fitness is a set of attributes, among which body composition, flexibility, muscular strength, cardiorespiratory and muscular endurance play a prominent role, due to their strong relationship with health. All together, these attributes, which can be important predictors of disease and injury (Catley & Tomkinson, Reference Catley and Tomkinson2013), comprise what is traditionally known as health-related physical fitness (HRPF) (Caspersen et al., Reference Caspersen, Powell and Christenson1985).
Generally, HRPF is assessed by means of laboratory or field-based tests. Both methods usually require material resources as well as a specific space, and can be time-consuming. In this regard, questionnaires can be considered as a useful alternative option, since they are easy to administer and constitute a low-cost tool that allows data from a large number of people to be registered in a short period of time (Sánchez-Lastra et al., Reference Sánchez-Lastra, Martínez-Lemos, Cancela and Ayán2018). Consequently, questionnaires for assessing self-reported PF have long been considered useful in epidemiological studies aimed at estimating the fitness level of a given population (Knapik et al., Reference Knapik, Jones, Reynolds and Staab1992). In addition to being important for determining the fitness level of children, these questionnaires could also provide useful information regarding self-perceived competence. Indeed, there is evidence indicating that in children, fitness is strongly associated with physical perceptions of sport competence, and physical self-worth (Robinson, Reference Robinson2011). This is an important finding that should be taking into account by clinicians and researchers, since self-perceived competence is a primary mechanism that contributes to the health of young children because of their potential effects of physical activity participation (Raudsepp & Liblik, Reference Raudsepp and Liblik2002).
In accordance with this line of reasoning, it has been traditionally accepted that self-perceived physical conditioning is an important contributor to the physical self, and therefore it strongly influences self-esteem and self-perception (Fox & Corbin, Reference Fox and Corbin1989). Consequently, physical fitness is considered one of the main dimensions that should be assessed when measuring physical self-concept, a construct that makes reference to the perception that individuals have of their physical skills and physical appearance (Mayorga-Vega et al., Reference Mayorga-Vega, Viciana, Cocca and De Rueda2012). Therefore, questionnaires for assessing physical self-concept usually include items related to fitness. Several questionnaires of this kind have been developed and used with Spanish young populations, such as the Cuestionario de Autoconcepto Físico (Physical Self-concept Questionnaire [CAF]; Goñi et al., Reference Goñi, Ruiz de Azúa and Rodríguez2006), the Autokontzeptu Fisikoaren Itaunketa (Physical Self-concept Questionnaire [AFI]; Esnaola et al., Reference Esnaola, Infante and Zulaika2011) or the adapted versions of the Physical Self-Perception Profile (Gutiérrez et al., Reference Gutiérrez, Moreno and Sicilia1999), also known as the Children Physical Self Questionnaire (C-PSQ; Murcia et al., Reference Murcia, Gimeno, Vera and Ruiz2007), and the Self-Perception Profile for Children (SPPC; Atienza et al., Reference Atienza, Balaguer and Moreno2002). In addition, some authors have opted for using pictorial scales in order to evaluate physical self-concept in Spanish children that also include items related to self-perceived fitness, such as the Physical Self-Concept in Children (P-PSC-C; Estevan et al., Reference Estevan, Utesch, Dreiskämper, Tietjens, Barnett and Castillo2019).
However, it should be noted that physical self-concept includes domains related not only to general fitness, but also to ability (also known as motor competence), since both factors are related (Estevan & Barnett, Reference Estevan and Barnett2018). In this regard, it has been acknowledged that there seems to be an overlap in content between motor competence and physical fitness assessments (Utesch et al., Reference Utesch, Bardid, Büsch and Strauss2019), which implies that more concrete and specific measurement tools for assessing self-perceived HRPF are needed.
Before using a questionnaire for assessing self-reported HRPF, its reliability and validity should first be tested and informed. In this regard, few self-reported HRPF questionnaires whose psychometric properties have been tested in young Spanish speaking populations are currently available (Ramírez-Vélez et al., Reference Ramírez-Vélez, Cruz-Salazar, Martínez, Cadore, Alonso-Martinez, Correa-Bautista, Izquierdo, Ortega and García-Hermoso2017). Ortega et al. (Reference Ortega, Ruiz, Romero, Rodriguez, Gómez, Manios, Béghin, Molnar, Kurt, Moreno, Sjöström and Castillo2011) developed the International Fitness Scale (IFIS) for assessing self-reported fitness in Spanish adolescents. The IFIS was shown to be effective for ranking adolescents according to their objectively measured fitness level. However, there are two important facts regarding its characteristics that should not be overlooked when creating a questionnaire for assessing self-reported HRPF. Firstly, the IFIS does not include a question regarding body composition, an important component of self-perceived fitness (Abadie, Reference Abadie1988). Secondly, the IFIS is composed of five short Likert-scale questions while it has been stated that it is easier for people to estimate their fitness level through clear and concrete examples of the kind of physical activity that they are able to engage in (Mikkelsson et al., Reference Mikkelsson, Kaprio, Kautiainen, Kujala and Nupponen2005). More recently, Cossio-Bolaños et al. (Reference Cossio-Bolaños, Vasquez, Luarte-Rocha, Sulla-Torres and Gómez Campos2016) took into account both factors when developing the Self-Perception of Physical Fitness Scale (EAPAF) in Chilean adolescents. However, the EAPAF does not register data regarding flexibility level and, although its internal validity was informed, the EAPAF was not tested against an objective measure of fitness.
Finally, it should be noted that both scales were initially validated in adolescents, although the psychometric properties of the IFIS were tested later in children from 9–12 years of age (Sánchez-López et al., Reference Sánchez‐López, Martínez‐Vizcaíno, García‐Hermoso, Jiménez‐Pavón and Ortega2015). This population group (prepubescent children) represents an important target around which to develop strategies aimed at improving their HRPF. Indeed, it is well known that physical activity starts to decline early in life, and sedentary behavior increases in the transitional phase from childhood to adolescence (Jones et al., Reference Jones, Hinkley, Okely and Salmon2013). Consequently, is equally important to assess the HRPF level by means of measurement tools that have been specifically created for administration in populations around puberty.
Under these circumstances, this study is aimed at providing information regarding the reliability and validity of a newly-developed questionnaire designed for assessing self-reported fitness assessment in prepubescent Spanish children.
Method
Participants
A total of 283 students (mean age = 10.80 ± 0.69 years; 45.6 % girls) took part in the research. Participants were normal healthy Spanish urban children who were recruited from three primary schools in northern Spain, through invitation letters sent to their respective physical education (PE) teachers. Those children who did not show any medical problem that could affect the completion of the proposed measurement tests were deemed eligible for the study. Informed written consents were requested and obtained from the parents and school headmasters. The study design was reviewed and eventually approved by the Ethics committee of the Faculty of Education and Sports Science (University of Vigo).
Measurements
The Self-perceived HRPF Questionnaire for Children (SPHQ-C)
We intended to create a questionnaire for assessing self-perceived HRPF taking into account the multidimensional model of physical self-concept developed by Fox and Corbin (Reference Fox and Corbin1989), in which physical fitness plays a major role, alongside with physical attractiveness. The questionnaire’s content was initially based on the conceptual framework developed by Abadie (Reference Abadie1988), who suggested that self-perceived fitness is a multidimensional construct represented by a four-factor structure: Cardio-vascular endurance, muscular flexibility, muscular strength, and body composition. On that basis, and taking into account the definition of HRPF proposed by Caspersen et al. (Reference Caspersen, Powell and Christenson1985), who included body composition as key dimension of fitness related to health; five fitness dimensions were finally included in the questionnaire: Muscular strength, muscular endurance, cardiovascular fitness, flexibility and body composition.
Initially, the questionnaire was developed by two specialists in PE and included a total of 12 items (three questions for every HRPF assessed). Each question provided five possible answers ranging from 1 to 5 points which showed an example of the implication of the HRPF component assessed in activities in which children are usually involved (i.e. for muscular strength “I can lift a bike with one hand”; “I need my two hands for lifting my bike”…. “I cannot lift my bike”. For cardiorespiratory fitness “I have a very high fitness level since I can run around the football field 12 times without feeling tired”…. “I have a low level of fitness since I can only run around the football field twice without having to stop”).
The first draft of the questionnaire was sent to seven PE teachers who were working in different elementary schools and whose students were not involved in the research. In order to assess the questionnaire comprehensibility and acceptance, a set of questions were asked to them regarding the format, the purpose of the questionnaire, the wording and the language used, as well as the easiness of its use in the school context. In addition, they were encouraged to suggest changes and modifications in this regard.
The PE teachers provided several commentaries after reviewing it, but mostly they agreed on three important facts. First, the HRPF dimensions had been well identified and the objective of the questionnaire was clear. Second, the questionnaire was too long; there were too many questions included for every HRPF component. Third, the possible answers provided for the questions related to muscular strength, cardiovascular fitness and flexibility were not accurate for children aged 10–12. Consequently, they suggested making a shorter questionnaire and providing examples of activities performed in PE or related to their everyday life activities (i.e. carrying the school backpack to assess muscular strength or running during PE to assess cardiorespiratory fitness). They commented that otherwise the children would find the questionnaire boring and too long, and therefore they would lose interest in providing accurate answers.
All the suggestions were taken into account and a second draft of the questionnaire was sent to them. All the experts considered that this second version was more accurate and could be used with prepubescent children.
The definitive version of the SPHQ-C (see Appendix), includes nine Likert-scale questions ranging 1 to 5 points divided into two sets. The first one consists of five questions relating to the main components of HRPF and self-perceived fitness: Muscular strength, muscular endurance, cardiorespiratory endurance, flexibility and body composition (Abadie, Reference Abadie1988; Caspersen et al., Reference Caspersen, Powell and Christenson1985). This set of questions asks about how strong, resistant to fatigue, flexible and obese the children think they are by showing examples related to activities in which every HRPF component is involved. The question regarding body composition specifically asks about how much the children think they weigh.
The second set of questions focuses on how the children feel regarding their fitness level and body composition, in comparison with their friends of the same age. We included four questions, (one question for each HRPF domain), except for the muscular strength and muscular endurance dimensions, which were contained in the same question, since they refer to the same fitness domain, “general strength”. This was done in order to shorten the questionnaire and also to avoid ambiguous interpretations by the children, following the advice provided by most of the teachers who reviewed the first draft of the questionnaire.
Each of the questionnaire’s nine questions are structured in response scales with a 1–5 rating scale, except for both questions related to body composition that were rated 5–3–1–3–5 accordingly. By doing so, children who perceived themselves as having a normal-weight obtained the lower scores, and those who perceived themselves as being too fat or too skinny, obtained the higher ones. This procedure has been previously proposed for scoring items assessing specific components of body build included in self-perceived fitness scales (Lintunen et al., Reference Lintunen, Heikinaro-Johansson and Sherrill1995).
For each question, children are asked to choose one of the five sentences that best represent their personal feelings. Lower scores indicate a better self-perceived fitness. The total score of the questionnaire ranges from 9 to 45 points.
Self-perceived Physical Fitness
The IFIS scale was used to assess the level of fitness perceived by the children. The IFIS consists of a Likert-type scale (range 1–5) with five response options (very poor, poor, average, good, and very good), focused on perceived overall fitness and five fitness components: Cardiorespiratory fitness, muscular strength, speed, agility, and flexibility. The IFIS has shown high validity and moderate-to-good reliability in Spanish children aged 9–12 years (Sánchez-López et al., Reference Sánchez‐López, Martínez‐Vizcaíno, García‐Hermoso, Jiménez‐Pavón and Ortega2015).
Health-Related Physical Fitness
For assessing body composition, the children’ weight (kg) and height (cm) were measured by means of a digital scale and a statimeter. The body mass index (BMI) was calculated dividing the body weight in kilograms by the height in meters squared (kg/m2). Field tests from the Eurofit battery (Adam et al., Reference Adam, Klissouras and Ravassolo1988) were used to assess cardiorespiratory fitness (Course-Navette), muscular strength (hand- held dynamometry), and muscular endurance (sit-ups). Flexibility was assessed by means of the V-sit test (Arnheim & Sinclair Reference Arnheim, Sinclair, Arnheim and Sinclair1979).
Procedures
The study was carried out during the PE lessons that took place during the second trimester of the 2018/19 school year. All the questionnaires and fitness tests were administered by three research assistants (all fourth grade university PE students), under the supervision of the main researcher of this investigation. The research assistants underwent two-sixty-minute training sessions. During the first one, they received basic information regarding psychometric properties of a research instrument, and both questionnaires were showed and explained to them. The second session was aimed at practicing the administration of the fitness tests that the students already knew about. This training period was done in order to provide them with all the necessary information regarding how to administer the questionnaires and the fitness tests.
The data was gathered over a period of four weeks. For assessing test-retest reliability, the SPHQ-C was filled out twice, with a 15-day interval between each administration. The questionnaire was answered by the children while in class and in the presence of the PE teacher during the first (test) and the third (retest) week of the four-week schedule. First, all items were read aloud and explained by the research assistants, and then by the children individually. This was done in order to clarify any possible doubts they might have. After this, the children fulfilled the questionnaire by themselves.
The following procedure was carried out to estimate the validity evidence of the questionnaire based on relations to other variables. First, the scores related to muscular strength and muscular endurance, cardiovascular fitness and flexibility in the SPHQ-C were correlated with the muscular, cardiovascular and flexibility items in the IFIS respectively. The IFIS was completed only once, between both SPHQ-C administrations (second week of the four-week schedule). Second, the questions related to body composition were correlated with the BMI. Finally, the item scores from the SPHQ-C were compared with the results obtained in the field-based fitness tests, which were performed in the schools’ sports hall under the supervision of the same people in charge of the administration of the questionnaires. The fitness tests were performed one week after the students filled out the SPHQ-C for the second time, together with the anthropometric measures (fourth week of the four-week schedule).
Statistical Analysis
Validity Evidence Based on Internal Structure
The split half-sample was carried out to evaluate the validity evidence based on internal structure of the SPHQ-C. One "development" half-sample was used with exploratory factor analysis (EFA) to find the model with higher interpretability. The other half-sample was used as a "validation" sample with confirmatory factor analysis (CFA) to evaluate the model found in the EFA, using modification indices post-estimation to examine the results obtained and to find the best-fit model.
Firstly, the adequacy of “development” sample to perform EFA was assessed using the Kaiser-Meyer-Olkin (KMO) measure and Bartlett’s test of sphericity, considering KMO values higher than 0.7 as highly appropriated (Hu & Bentler, Reference Hu and Bentler1999) and KMO values between 0.6 and 0.7 as moderately appropriated, when Bartlett’s test of sphericity is significant (Tabachnick & Fidell, Reference Tabachnick, Fidell and Ullman2007).
Secondly, according to data characteristics, EFA was carried out in the “development” sample as follows. The relationships between the observed variables were evaluated with the matrix of polychoric correlations due to the ordinal scale of the SPHQ-C (Hoffmann et al., Reference Hoffmann, Stover, de la Iglesia and Fernández-Liporace2013). A robust method was used to estimate the factor analysis, the Weighted Least Square Mean and Variance Adjusted (WLSMV), because the multivariate normality was tested and violated in the data (Muthén & Muthén, Reference Muthén and Muthen2017). The factors were extracted by screen plot in combination with the conventional cut-off of eigenvalues greater than one or Kaiser criterion.
Geomin oblique rotation was employed to determine factor loadings, since it is considered that oblique rotation is a better option than Varimax orthogonal option when correlation among variables is probable, as in the case of sports or physical fitness components (Asparouhov & Muthén, Reference Asparouhov and Muthén2009). Items were assigned to the factor that produced the highest factor loading (cut off ≥ 0.300) (Costello & Osborne, Reference Costello and Osborne2005). Goodness-of-fit was tested with chi-square and complemented by other conventional indices as: the Root Mean Squared Error of Approximation (RMSEA) and the Standardized Root Mean Square Residual (SRMR). An RMSEA of between 0 and 0.05 indicates a good fit, between 0.05 and 0.08 indicating an acceptable one (Wang & Wang, Reference Wang and Wang2019). An SRMR of between 0 and 0.05 indicates a good fit, between 0.05 and 0.10 indicating an acceptable one (Khine, Reference Khine2013). The Comparative Fit Index (CFI) and Tucker Lewis Index (TLI) were also used. Values higher than 0.95 in these fit indices are generally interpreted as an acceptable fit (Hu & Bentler, Reference Hu and Bentler1999). The internal consistency of each factor was confirmed by calculating standardized Cronbach’s alpha (Ferrando & Anguiano-Carrasco, Reference Ferrando and Anguiano-Carrasco2010).
Confirmatory Factor Analysis (CFA) was conducted to test the fit of our factor structure in the other half-sample, using the WLSMV estimator and the same indices explained above. Also, the Weighted Root Mean Square Residual (WRMR) was calculated to compare other models, taking into account that values lower than 1.00 are generally considered as an acceptable fit (Wang & Wang, Reference Wang and Wang2019). Statistical packages were used for data analysis regarding the structural dimension of the SPHQ-C, MPLUS 7.3 (Muthén & Muthén, Reference Muthén and Muthén1998).
Reliability
The difference of means was evaluated using the t-test based on the Bland-Altman procedure (Bland & Altman, Reference Bland and Altman1986) and the intraclass correlation coefficient (ICC) which CI 95% was calculated, according to Koo and Li (Reference Koo and Li2016). Weighted kappa values for each of the nine questions of the SPHQ-C were also identified.
Validity Evidence Based on Relations to Other Variables
Based on the components obtained in CFA results, a total score for each factor was calculated by adding the value of the questions associated with each one. Additionally, to facilitate comparison, factor scores based on more than one item were classified in 5 levels, as follows: For 2-item factors (2, very good; 3–4, good; 5–6, average; 7–8, poor; 9–10, very poor), for 3-item factors (3–4, very good; 5–6, good; 7–8, average; 9–10, poor; 11–15, very poor), and for the global questionnaire 9-item scores (9–16, very good; 17–20, good; 21–25, average; 26–29, poor; 30–45, very poor).
The results obtained in the fitness tests were normalized using mean and standard deviation, taking into account age and sex. The BMI was also normalized using age and sex data for Spanish children (Fernández et al., Reference Fernández, Lorenzo, Vrotsou, Aresti, Rica and Sánchez2011). To obtain a total PF score, we added up the normalized values obtained in the fitness tests (the better the result in the test, the more points in the score), following the same procedure previously used for comparing objective fitness measurements with self-perceived data (Martínez-Aldao et al., Reference Martínez-Aldao, Diz, Varela and Ayán2019). Afterwards, we subtracted the normalized distance from BMI mean values (the further from the mean BMI values, the less points in the score).
Spearman’s ρ coefficients were calculated to assess correlation between measurements. Kruskal-Wallis and Wilcoxon Rank tests were performed to determine the ability of SPHQ-C questions and factors to rank children into appropriate physical levels, according to the physical z- test scores and IFIS scores.
Results
The children understood the SPHQ-C perfectly well and they were able to fill it out without encountering any special difficulties.
Validity Evidence Based on Internal Structure
In the preliminary analysis of the “development” half-sample of 131 students, the Kaiser-Meyer-Olkin index was 0.646, and the Bartlett test of sphericity was significant (p < .001), showing a moderate appropriateness of the data for its use in the EFA.
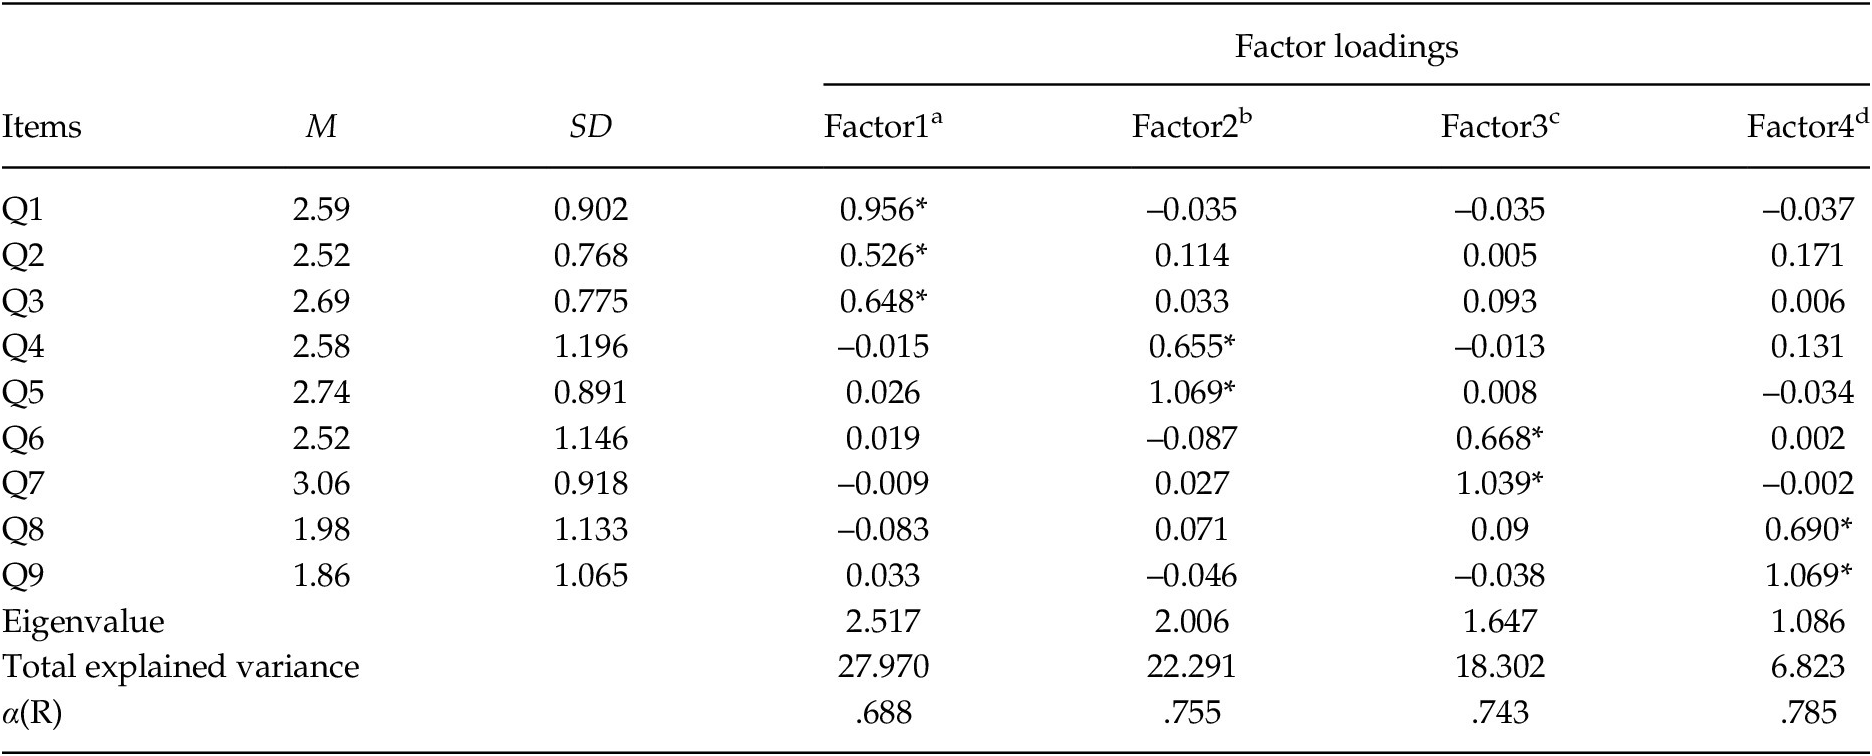
In the EFA, four factors were extracted that accounted for 75.4 % of the total variance (Table 1).
Items Corresponding to Each Factor after the Exploratory Analysis

Note. aFactor 1 = Muscular Fitness; bFactor 2 = Cardiorespiratory Fitness; cFactor 3 = Flexibility; dFactor 4 = Body Composition.
*Factor loadings higher than 0.300. All of these were significant at 5 % level.
Factor 1, called Muscular Fitness (MF), accounted for 28 % of the total variance and consisted of three items related to strength activities. Factor 2, called Cardiorespiratory Fitness (CRF), accounted for 22.3 % of the total variance and consisted of 2 items related to aspects of physical endurance. Factor 3, called Flexibility (FL), accounted for 18.3% of the total variance and consisted of 2 items related to flexibility measures. Finally, Factor 4, called Body Composition (BC), accounted for 6.8% of the total variance and consisted of 2 items related to physical appearance. The fit indices obtained were acceptable (RMSEA = .000; 90 % CI [.000, .009]; CFI = 1.000; TLI = 1.038; SRM = .008).
A Cronbach’s alpha of .607 was obtained when the SPHQ-C was analyzed globally. When the analysis was carried out for each factor separately, higher internal consistency values were obtained (MF = .70; CRF = .77; FL = .80; BC = .83).
The model found in EFA was tested using CFA (Figure 1) in the “validation” half-sample of 152 college students, obtaining a good model fit (RMSEA = .52; 90 % CI [.000, .092]; CFI = .994; TLI = 0.990; WRMR = 0.485).
Confirmatory Factor Analysis of SPHQ-C Figure 1. Factor1 = Muscular Fitness, Factor2 = Cardiorespiratory Fitness; Factor3 = Flexibility; Factor4 = Body Composition.

Reliability
Out of the 283 students, 272 completed test-retest assessments. The SPHQ-C showed a very good reliability (ICC = .88; 95% CI [.84, .90]) and a non-significant difference of means of –0.044 (95% CI [–0.399, 0.311]; t-value = –0.244; p = .807). Moderate to good associations were obtained for each of the nine questions of the SPHQ-C, according to weighted kappa values (κ = .53 – .76).
Validity Evidence Based on Relations to Other Variables
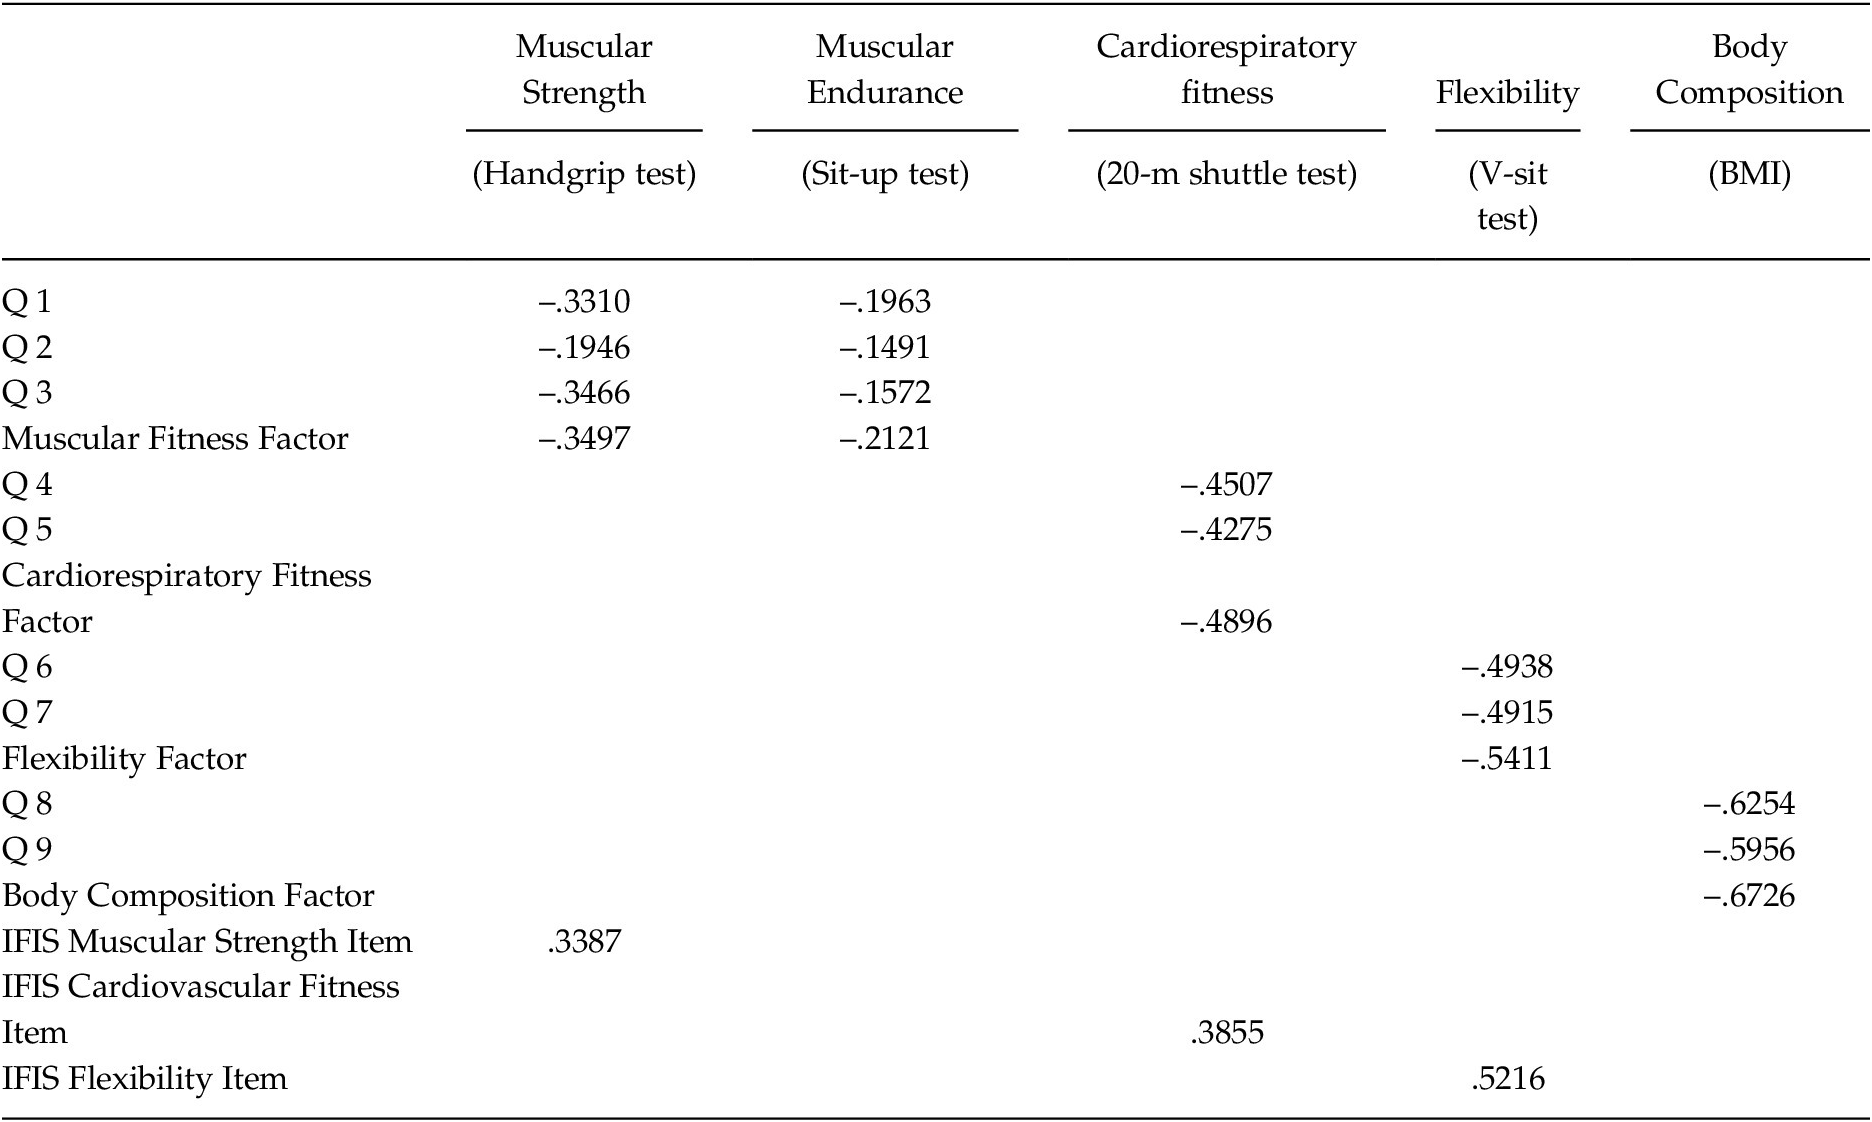
The degree of validity evidence based on relations to other variables found when the SPHQ-C and the IFIS scales were contrasted with the corresponding field-based tests, as shown in Table 2.
Correlation Spearman ρ Coefficients for Field-based Tests Scores and BMI versus the Corresponding SPHQ-C and IFIS Scale Items and Factors

Note. Q = Questions.
Overall, both measurement tools established similar degrees of association between questions of self-estimated PF and measured PF tests. In addition, Table 2 also shows Spearman ρ coefficients for relation between BMI and Body composition items and factors (ρ = –.59 – .67).
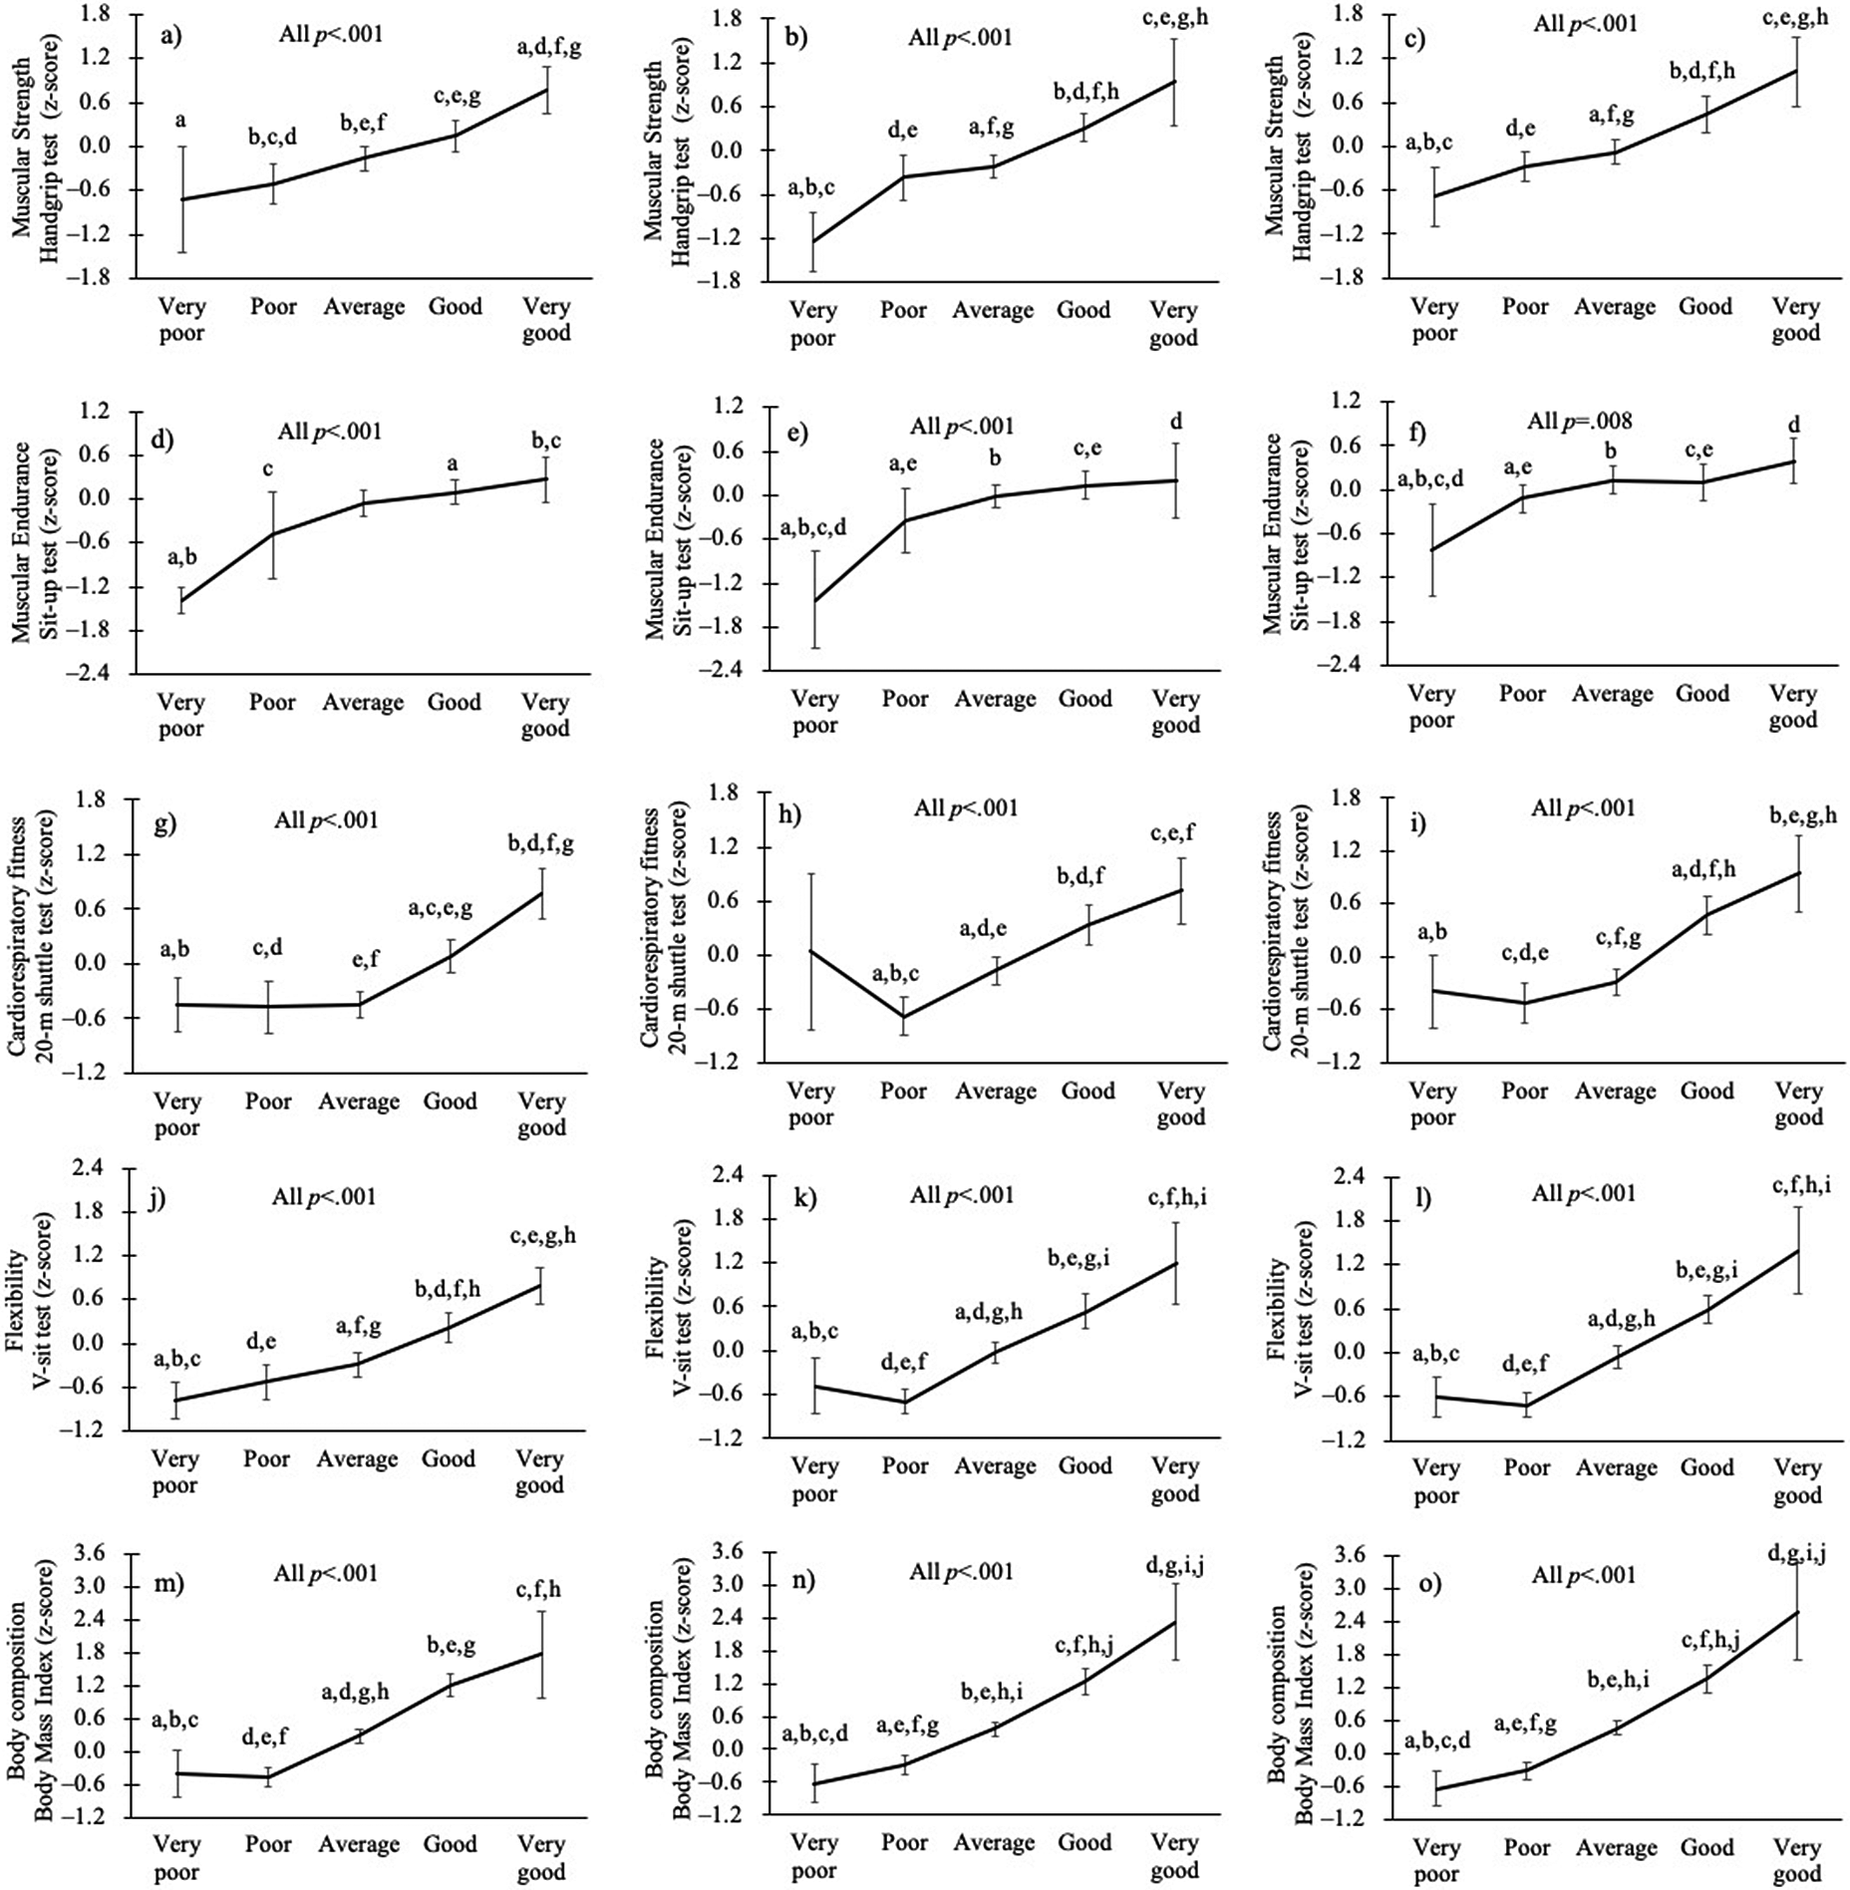
The relationships between the SPHQ-C items and factors, and the fitness dimensions assessed in the fitness tests are shown in Figure 2. Overall, higher values for muscular strength, muscular endurance, cardiorespiratory fitness, flexibility and body composition (ps < .001), were obtained for participants with a high level of self-reported fitness (good and very good categories). These results were observed when the questions of each component were considered independently (i.e. muscular strength: Figures 2a and 2b) and also globally (i.e. muscular strength: Figure 2c).
M ± SD of Normalized Values on Field-based Tests for the Different Fitness Components according to the SPHQ-C Items and Factors. Figure 2. a) Muscular Strength versus Q1; b) Muscular Strength versus Q3; c) Muscular Strength versus Muscular Fitness factor; d) Muscular Endurance versus Q2; e) Muscular Endurance versus Q3; f) Muscular Endurance versus Muscular Fitness factor; g) Cardiorespiratory fitness versus Q4; h) Cardiorespiratory fitness versus Q5; i) Cardiorespiratory fitness versus CF factor; j) Flexibility versus Q6; k) Flexibility versus Q7; l) Flexibility versus Flexibility factor; m) Body composition versus Q8; n) Body composition versus Q9; o) Body composition versus Body composition factor. Same superscripts letters in two points of each graph means statistically significant differences between them (p < .05).

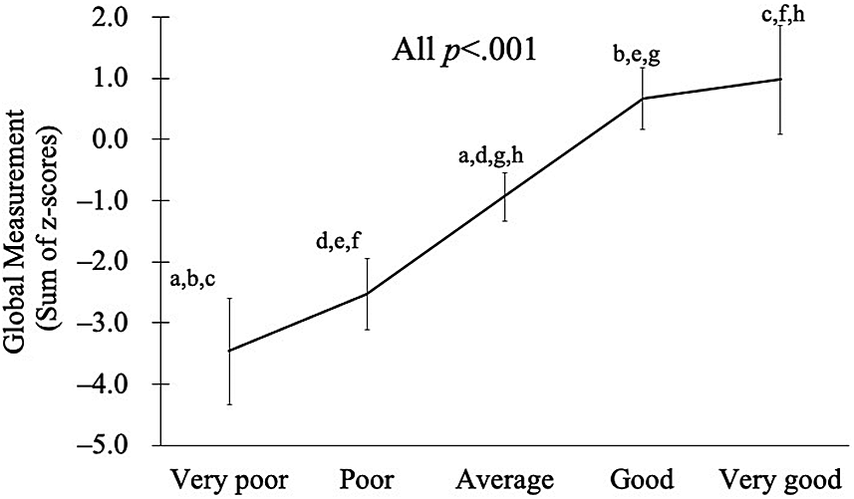
The global score of the SPHQ-C correlated moderately (ρ = –.53; p < .0001) with the sum of normalized scores obtained from the fitness tests. Additionally, when recording the global score of the SPHQ-C in 5 levels of self-reported fitness (ranging from Very Poor [> 30 points] to Very Good [< 16 points]), a clear and statistically significant (p < 0.001) trend in the sum of normalized scores of the fitness tests was detected (Figure 3). Overall, the results showed significant differences in the measured PF components between participants reporting poor and very poor levels, and those showing, good and very good levels.
M ± SD of the Sum of Normalized Values of Field-based Tests According to the Global SPHQ-C Levels. Figure 3. Same superscripts letters in two points of the graph means statistically significant differences between them (p < .05).

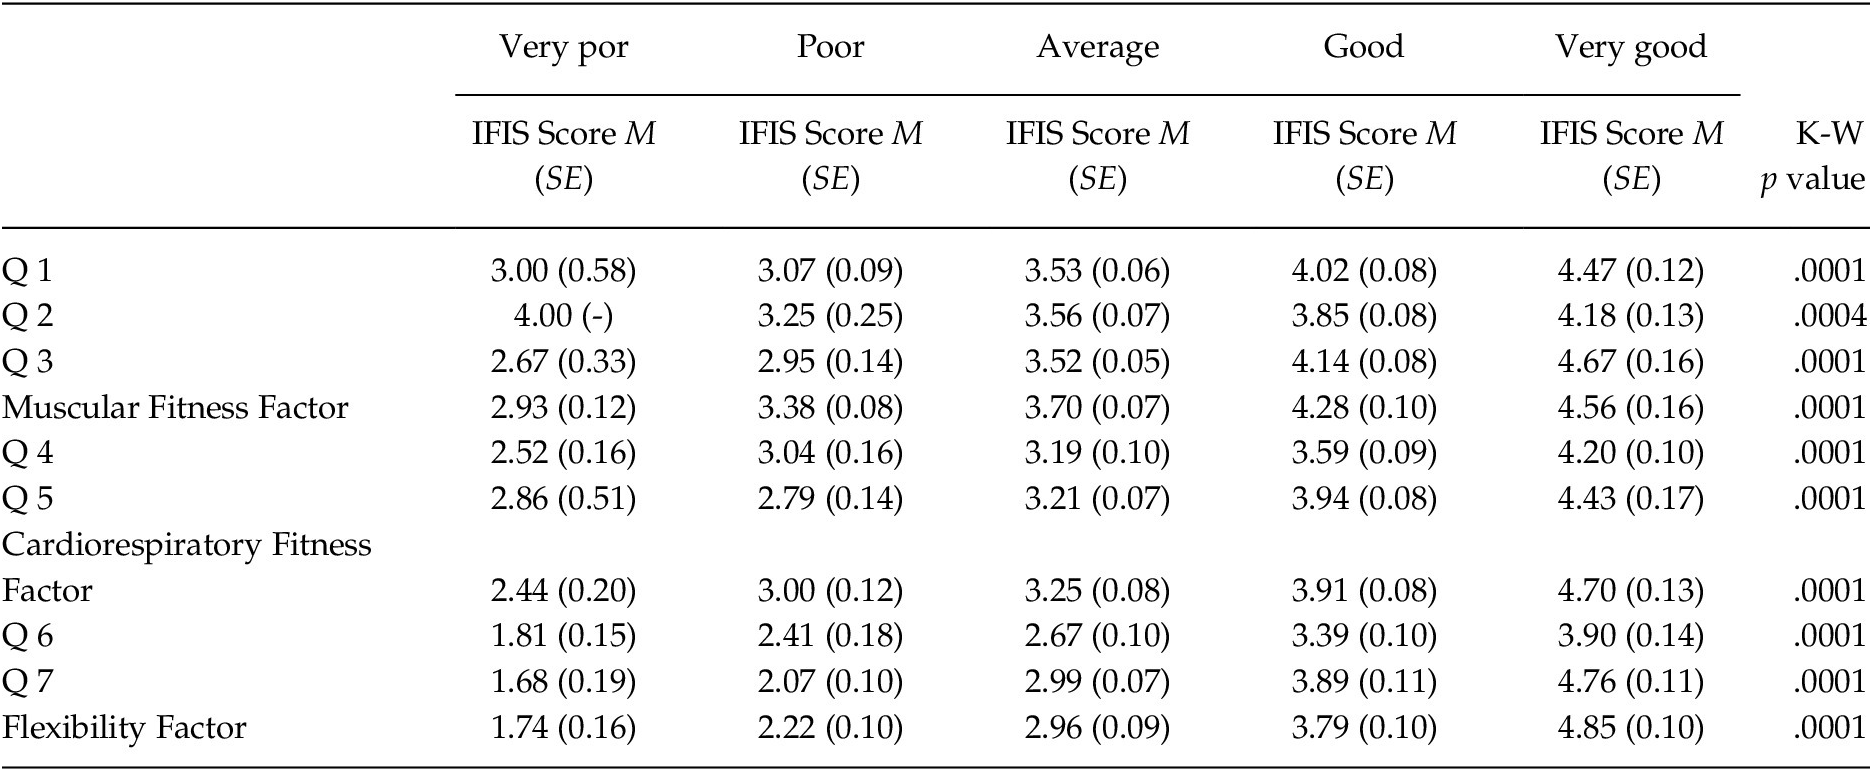
Table 3 shows the results observed after comparing the IFIS scores with the self-reported fitness reflected by the SPHQ-C, both individually (for each item) and globally (for each factor). Increasing averages with statistically significant differences (p < .001) were obtained. The correlations between IFIS and SPHQ-C components were moderate for muscular strength (ρ = –.51), cardiorespiratory fitness (ρ = –.54) and flexibility (ρ = –.68).
IFIS Scores as Mean (SE) for Each Component in the Different Levels of the Corresponding SPHQ-C Questions and Factors

Note. Q = Question; K-W p value = P-value for the global Kruskal-Wallis test for comparison between IFIS scores and HRPF levels.
Discussion
This study was aimed at identifying and analyzing the psychometric properties of a self-perceived HRPF Spanish questionnaire for pre-pubertal children. Self-report of fitness is considered a marker of health that is assessed in epidemiological studies (Olsson et al., Reference Olsson, Ekblom‐Bak, Ekblom, Kallings, Ekblom and Börjesson2018). Additionally, identifying children self-reported fitness level is not only important from a physical health standpoint, but also from a psychological one. For instance, it has been suggested that the self-appraisal of physical capacities contributes to the enhancement of mental health, since improvements in perceived fitness leads to greater self-esteem and a reduction of anxiety (Maâmouri et al., Reference Maâmouri, Brisswalter, Jeddi and Legros2007). In this line, it should be noted that people's self-perceptions are clearly linked to their mental well-being and to their motivational state (Whitehead, Reference Whitehead1995). Thus, it is important to assess the children’s perceptions of their fitness level, since it can help to predict their future engagement in healthy behaviors, such as the performance of physical activity (Jaakkola & Washington, Reference Jaakkola and Washington2011); its research requires reliable and valid instrumentation. Therefore, the findings obtained in this investigation can be of interest to health professionals, given the scarce number of measurement tools of this kind that are currently available for Spanish populations.
In support of the assumption that the SPHQ-C would show sound psychometric properties, the results obtained indicated accurate validity evidence based on internal structure as revealed by the confirmatory factor analysis. This has been also the case for other tools developed for assessing self-perceived fitness in Spanish children. For instance, the four factors (morphological, muscular, motor and cardiorespiratory) included in the EAPAF, also showed a good validity evidence based on internal structure (Cossio-Bolaños et al., Reference Cossio-Bolaños, Vasquez, Luarte-Rocha, Sulla-Torres and Gómez Campos2016). Similarly, the confirmatory factor analysis performed by Estevan et al. (Reference Estevan, Utesch, Dreiskämper, Tietjens, Barnett and Castillo2019), indicated that the seven items included in the P-PSC-C (strength, endurance, speed, coordination, flexibility and general sportiness) showed a very good internal consistency.
In this study, our scale showed a good model fit, as it had been the case for the Physical-Self-Concept Questionnaire, (a tool that consists of five items related to fitness plus one physical appearance item and one global sport competence item) when administered to German children (Lohbeck et al., Reference Lohbeck, Tietjens and Bund2017). Along these lines, the values provided by the Kaiser-Meyer-Olkin measure and Bartlett’s test of sphericity for the SPHQ-C were similar (although the Kaiser values were slightly lower: .64 vs .75) than the ones obtained by Colella et al. (Reference Colella, Morano, Bortoli and Robazza2008), after performing an exploratory factor analysis of the Perceived Physical Ability Scale (PPAS, a 6-item scale that assessed strength, speed, and coordinative abilities) in Italian children.
Internal consistency was questionable when the SPHQ-C was analyzed globally, the reason being that the questionnaire was designed for assessing a health marker (fitness) made up of four separate dimensions. Consequently, since not all the questions measured the same component, internal consistency when analyzed as a whole did not achieve high levels. In accordance with this line of reasoning, good consistency values were obtained when the factors were analyzed separately. A similar trend was observed for the Perceived Physical Competence Scale (a questionnaire consisting of seven items related to fitness, courage, and body dimensions, α = .57–.76) (Lintunen et al., Reference Lintunen, Heikinaro-Johansson and Sherrill1995); the Perceived Fitness Scale (PFS, a tool consisting of items related to fitness and physical condition) (α = .78) (Abadie, Reference Abadie1988); the Colombian IFIS, α = .77–.84 (Ramírez-Vélez et al., Reference Ramírez-Vélez, Cruz-Salazar, Martínez, Cadore, Alonso-Martinez, Correa-Bautista, Izquierdo, Ortega and García-Hermoso2017; or the EAPAF, α = .82–.85 (Cossio-Bolaños et al., Reference Cossio-Bolaños, Vasquez, Luarte-Rocha, Sulla-Torres and Gómez Campos2016).
The SPHQ-C showed a good to excellent test-retest reliability, according to the ICC analysis. Kappa values were higher than those obtained by the IFIS scale in adolescents, κ = .54 – .65 (Ortega et al., Reference Ortega, Ruiz, Romero, Rodriguez, Gómez, Manios, Béghin, Molnar, Kurt, Moreno, Sjöström and Castillo2011) and similar to the values shown in children, κ = .70 (Sánchez-López et al., Reference Sánchez‐López, Martínez‐Vizcaíno, García‐Hermoso, Jiménez‐Pavón and Ortega2015). The accurate reliability showed by the SPHQ-C could be the result of the questionnaire being less difficult and shorter in length, since both factors can help increase the reliability of these scales (Cossio-Bolaños et al., Reference Cossio-Bolaños, Vasquez, Luarte-Rocha, Sulla-Torres and Gómez Campos2016).
The validity evidence based on relations to other variables of the SPHQ-C was analyzed via two procedures. Firstly, the answers to the fitness questions were contrasted with the respective field-based test scores. The results obtained showed that significant associations between them existed, which were along the same lines as those recorded for the Spanish IFIS scale (Ortega et al., Reference Ortega, Ruiz, Romero, Rodriguez, Gómez, Manios, Béghin, Molnar, Kurt, Moreno, Sjöström and Castillo2011). Indeed, moderate correlations were found between both questionnaires. Similarly, the associations between measured and self-reported fitness categories found in this study followed the trend observed in the Colombian IFIS scale (Ramírez-Vélez et al., Reference Ramírez-Vélez, Cruz-Salazar, Martínez, Cadore, Alonso-Martinez, Correa-Bautista, Izquierdo, Ortega and García-Hermoso2017). The fact that the highest degree of association between the self-perceived HRPF questions and the field based tests were observed when the items were grouped as factors advocates including more than one question per fitness component, as in the case of the present questionnaire.
Other studies that have analyzed the degree of association established between the items of a self-perceived fitness questionnaire and the respective field-based test scores have found similar validity coefficient ranges. For instance, Carraro et al., (Reference Carraro, Scarpa and Ventura2010), found moderate associations (r =.05–.60) between the Eurofit tests and the fitness dimensions of the Physical Self-Description Questionnaire, in a sample made up of adolescents. In this line, Mikkelsson et al. (Reference Mikkelsson, Kaprio, Kautiainen, Kujala and Nupponen2005) observed similar associations to the ones reported in the current study, between the self-perceived fitness qualities (endurance, strength, speed and flexibility) reported by a group of adults and the correspondent fitness tests scores (r =.13–.57)
One noteworthy finding is that the muscular endurance question was the one which showed the lowest degree of association when compared to the corresponding fitness dimension, as assessed by means of the field-based muscular endurance test (sit-up test score). In this regard, Monroe et al. (Reference Monroe, Thomas, Lagally and Cox2010), found that muscular endurance was the self-perceived fitness dimension that established the lowest degree of association when compared to the corresponding field-based fitness test (sit-up) in a sample of college students. Similarly, Carraro et al. (Reference Carraro, Scarpa and Ventura2010) observed that muscular fitness perception did not correlate with the score obtained in the sit-up tests after administering the Eurofit test battery to 12–15 year-old children. Therefore, it would seem that when trying to determine self-perceived muscular endurance fitness in children by means of a simple question, a more accurate and elaborate formulation might be needed.
Spanish children of pre-pubertal age can be identified as a group at higher risk of being overweight and obesity (Serra-Majem et al., Reference Serra-Majem, Bartrina, Pérez-Rodrigo, Ribas-Barba and Delgado-Rubio2006). Therefore, the assessment of body composition in this population is a matter of interest. Bearing this in mind, and considering the classical HRPF model developed by Caspersen et al. (Reference Caspersen, Powell and Christenson1985), two questions regarding body composition were included in the SPHQ-C. This is an important fact to be considered since body composition has not usually been taken into account in questionnaires specifically designed for assessing only self-perceived HRPF (i.e. IFIS scale or PPAS). In the current research, both questions, as well as the factor related to body composition, established moderately strong associations with BMI values. Body composition is a HRPF dimension usually included in questionnaires aimed at assessing physical self-concept, since weight status is strongly related to physical appearance (Estevan et al., Reference Estevan, Utesch, Dreiskämper, Tietjens, Barnett and Castillo2019). When the items related to body composition included in these questionnaires have been tested against corresponding objective measurements; similar associations to the one observed here have been recorded. For instance, the item related to body fat included in the Physical Self-Description Questionnaire (a questionnaire that assesses ten aspects of physical self-concept) established a moderately strong association with % body fat (r = .62) in college students (Monroe et al., Reference Monroe, Thomas, Lagally and Cox2010) and with BMI (r = .66) in adolescents (Carraro et al., Reference Carraro, Scarpa and Ventura2010). Moderate, although lower, correlations were observed between skinfold measurements and the attractiveness dimension of the Children's Physical Self-Perception Profile (a questionnaire that assesses sports competence, body attractiveness and strength) (r = .40) in children aged 10–13 (Raudsepp & Liblik, Reference Raudsepp and Liblik2002). All together, these findings suggest that the two body composition questions included in the SPHQ-C are a useful resource to assess self-perceived body composition in prepubescent children.
In this research, we created a field-based total fitness score and compared it with the SPHQ-C total score. The results obtained indicated the existence of a moderate correlation between both measures. To the authors’ knowledge, no similar analysis has been carried out in studies of this kind, preventing further discussion. We can defend the validity evidence based on relations to other variables of the SPHQ-C to some extent on the basis of the results obtained. Indeed, the statistical analysis showed significant differences in the PF components measured between children recording poor and very poor levels, and those recording good and very good levels. In addition, higher field-based test scores were obtained by the participants who showed a high level of self-reported fitness, as it was observed when the IFIS scale was administered to children (Sánchez-López et al., Reference Sánchez‐López, Martínez‐Vizcaíno, García‐Hermoso, Jiménez‐Pavón and Ortega2015). These findings imply that the SPHQ-C is valid when ranking prepubescent schoolchildren according to their directly-measured PF.
The main strength of this research lies in its analysis of the psychometric properties of a questionnaire designed for assessing all the HRPF dimensions in Spanish children. Given the lack of instruments of this kind, the information provided here could be useful for health, PE and fitness professionals. However, there are also several limitations regarding the study design that should be acknowledged. Firstly, no judges or experts in the field of psychometrics were asked to rate and provide their opinion while the questionnaire was being developed. Secondly, it should also be noted that, although the data was gathered by a several researchers, inter-rater reliability was not previously assessed. Thirdly, some issues raised by the COSMIN guide, relevant to the validation of a questionnaire haven’t been assessed or have been assessed in an insufficiently in-depth manner, such as face validity, interpretability, responsiveness or measurement error. Finally, further analysis on a larger and more diverse sample is a necessary next step to be held in order to confirm the accuracy and usefulness of the SPHQ-C.
The SPHQ-C shows a high test-retest reliability and a moderate validity evidence based on relations to other variables when administered to pre-pubertal Spanish school children. These findings imply that this questionnaire can be considered a reliable and valid tool for assessing self-perceived fitness in children, including body composition.
Appendix