1. Introduction
Vortex rings serve as essential building blocks in the excitation of turbulent flows (Shariff & Leonard Reference Shariff and Leonard1992; Matsuzawa et al. Reference Matsuzawa, Mitchell, Perrard and Irvine2023). Since Helmholtz’s pioneering work on vortex rings (Meleshko Reference Meleshko2010), they have been ubiquitous in fundamental fluid mechanics research. Interactions of two vortex rings are often employed as a classical process to study the vortex dynamics (Zaman & Hussain Reference Zaman and Hussain1980; Lim & Nickels Reference Lim and Nickels1992; Chatelain et al. Reference Chatelain, Kivotides and Leonard2003; Xu et al. Reference Xu, Wang, Feng, He and Wang2018; Moffatt & Kimura Reference Moffatt and Kimura2019a , Reference Moffatt and Kimurab ; Shen et al. Reference Shen, Yao, Hussain and Yang2022; Arun & Colonius Reference Arun and Colonius2024; Zhang & Su Reference Zhang and Su2025) and vortex sound (Kambe & Minota Reference Kambe and Minota1983; Kambe, Minota & Takaoka Reference Kambe, Minota and Takaoka1993; Chu et al. Reference Chu, Wang, Chang, Chang and Chang1995; Verzicco et al. Reference Verzicco, Iafrati, Riccardi and Fatica1997; Inoue, Hattori & Sasaki Reference Inoue, Hattori and Sasaki2000; Inoue Reference Inoue2002; Nakashima Reference Nakashima2008; Arun & Colonius Reference Arun and Colonius2024; Zang et al. Reference Zang, Zhou, Liu and Wang2025). Studying the aerodynamic sound generated by the interaction of vortex rings is essential for understanding the aerodynamic sound generated by complex flows (He, Jin & Yang Reference He, Jin and Yang2017; Yao & Hussain Reference Yao and Hussain2022).
The study of sound generated by the interactions of vortex rings can be traced back to Möhring (Reference Möhring1978). M
 $\ddot {\rm o}$
hring related the far-field sound to the radius and axial trajectories of vortex rings, by artificially specifying that the leapfrogging of vortex rings was in the form of cosine and sine in the axial and radial directions, respectively. To account for the vortex-induced motions, Kambe & Minota (Reference Kambe and Minota1981) used the Dyson thin vortex ring model (Dyson Reference Dyson1893) to predict the sound generated by the leapfrogging and head-on collision of two vortex rings. Three peaks in the sound pressure fluctuation caused by the leapfrogging of two vortex rings are identified. Tang & Ko (Reference Tang and Ko1993, Reference Tang and Ko1995a
,
Reference Tang and Kob
, Reference Tang and Ko2003) conducted a detailed investigation of sound generated by vortex ring pairs. They related the sound generated by the vortex ring pairing to the acceleration–deceleration process of the vortex structure (Tang & Ko Reference Tang and Ko1993). Tang & Ko (Reference Tang and Ko2003) decomposed the expression of sound generated by vortex rings into two terms: a term related to the vorticity centroid trajectory and a term related to the vortex core deformation. The high-amplitude and low-frequency sound generated near the coplanar instant was mainly affected by the motion of the vorticity centroid. The vortex core deformation produced high-frequency and low-amplitude sound. Tang & Ko (Reference Tang and Ko1995b
) studied the sound generated by the interaction of two vortex rings of opposite sign. The vortex rings were selected from the Norbury–Fraenkel (Norbury Reference Norbury1973; Fraenkel Reference Fraenkel1972) family of vortex rings. The highest strength of the sound generated by two opposite-sign unequal-strength vortex rings occurs when the vortex rings are coplanar. The radial acceleration of vortex rings dominates the generation of sound in this stage.
The theoretical research mentioned above has quantitatively identified the role of the position, velocity, acceleration and jerk of the vortex ring in the sound source, but the investigations are conducted in inviscid flows. The sound generated by the coaxial interactions of vortex rings in viscous flows has been investigated through numerical simulations and experimental methods. Kambe & Minota (Reference Kambe and Minota1983) detected the sound generated by the head-on collision of two viscous vortex rings with equal initial vortex ring radii and opposite-sign unequal vortex ring circulations. The main effect of viscosity on sound generation was the change of the vortex ring circulations, which can affect the fluctuations of the quadrupolar mode. Verzicco et al. (Reference Verzicco, Iafrati, Riccardi and Fatica1997) conducted a numerical investigation of the aerodynamic sound generated by the leapfrogging of vortex rings in a viscous fluid. The effects of the viscosity and the vorticity gradient in the vortex cores were investigated. Increasing the viscosity in flows can decrease the sound radiation power, while high vorticity gradients can increase the sound power. Inoue et al. (Reference Inoue, Hattori and Sasaki2000) numerically investigated the head-on collision of two vortex rings with equal and unequal initial vortex ring circulations. Then the leapfrogging of two vortex rings was also investigated by Inoue (Reference Inoue2002). He found that sound generated during the collision is related to the change in direction of the vortex ring motion and the far-field sound pressure is scaled by the fourth power of the initial translational velocity of the vortex rings. While studies of inviscid flows have established a clear connection between vortex ring kinematics (e.g. radial and axial motion) and sound generation, investigations of viscous flows have primarily focused on the influence of vorticity distribution and its evolution. Consequently, a direct linkage between the specific vortex ring dynamics and the resultant acoustic output in viscous environments remains to be inadequately quantified. In particular, the prevalent conclusion drawn from inviscid models – that the weaker ring’s radial acceleration dominates the sound source – has not been rigorously validated under viscous conditions. Therefore, the role of kinematic parameters of vortex rings in sound generation in viscous flows is yet to be explored.
Previous researches have emphasised the radial motion of vortex rings, such as the radial acceleration and the transition of vortex ring motion from axial to radial, as the dominant factor contributing to sound source. However, more intense axial motion than radial motion is observed during the ‘slip-through’ interaction of vortex rings with unequal strengths. We hypothesise that previous conclusions, such as regarding the radial acceleration as the dominant dynamics, may be unrepresentative due to the restricted interaction pattern. The diverse patterns of the interaction between two vortex rings are observed in a broader parameter space. The validity of the phenomenon that the weaker ring dominates the sound source under different kinematic scenarios requires further verification. This paper aims to re-evaluate the relationship between the dynamics of vortex ring centroids and far-field sound across a broader parameter space. We simulate numerically the interaction process of two viscous vortex rings under different initial circulation ratios and radius ratios. The two vortex rings undergo acceleration and deceleration in the axial direction and stretching in the radial direction under self- and mutually induced motions, which can be represented by vorticity centroids. The detailed evolutions of sound sources during the coaxial collision of two vortex rings with different initial configurations are obtained by numerically solving the Navier–Stokes equations in the near field. The sound at the far field is predicted by the vortex sound theory (Kambe & Minota Reference Kambe and Minota1983). A detailed study is conducted to combine the sound generation with vortex ring dynamics. We identify the conditions for the appearance of the phenomenon that the weaker ring’s radial acceleration dominates the sound source.
The remainder of this paper is organised as follows. The methods used to analyse the near-field flows and far-field sound are reported in § 2. The initial configuration of two vortex rings and the numerical set-ups are reported in § 3. The results and discussion of the evolution of vortex dynamics and sound sources are given in § 4. Finally, the conclusions are drawn in § 5.
2. Aerodynamic sound generated by vortical flows
We investigate the far-field aerodynamic sound generated by localised vortical flows at low Mach numbers, where the length scale of the vortical flows is much less than that of sound waves. According to the vortex sound formula based on the matched asymptotic expansion proposed by Kambe & Minota (Reference Kambe and Minota1981), the whole field can be separated into two regions: inner flow region and outer wave region. The vortical flow is compact in the inner flow and at a low Mach number
 $ \textit{Ma}$
, which is defined by the characteristic velocity of vortical flow and the sound speed of the fluid in the undisturbed flow. The characteristic velocity of the interactions of vortex rings in this work is chosen as the initial translational velocity of the vortex ring. The vorticity decays along the distance from the inner flow to the far field. Therefore, the outer wave region can be governed by a homogeneous wave equation. The evolution of the vortical flows in the inner flow region is governed by the unsteady Navier–Stokes equations for incompressible flows, neglecting the terms of
 $O(\textit{Ma}^2)$
(Crow Reference Crow1970; Kambe Reference Kambe1986):
 \begin{align} \frac {\partial \boldsymbol{\mathit{u}} }{\partial t} + \bigtriangledown \boldsymbol{\cdot }\left (\boldsymbol{\mathit{u}}\boldsymbol{\mathit{u}} \right ) & =-\bigtriangledown p + \frac {1}{\textit{Re}} \bigtriangledown ^{2} \boldsymbol{\mathit{u}}, \\[-12pt] \nonumber \end{align}
 \begin{align} \bigtriangledown \boldsymbol{\cdot }\boldsymbol{\mathit{u}} & =0, \\[10pt] \nonumber \end{align}
where
 $\mathit{p}$
is the non-dimensional pressure of the flow,
 $\boldsymbol{\mathit{u}}$
is the non-dimensional velocity vector and
 $ \textit{Re}$
is the Reynolds number. Then an outer solution is sought so as to match the inner solution just obtained by numerical simulation. The far-field sound can be expressed in the form of multipole expansions. More details of the matched asymptotic expansion are reported by Kambe (Reference Kambe2010).
For low-Mach-number flow, the monopole mode of far-field sound can be neglected because it is much smaller than the quadrupolar mode (Howe Reference Howe2003). For the far-field sound pressure generated by the coaxial collision of two axisymmetric vortex rings proposed by Kambe (Reference Kambe2010) in a cylindrical coordinate system:
 \begin{align} p'(\boldsymbol{x},t) & =\frac {{{\rho _0}}}{{4c_0^2\left | \boldsymbol{\mathit{x}} \right |}}\frac {\partial ^3}{\partial t^3}Q \left ( t-\frac {\left | \boldsymbol{\mathit{x}} \right |}{c_{0} } \right )\left ( \cos ^2\theta -\frac {1}{3} \right ) \!, \\[-12pt] \nonumber \end{align}
 \begin{align} Q (t) & = \iint z r^{2} \omega _{\phi }\, {\rm d}z\,{\rm d}r , \\[10pt] \nonumber \end{align}
where
 $\boldsymbol{\mathit{x}}$
represents the position vector of the observer points,
 $\rho _0$
and
 $c_0$
are the density and sound speed of the fluid in the undisturbed flow, respectively,
 $\theta$
represents the angle between the line connecting the acoustic observers and the origin and the z-axis,
 $Q$
is the second moments of the vorticity and
 $\omega _{\phi }$
is the azimuth components of vorticity in the cylindrical coordinate system. This suggests that the far-field sound is generated by the changes in the distribution of the vorticity field.
3. Numerical method and set-ups
3.1. The initial configuration of two vortex rings
The coaxial collision of two vortex rings investigated in this work is axisymmetric and swirl-free. We use a cylindrical coordinate system
 $ ( r,\phi ,z )$
to investigate the flows and sound generated by the vortex rings, as shown in figure 1(a). Coordinates
 $r$
,
 $\phi$
and
 $z$
are the radius, azimuth angle and height in the cylindrical coordinate system, respectively. Due to the axisymmetry of vortex rings, the numerical simulation is conducted in a meridional plane
 $\phi =0^\circ$
, as shown in figure 1(b). Vortex rings investigated in our work remain axisymmetric during the interactions and the development of azimuthal waves is neglected. The fully three-dimensional validation simulations and the discussion of the azimuthal waves are reported in Appendix A. Two vortex rings are labelled as subscripts
 $S$
and
 $W$
, respectively. The subscript
 $S$
represents the ring with the larger absolute values of circulation
 $\varGamma _{S0}$
(hereinafter referred to as the stronger ring) and the subscript
 $W$
represents the ring with the smaller absolute values of circulation
 $\varGamma _{W0}$
(hereinafter referred to as the weaker ring). Without loss of generality, we assume that the stronger ring moves along the positive
 $z$
axis and the weaker ring moves along the negative
 $z$
axis in the initial stage under all configurations in the present study, as shown in figure 1. Terms
 ${Z_i},{R_i}$
represent the axial position and radius of the vortex ring, respectively. Here, the subscript
 $i$
represents
 $S$
,
 $W$
. Parameter
 $\sigma _i$
represents the radius of the vortex core. Parameters affecting vortex ring interactions include initial vortex ring circulation ratio
 \begin{align} \gamma =\left | \varGamma _{W0} / \varGamma _{S0} \right | , \end{align}
initial axial separation
 $d=C / R_{S0}$
, initial vortex ring radius ratio
 \begin{align} \eta =R_{W0} / R_{S0} \end{align}
and the initial core-to-ring ratio
 $n={\sigma _{i0}} / {R_{i0}}$
. The initial circulation of the stronger ring
 $\varGamma _{S0}$
and initial radius of the stronger ring
 $R_{S0}$
are chosen as the reference variables. All the variables hereinafter are normalised by the reference length
 $R_{S0}$
and the reference velocity
 $\varGamma _{S0}/R_{S0}$
, unless otherwise specified. The reference time is chosen as
 ${R_{S0}^2} / {{\varGamma _{S0}}}$
.
The initial configuration of the coaxial collision of two vortex rings (a) in a cylindrical coordinate system and (b) in a meridional plane
 $\phi =0^\circ$
. (c) The vorticity distribution inside the vortex core of the stronger ring.

The initial distribution of vorticity in the core is taken as a Gaussian distribution (Verzicco et al. Reference Verzicco, Iafrati, Riccardi and Fatica1997; Inoue et al. Reference Inoue, Hattori and Sasaki2000):
 \begin{align} \omega (\sigma) =\frac {\varGamma _0}{\pi \sigma _0^2}\mathrm{exp}\left [ -\left ( \frac {\sigma }{\sigma _{0} } \right )^{2} \right ]\! , \end{align}
where
 $\varGamma _{i0}, \sigma _{i0}$
are the vortex ring circulation and vortex core radius, respectively, and
 $\sigma ^2=(r-R_{i0})^2+(z-Z_{i0})^2$
is the distance from the centre of the vortex core (Kida, Takaoka & Hussain Reference Kida, Takaoka and Hussain1991; Verzicco et al. Reference Verzicco, Iafrati, Riccardi and Fatica1997; Inoue et al. Reference Inoue, Hattori and Sasaki2000). The vortex core radius
 $\sigma _0$
is chosen as
 ${\rm e}^{-1}$
-fold radius of the core, where the vorticity drops to
 $1/{\rm e}$
of its peak value at the centre. The peak value of vorticity inside the vortex core is defined as
 $\omega _{\textit{max}} = \varGamma _0 / (\pi \sigma _0^2)$
. The profile of the initial vorticity field is shown in figure 1(c). The initial velocity field tangential to the core can be defined by (Colonius, Lele & Moin Reference Colonius, Lele and Moin1994; Verzicco et al. Reference Verzicco, Iafrati, Riccardi and Fatica1997)
 \begin{align} u_{\varphi } (\sigma) =\frac {\varGamma _0}{2\pi \sigma }\left [1 - \mathrm{exp}\left ( -\left ( \frac {\sigma }{\sigma _{0} } \right )^{2} \right ) \right ]\! . \end{align}
The subscript
 $\varphi$
represents the angle around the vortex core centre.
In the present study, the effects of the initial vortex ring circulation ratio
 $\gamma$
and the initial vortex ring radius ratio
 $\eta$
on the vortex sound generation are investigated. The initial axial separation
 $d$
and the initial core-to-ring ratio
 $n$
are fixed at
 $d=4 \text{ and } n=0.15$
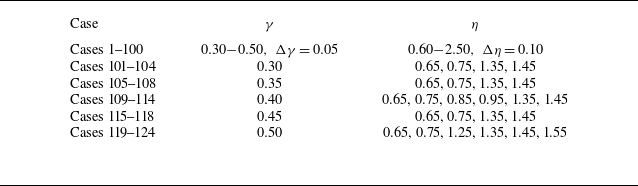
, respectively. The parameters for 124 different configurations are listed in table 1. The initial vortex ring circulation ratio
 $\gamma$
investigated in this work spans from 0.30 to 0.50 and the initial vortex ring radius ratio
 $\eta$
spans from 0.60 to 2.50. Cases 1–100 represent initial configurations sampled at discrete intervals of 0.05 and 0.10 for the initial circulation ratio
 $\gamma$
and radius ratio
 $\eta$
, respectively. Cases 101–124 are selected to provide a clearer illustration of the evolution of the sound source with respect to the initial configurations. The Reynolds number defined by
 $ \textit{Re}=\varGamma _{S0}/\nu$
is set as 1838, where
 $\nu$
is the kinematic viscosity of the fluid. The Reynolds number is the same as in the setting of Inoue et al. (Reference Inoue, Hattori and Sasaki2000) (the Reynolds number defined by the initial translational velocity is set as 500). The numerical simulations are conducted at a low Reynolds number to ensure that the vortex rings do not develop azimuthal waves.
All configurations investigated in this work, specified by the initial circulation ratio
 $\gamma$
and radius ratio
 $\eta$
.

3.2. The set-ups of numerical simulation
The unsteady Navier–Stokes equations for incompressible flows (2.1) are numerically solved by using a solver within the framework of OpenFOAM. A fourth-order finite-volume method is used in spatial discretisation. Time advancement is implemented using the fourth-order Runge–Kutta method. The simulation of the axisymmetric flow is conducted in a domain which is a wedge of
 $r \in [ 0,6.0 ]$
,
 $z \in [ 0,18.0 ]$
. The axis of symmetry of the wedge is the
 $z$
axis. The meridional plane is located at
 $\phi =0^\circ$
. A slip boundary condition is used in the
 $z$
direction and the upper boundary in the
 $r$
direction. The domain is discretised on a mesh with
 $ 1800\times 600$
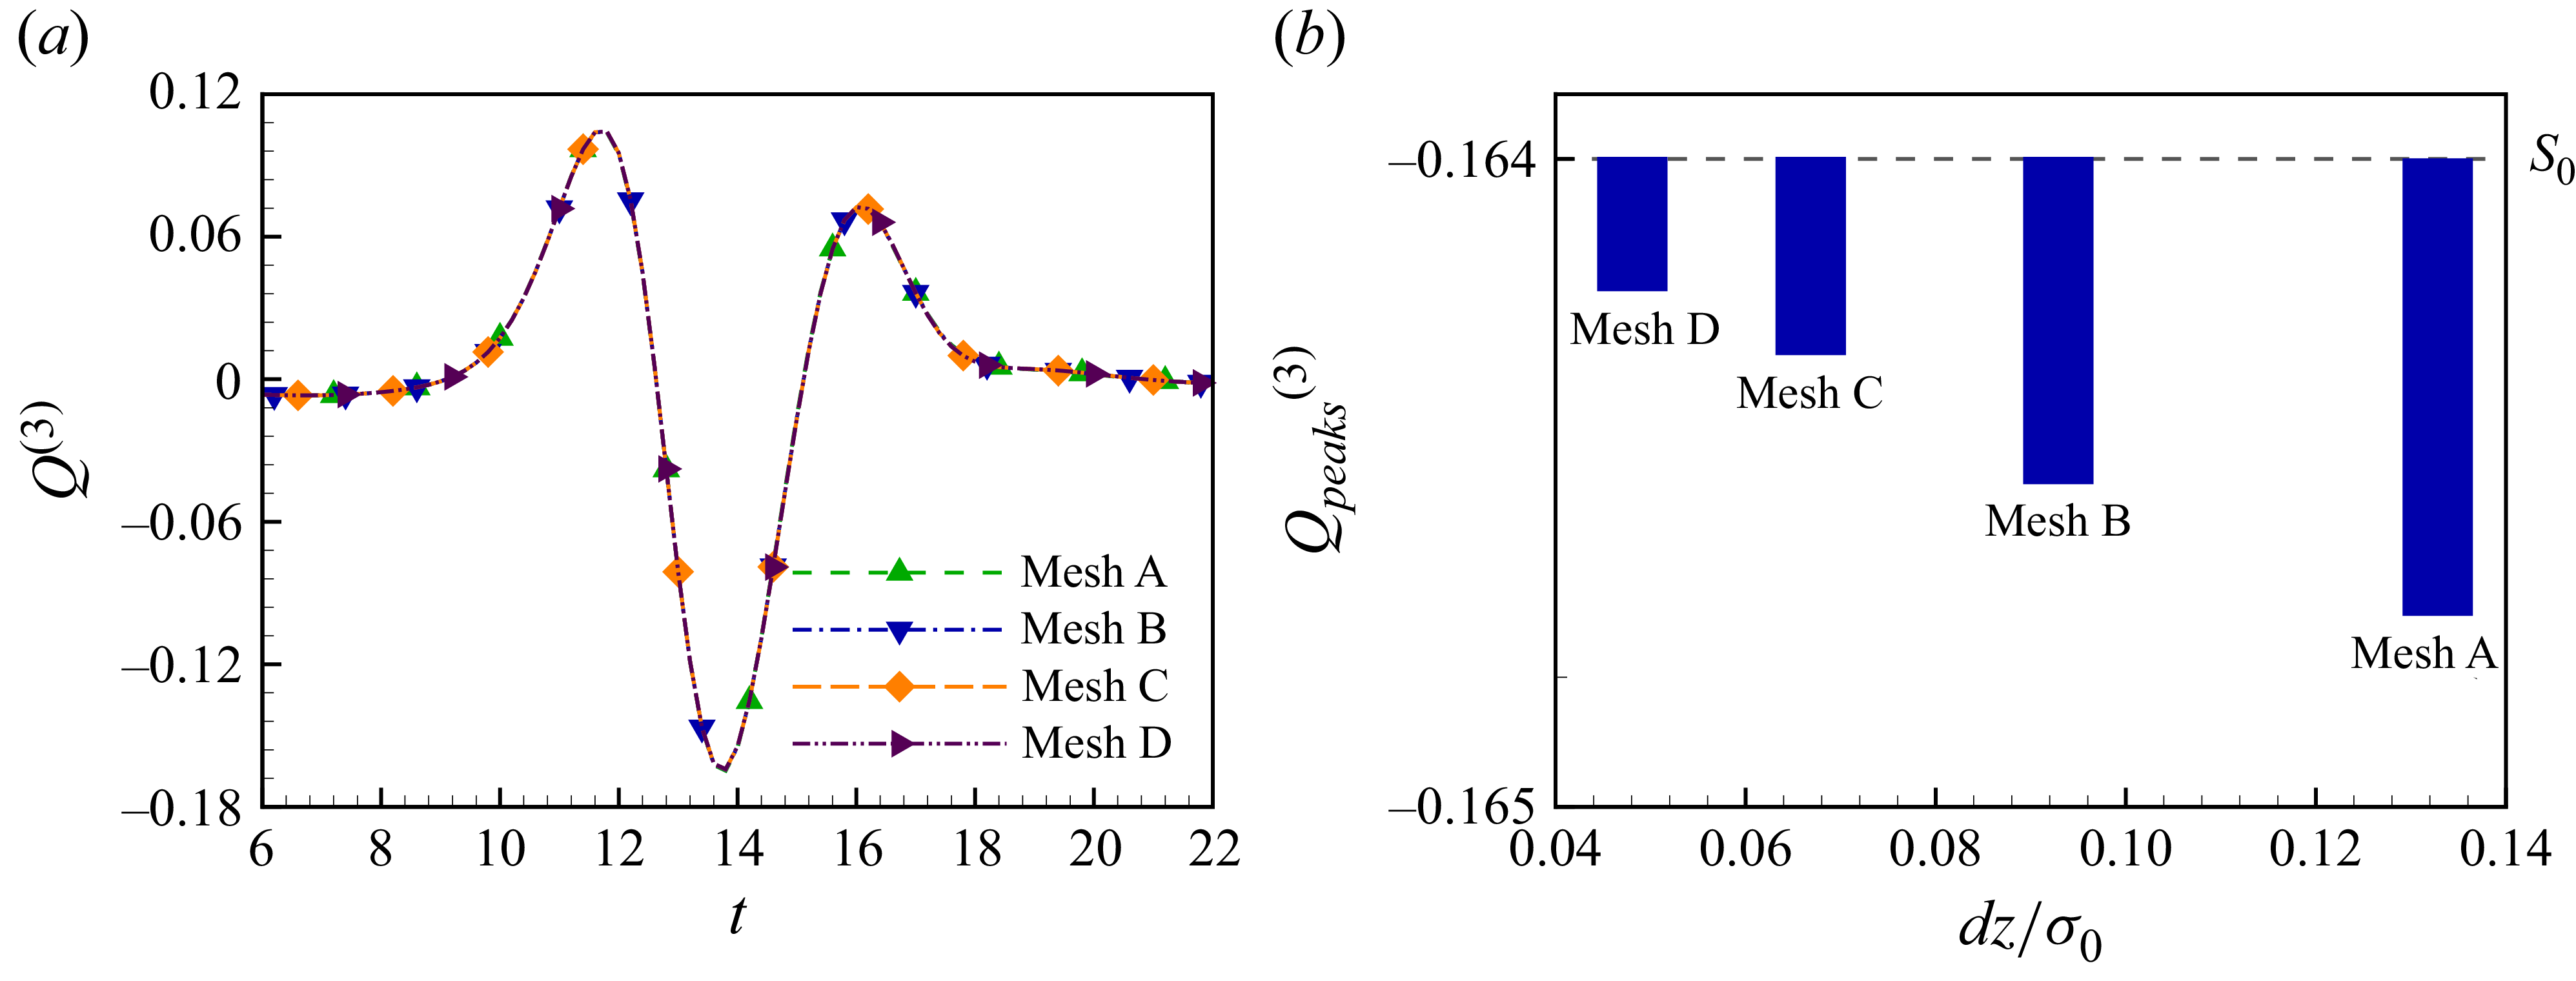
cells for all cases investigated in our work. A grid convergence analysis is conducted in the case of the initial circulation ratio
 $\gamma =0.5$
and initial radius ratio
 $\eta =0.8$
. Four different grid resolutions are used to discretise the domain, which are mesh A (
 $900\times 300$
), mesh B (
 $1275\times 425$
), mesh C (
 $1800\times 600$
) and mesh D (
 $2500\times 850$
). Figure 2 shows the difference between the sound source
 $Q^{(3)}$
simulated in the four grid resolutions and the exact solution. The exact solution is obtained by the method of verification procedures proposed by Xing & Stern (Reference Xing and Stern2010) based on meshes B, C and D. Considering the balance between the resolution and the computational cost, the grid length for the simulation of the head-on collision of vortex rings is taken as the same as that of mesh C. The time step is set as
 $\Delta t = 0.001$
and the simulation duration is
 $T_E=30$
.
The grid convergence analysis of the numerical simulation. (a) The fluctuations of the source
 $Q^{(3)}$
and (b) the change in the negative peaks with the ratio between the grid length and the initial radius of the vortex core.

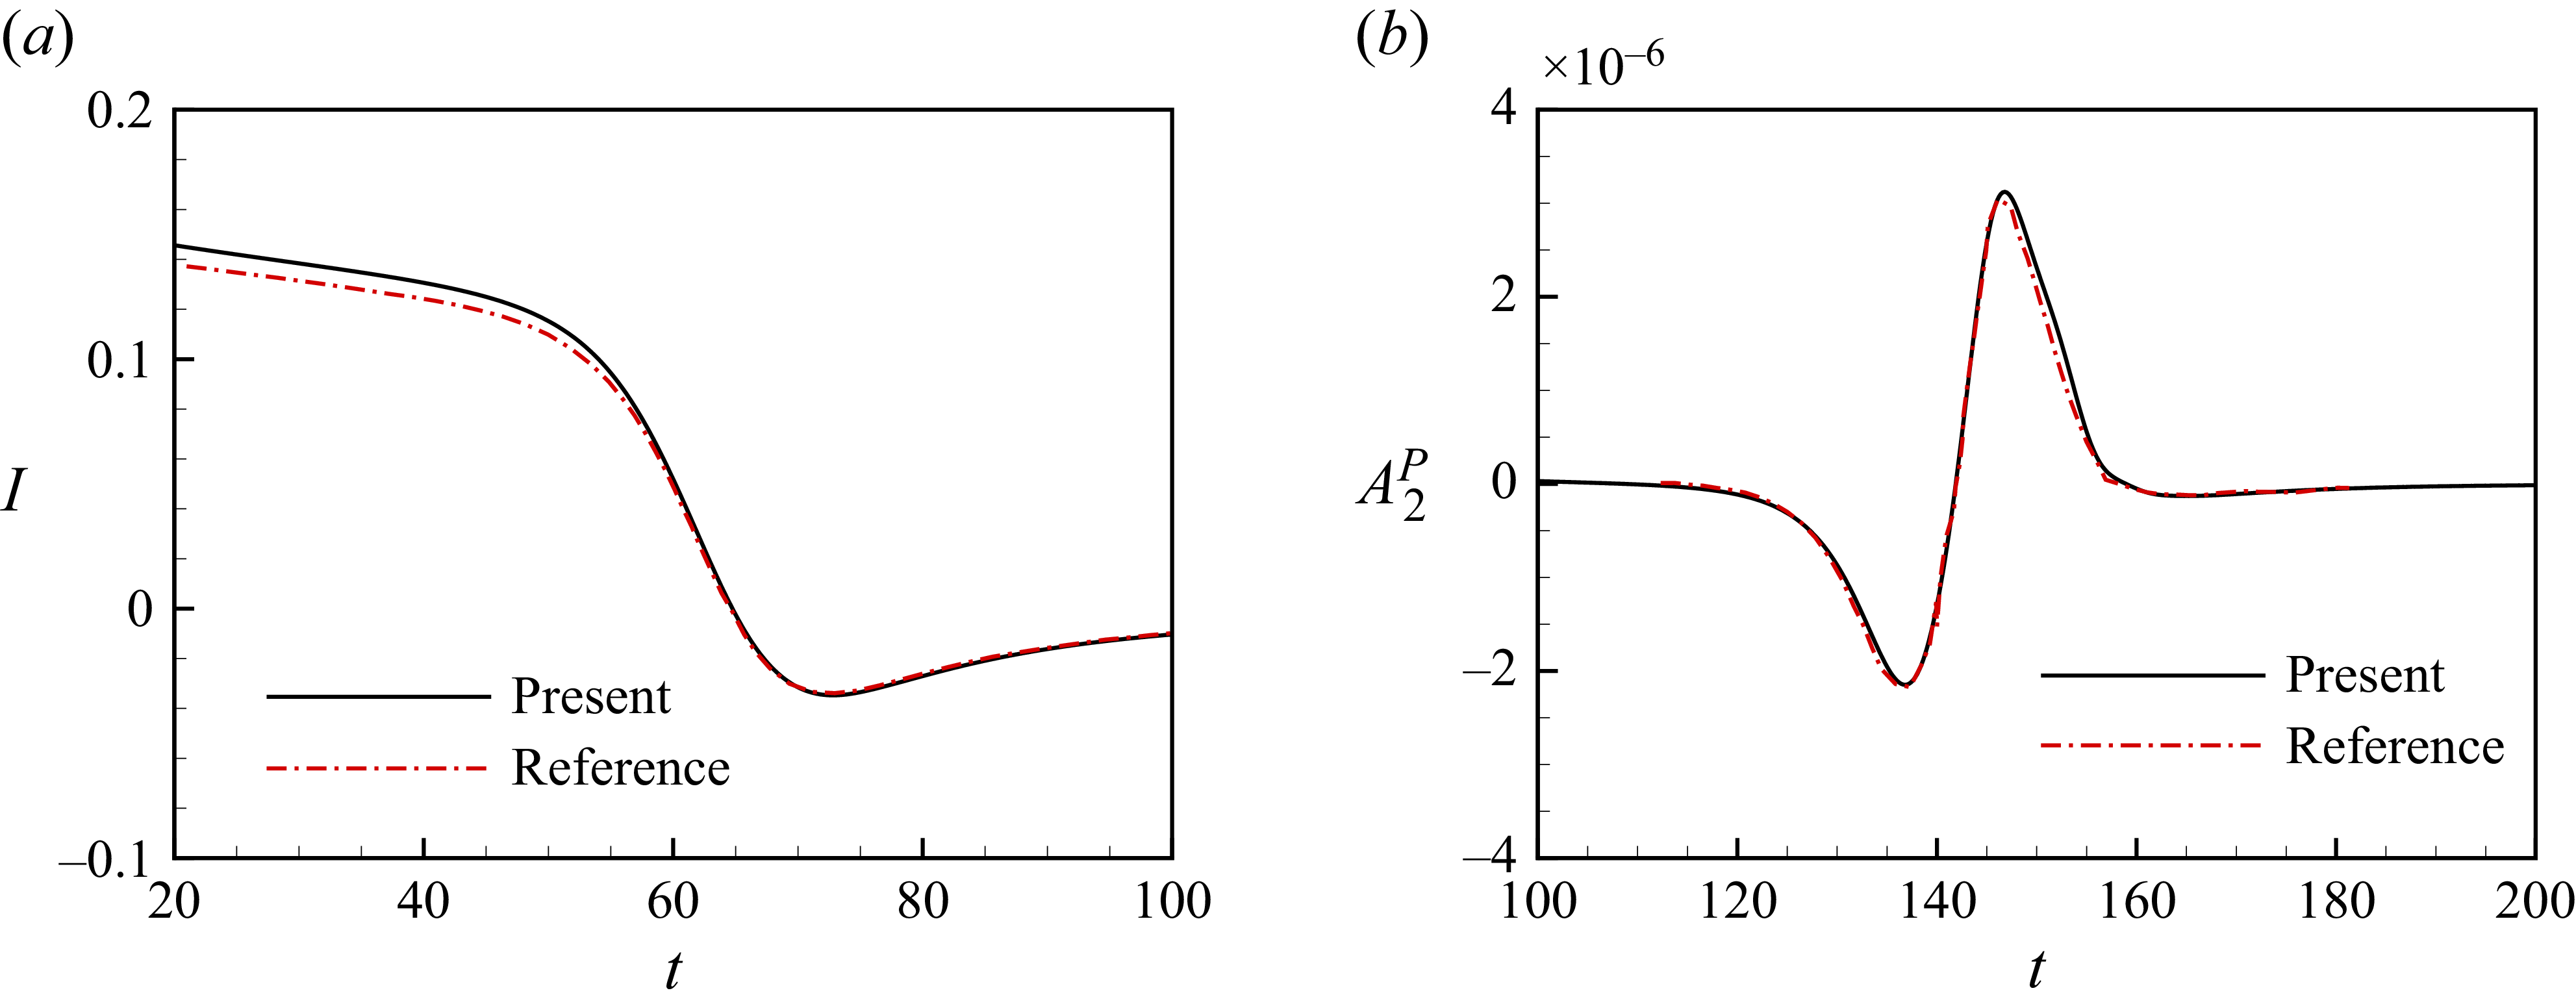
To validate the present numerical method and solver, the head-on collision of two coaxial vortex rings with the same initial parameters as those of Inoue et al. (Reference Inoue, Hattori and Sasaki2000) is simulated numerically. Figure 3 shows comparisons of the moment
 $I$
and the quadrupolar component
 $A_{2}^P$
of the sound pressure generated by the head-on collision of two coaxial vortex rings between the present simulation and that of Inoue et al. (Reference Inoue, Hattori and Sasaki2000). The moment and the quadrupolar component are computed by
 \begin{align} I & = Q^{(1)}(t), \\[-12pt] \nonumber \end{align}
 \begin{align} A_{2}^P & = \frac {1}{6\left | \boldsymbol{\mathit{x}} \right |} Q^{(3)}(t), \\[10pt] \nonumber \end{align}
which are the first- and third-order time derivative of the second moment of the vorticity, respectively. Figure 3(b) shows that the difference of the quadrupolar component in the peak values in the second pulse between the present results and the reference is 4 %. The result obtained by the present simulation is in good agreement with the direct numerical simulation of Inoue et al. (Reference Inoue, Hattori and Sasaki2000). The present numerical method and solver were also validated by simulating numerically the interactions of a vortex ring with other configurations including an oblique collision (Kambe et al. Reference Kambe, Minota and Takaoka1993; Nakashima Reference Nakashima2008), head-on collision (Chu et al. Reference Chu, Wang, Chang, Chang and Chang1995) and leapfrogging (Verzicco et al. Reference Verzicco, Iafrati, Riccardi and Fatica1997). More details of the validations can be found in our previous work (Zang et al. Reference Zang, Zhou, Liu and Wang2025).
The comparison of (a) the moment and (b) the sound pressure at
 $| \boldsymbol{\mathit{x}} |=80$
between the present numerical simulation and that of Inoue et al. (Reference Inoue, Hattori and Sasaki2000).

4. Results and discussion
In this section, we present the vortical flows and sound source generated by the coaxial collision of two vortex rings. The dynamics of vortex rings is reported in § 4.1. The sound sources generated by the coaxial collision of two vortex rings are reported in § 4.2. The decompositions of the source are reported and discussed in § 4.3. The contribution to the source from the stronger/weaker ring are reported and discussed in § 4.4. The effect of the vorticity centroid dynamics on the sound source is discussed in § 4.5.
4.1. Interaction between two vortex rings
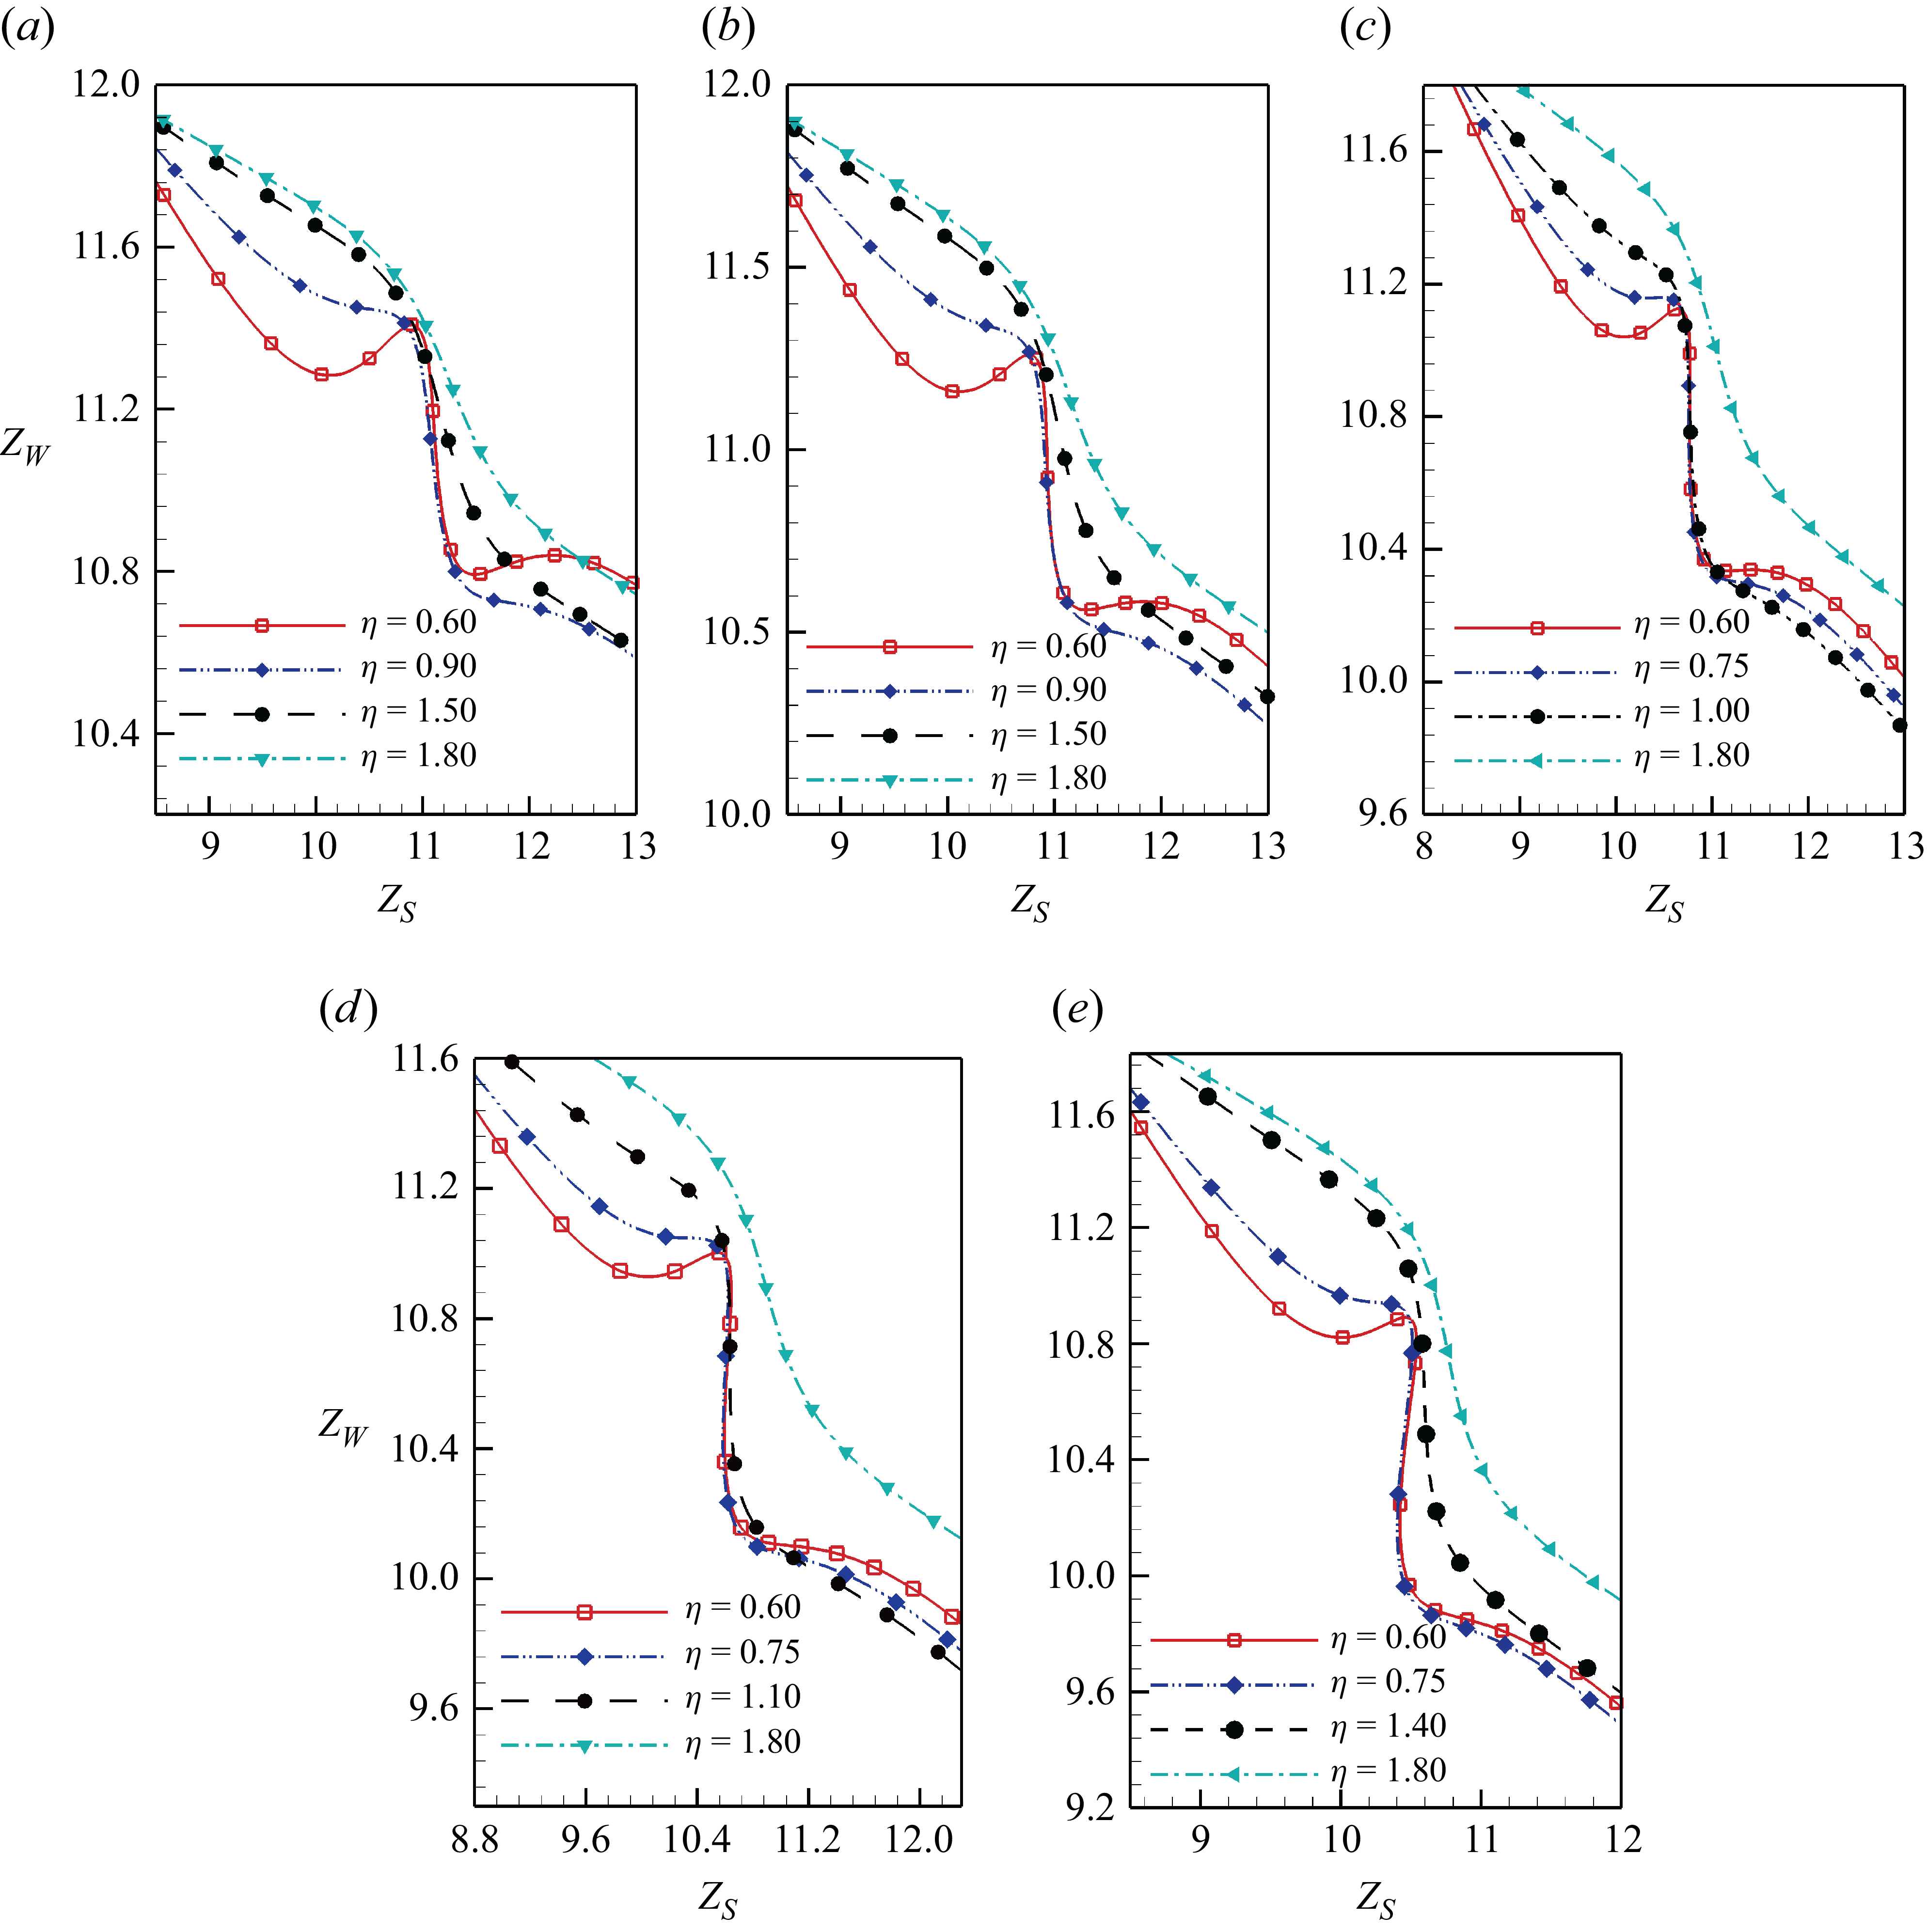
The axial positions
 $Z_S,Z_W$
of two vortex rings with initial configurations of the representative initial radius ratios for initial circulation ratios (of a)
 $\gamma =0.3$
, (b)
 $\gamma =0.35$
, (c)
 $\gamma =0.4$
, (d)
 $\gamma =0.45$
and (e)
 $\gamma =0.5$
.

A classification of all cases investigated in our work. The  symbol represents the case that the weaker ring exhibits reverse motion,
 represents the case that the stronger ring exhibits reverse motion,
 represents the case that both the stronger and weaker rings exhibit reverse motion and ‘
 ’ represents the case that two vortex rings maintain their forward direction. The background is shaded with the total reversal displacement of two vortex rings
 $\delta {Z}_S + \delta {Z}_W$
.

The interaction of the coaxial collisions between vortex rings depends on the initial configurations. Figure 4 shows the phase plot of axial positions of two vortex rings during the interactions. For the sake of visual clarity, only a limited number of representative cases are presented. For the cases with relatively small initial radius ratios, such as
 $\eta =0.60$
, the trajectories of the axial position exhibit multiple extrema. This indicates that the vortex rings undergo reverse motion during the interaction. For the cases with relatively large initial radius ratios, such as
 $\eta \geqslant 1.50$
, the trajectories of the axial positions of the weaker rings monotonically decrease as the trajectories of the axial positions of the stronger rings increase. In these cases with relatively small initial radius ratios, the trajectories of the weaker rings exhibit a steep drop. The stronger rings move only slightly in the
 $z$
direction and the weaker rings move leftward by approximately 0.8 non-dimensional units.
Figure 5 shows the classification of all cases investigated in this work based on whether the stronger or the weaker ring undergoes reverse motion. The total reversal displacement of two vortex rings
 $\delta Z_S + \delta Z_W$
for all cases investigated in this work is also plotted in figure 5, where
 $\delta Z_S, \delta Z_W$
represent the reversal displacement of the stronger ring and the weaker ring, respectively. When the initial vortex ring radius and circulation ratio are both relatively small, only the weaker rings exhibit reverse motion, as labelled by ‘’ in figure 5. The reversal displacement of the weaker rings is positive. This category is referred to as Pattern I. When initial vortex ring radius ratios are relatively large (
 $0.80 \leqslant \eta \leqslant 1.35$
) and initial vortex ring circulation ratios
 $\gamma$
are relatively large, for example
 $\gamma =0.45, 0.50$
, only the stronger rings exhibit reverse motion, as labelled by ‘’ in figure 5. The reversal displacement of the stronger rings is negative. This category is referred to as Pattern II. When initial vortex ring radius ratios are relatively small (
 $\eta =0.60, 0.65, 0.70$
) and initial vortex ring circulation ratios
 $\gamma$
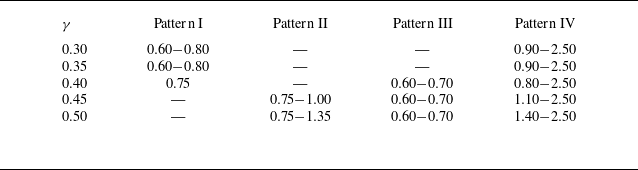
are relatively large, both the stronger and weaker rings exhibit reverse motion, as labelled by ‘’ in figure 5. The total reversal displacement undergoes a sign reversal from positive to negative. This category is referred to as Pattern III. Vortex rings maintain their forward direction of motion in other cases, as labelled by ‘’ in figure 5. The total reversal displacement is zero. This category is referred to as Pattern IV. A clear classification of all cases investigated in this work is presented in table 2.
Classification of patterns under different initial configurations.

Figure 6 shows the axial positions
 $Z_S,Z_W$
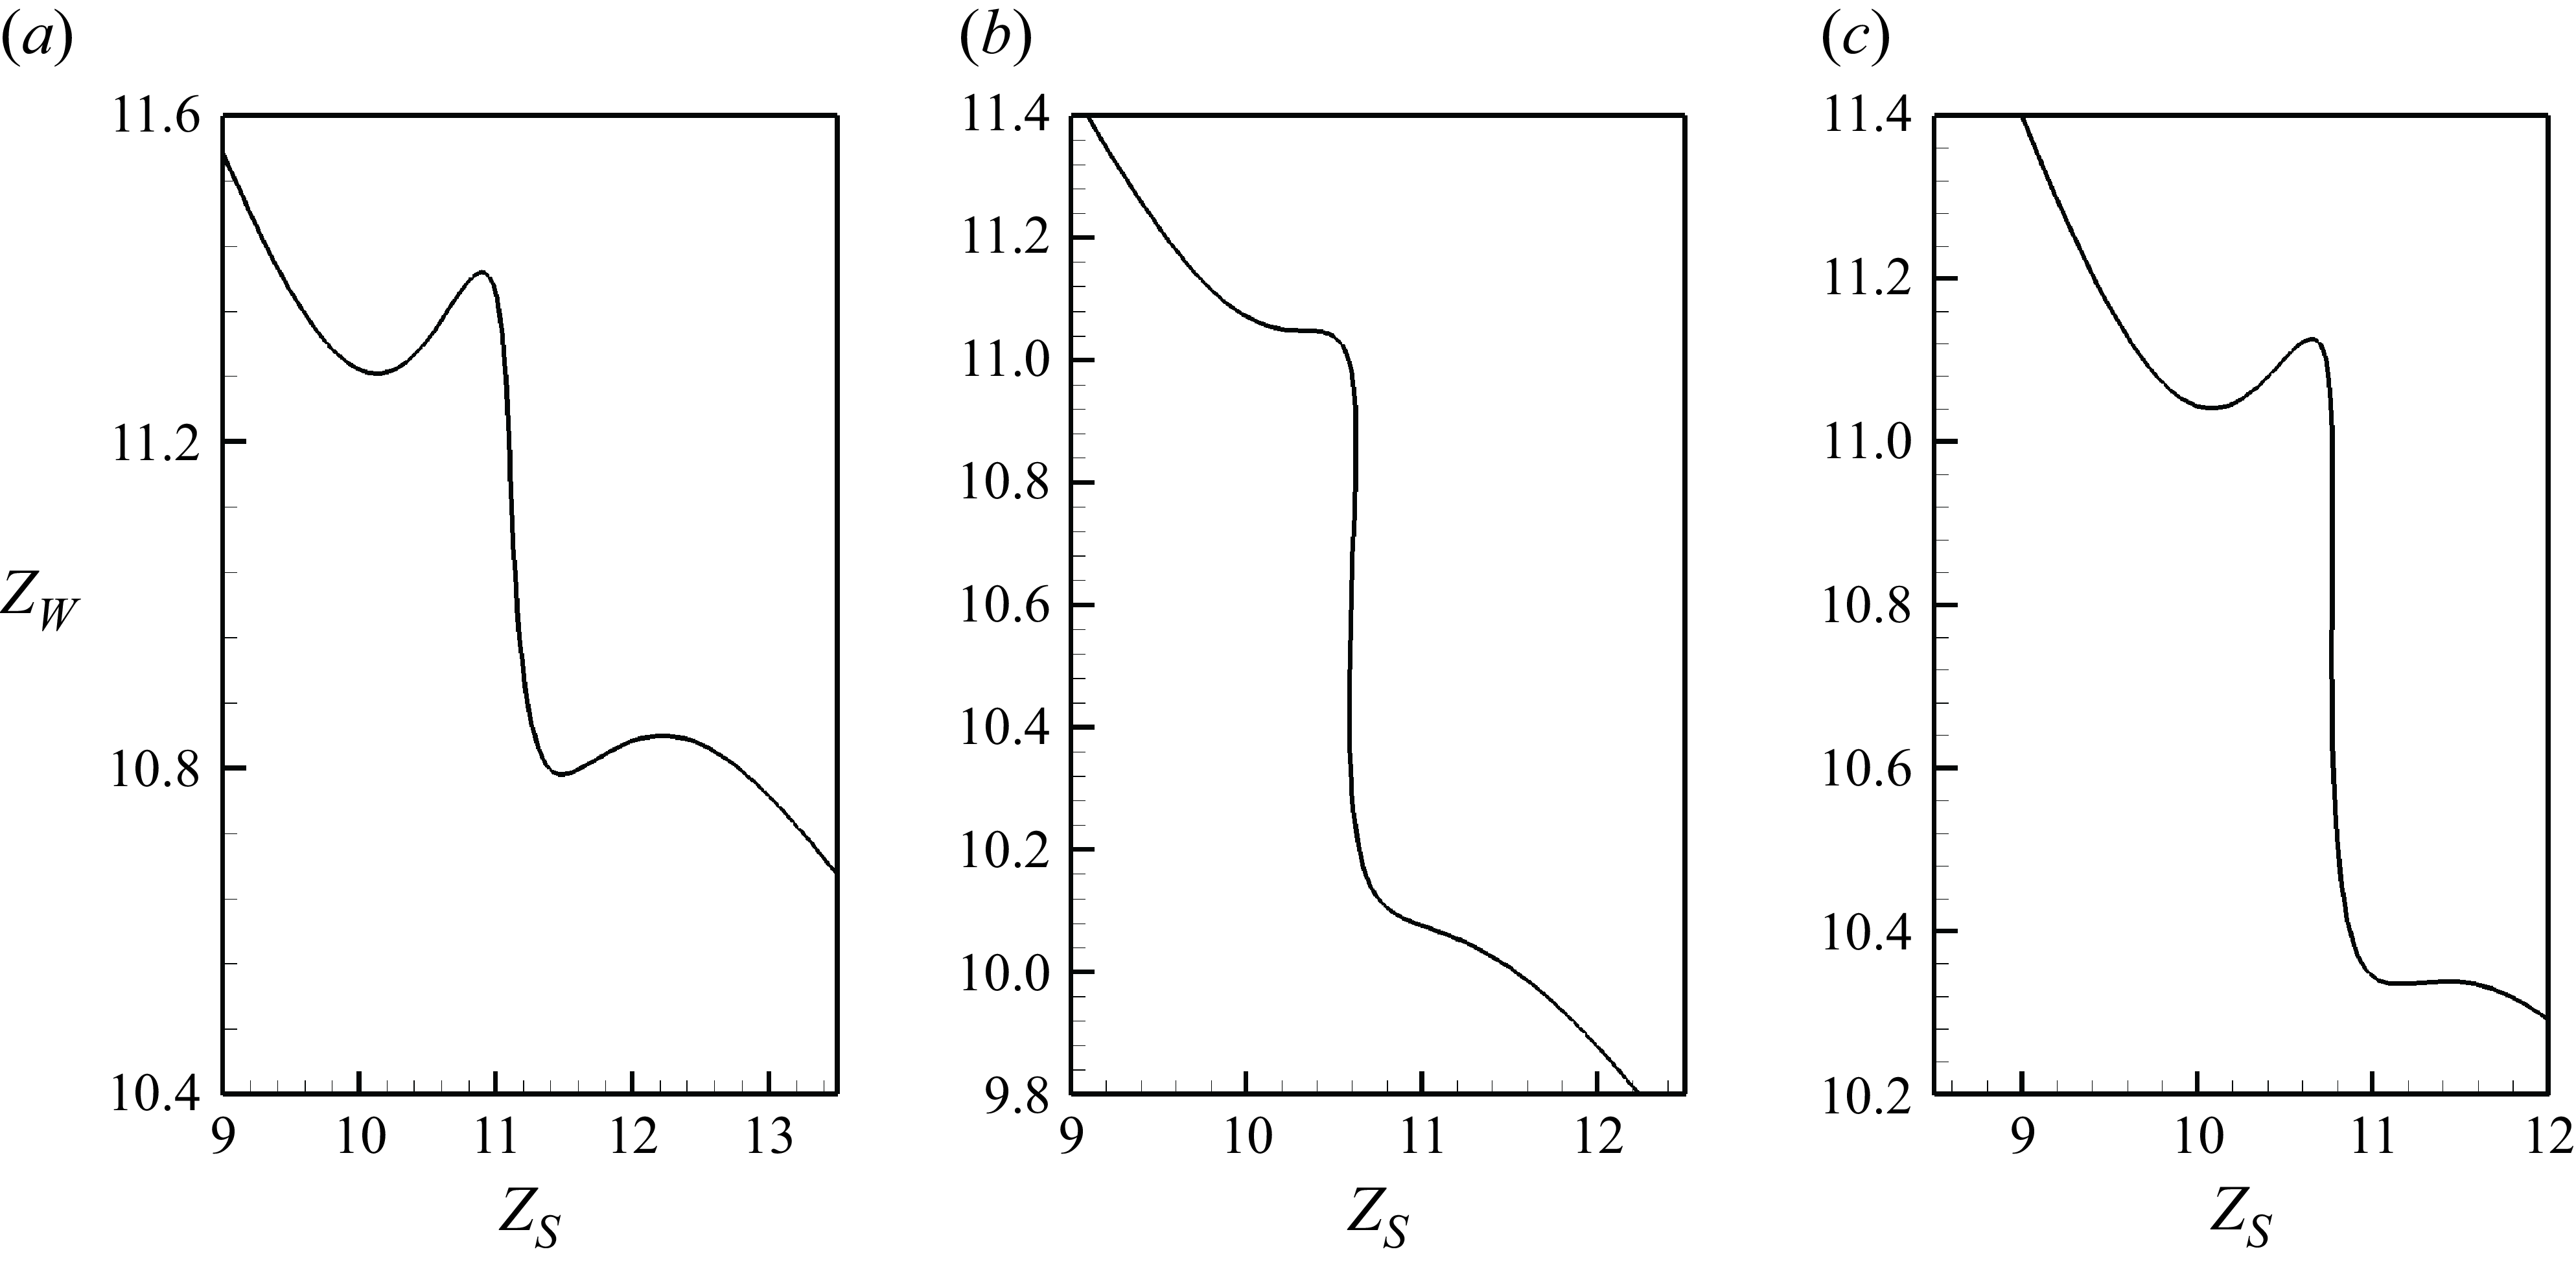
of two vortex rings in the category Patterns I, II and III. For the sake of visual clarity, only one representative case is presented for each pattern. For the cases in Pattern I, it is observed that the trajectories of the weaker rings
 $Z_W$
have one local minimum and one local maximum within the axial position range of
 $11.0 \leqslant Z_W \leqslant 11.6$
before the steep drops, as shown in figure 6(a). One local minimum and one local maximum have also been observed after the steep drops for the two representative cases with initial circulation ratios
 $\gamma =0.30, 0.35$
, which indicate the weaker rings undergo two episodes of reverse motion. For the cases in Pattern II, it is observed that the trajectories of the stronger rings
 $Z_S$
have one local maximum and one local minimum within the axial position range of
 $10.4 \leqslant Z_S \leqslant 10.7$
, as shown in figure 6(b). This indicates that the stronger rings undergo a single episode of reverse motion during the steep drops of the trajectories of the weaker rings. For the cases in Pattern III, the trajectories of the weaker rings
 $Z_W$
have one local minimum and one local maximum within the axial position range of
 $10.8 \leqslant Z_W \leqslant 11.2$
before the steep drops and the trajectories of the stronger rings
 $Z_S$
also have one local maximum and one local minimum within the axial position range of
 $10.4 \leqslant Z_S \leqslant 10.8$
, as shown in figure 6(c), which indicate that both the stronger and weaker rings undergo reverse motion during the interactions.
The axial positions
 $Z_S,Z_W$
of two vortex rings in a representative case for (a) Pattern I
 $(\gamma =0.30, \eta =0.60)$
, (b) Pattern II
 $(\gamma =0.45, \eta =0.75)$
and (c) Pattern III
 $(\gamma =0.40, \eta =0.60)$
.

The interaction of the two vortex rings at (a)
 $t=0$
, (b)
 $t=10.60$
, (c)
 $t=13.00$
, (d)
 $t=14.80$
, (e)
 $t=16.80$
and (f)
 $t=19.40$
for the case
 $\gamma =0.30, \eta =0.60$
in Pattern I. The arrows along the curves indicate the direction of streamlines. The thick and thin arrows indicate the direction of vortex ring travel and the mutual induced velocity, respectively. Arrow lengths are not indicative of velocity magnitude.

Detailed analyses of four cases are presented to illustrate the vortex ring dynamics in their corresponding patterns in figures 7–10. Figure 7 shows the interaction of two vortex rings with initial circulation ratio
 $\gamma =0.30$
and radius ratio
 $\eta =0.60$
in Pattern I. In the initial instant
 $t=0$
, vortex cores remain circular. The stronger ring moves towards the positive
 $z$
direction and the weaker ring moves towards the negative
 $z$
direction. They approach each other. At
 $t=10.60$
, they both move towards the positive
 $z$
direction and the weaker ring stretches radially, as shown in figure 7(b). It illustrates that the weaker ring reverses its direction, which is consistent with the initial decrease and subsequent increase of the axial position
 $Z_W$
before the steep drops observed in figure 6(a). Then the core of the weaker ring revolves around the core of the stronger ring and moves towards the negative
 $z$
direction, as shown in figure 7(c). The stronger ring still moves towards the positive
 $z$
direction. At this instant, the weaker ring induces the axial velocity on the stronger ring in the negative
 $z$
direction, which is contrary to the travelling direction of the stronger ring. At
 $t=14.80$
, the two vortex rings are coplanar, as shown in figure 7(d). The weaker ring is located above the stronger ring and moves towards the negative
 $z$
direction. The induced axial velocity from the weaker ring is completely contrary to the travelling direction. After passing through the weaker ring, the stronger ring continues to move towards the positive
 $z$
direction. The weaker ring moves towards the negative
 $r$
direction under the induction of the stronger vortex ring, as shown in figure 7(e,f). The travelling towards the positive
 $z$
direction of the weaker ring is also observed in figure 7(f), which is consistent with the initial decrease and subsequent increase of the axial position
 $Z_W$
after the steep drops observed in figure 6(a).
Figure 8 shows the interaction of two vortex rings with initial circulation ratio
 $\gamma =0.50$
and radius ratio
 $\eta =1.00$
in Pattern II. After approaching each other, two vortex rings maintain their travelling directions and stretch radially, as shown in figure 8(a,b). Then they both move towards the negative
 $z$
direction, as shown in figure 8(c). It illustrates that the stronger ring reverses its direction, consistent with the initial increase and subsequent decrease of the axial position
 $Z_S$
observed in figure 6(b). When the two vortex rings are coplanar as shown in figure 8(d), they both move towards the negative
 $z$
direction. The axial velocity induced by each other is also directed towards the negative
 $z$
direction. Subsequently, the stronger ring passes through the weaker ring and the stronger ring moves towards the positive
 $z$
direction again. The two vortex rings then gradually move away from each other, as shown in figure 8(e,f).
The interaction of the two vortex rings at (a)
 $t=0$
, (b)
 $t=9.80$
, (c)
 $t=11.80$
, (d)
 $t=14.20$
, (e)
 $t=16.60$
and (f)
 $t=19.80$
for the case
 $\gamma =0.50, \eta =1.00$
in Pattern II. The arrows along the curves indicate the direction of streamlines. The thick and thin arrows indicate the direction of vortex ring travel and the mutual induced velocity, respectively. Arrow lengths are not indicative of velocity magnitude.

The interaction of the two vortex rings at (a)
 $t=0$
, (b)
 $t=9.60$
, (c)
 $t=11.60$
, (d)
 $t=13.40$
, (e)
 $t=15.80$
and (f)
 $t=19.00$
for the case
 $\gamma =0.50, \eta =0.60$
in Pattern III. The arrows along the curves indicate the direction of streamlines. The thick and thin arrows indicate the direction of vortex ring travel and the mutual induced velocity, respectively. Arrow lengths are not indicative of velocity magnitude.

The interaction of the two vortex rings at (a)
 $t=0$
, (b)
 $t=8.00$
, (c)
 $t=10.60$
, (d)
 $t=16.60$
, (e)
 $t=22.80$
and (f)
 $t=25.00$
for the case
 $\gamma =0.40, \eta =2.20$
in Pattern IV. The arrows along the curves indicate the direction of streamlines. The thick and thin arrows indicate the direction of vortex ring travel and the mutual induced velocity, respectively. Arrow lengths are not indicative of velocity magnitude.

Figure 9 shows the interaction of two vortex rings with initial circulation ratio
 $\gamma =0.50$
and radius ratio
 $\eta =0.60$
in Pattern III. After approaching each other, the two vortex rings stretch radially and the weaker ring moves towards the positive
 $z$
direction, as shown in figure 9(a,b). The reverse motion of the weaker ring corresponds to the initial decrease and subsequent increase of the axial position
 $Z_W$
observed in figure 6(c). Then the weaker ring rotates around the stronger ring and the two vortex rings both move towards the negative
 $z$
direction. It illustrates that the stronger ring reverses its direction, consistent with the initial increase and subsequent decrease of the axial position
 $Z_S$
observed in figure 6(c). When the two vortex rings are coplanar as shown in figure 9(d), they both move towards the negative
 $z$
direction. The axial velocity induced by each other is also directed towards the negative
 $z$
direction. The subsequent motion shown in figure 9(e,f) resembles the dynamics observed in figure 8(e,f) in Pattern II.
Figure 10 shows the interaction of two vortex rings with initial circulation ratio
 $\gamma =0.40$
and radius ratio
 $\eta =2.20$
in Pattern IV. The stronger ring passes through the weaker ring without reversing its direction. The weaker ring moves towards the negative
 $z$
direction for a relatively short distance. The acceleration and deceleration of the vortex rings still occur, although they are not readily apparent in the contour plots, as shown in figure 10. The velocity evolution of the vortex rings is quantitatively analysed in § 4.5.
4.2. Sound source in viscous vortical flows
The sound source generated by the coaxial head-on collision of two vortex rings is the third-order time derivative of the second moment of vorticity in (2.2b
). A specific example for two vortex rings with initial configuration
 $\gamma =0.50, \eta =1.00$
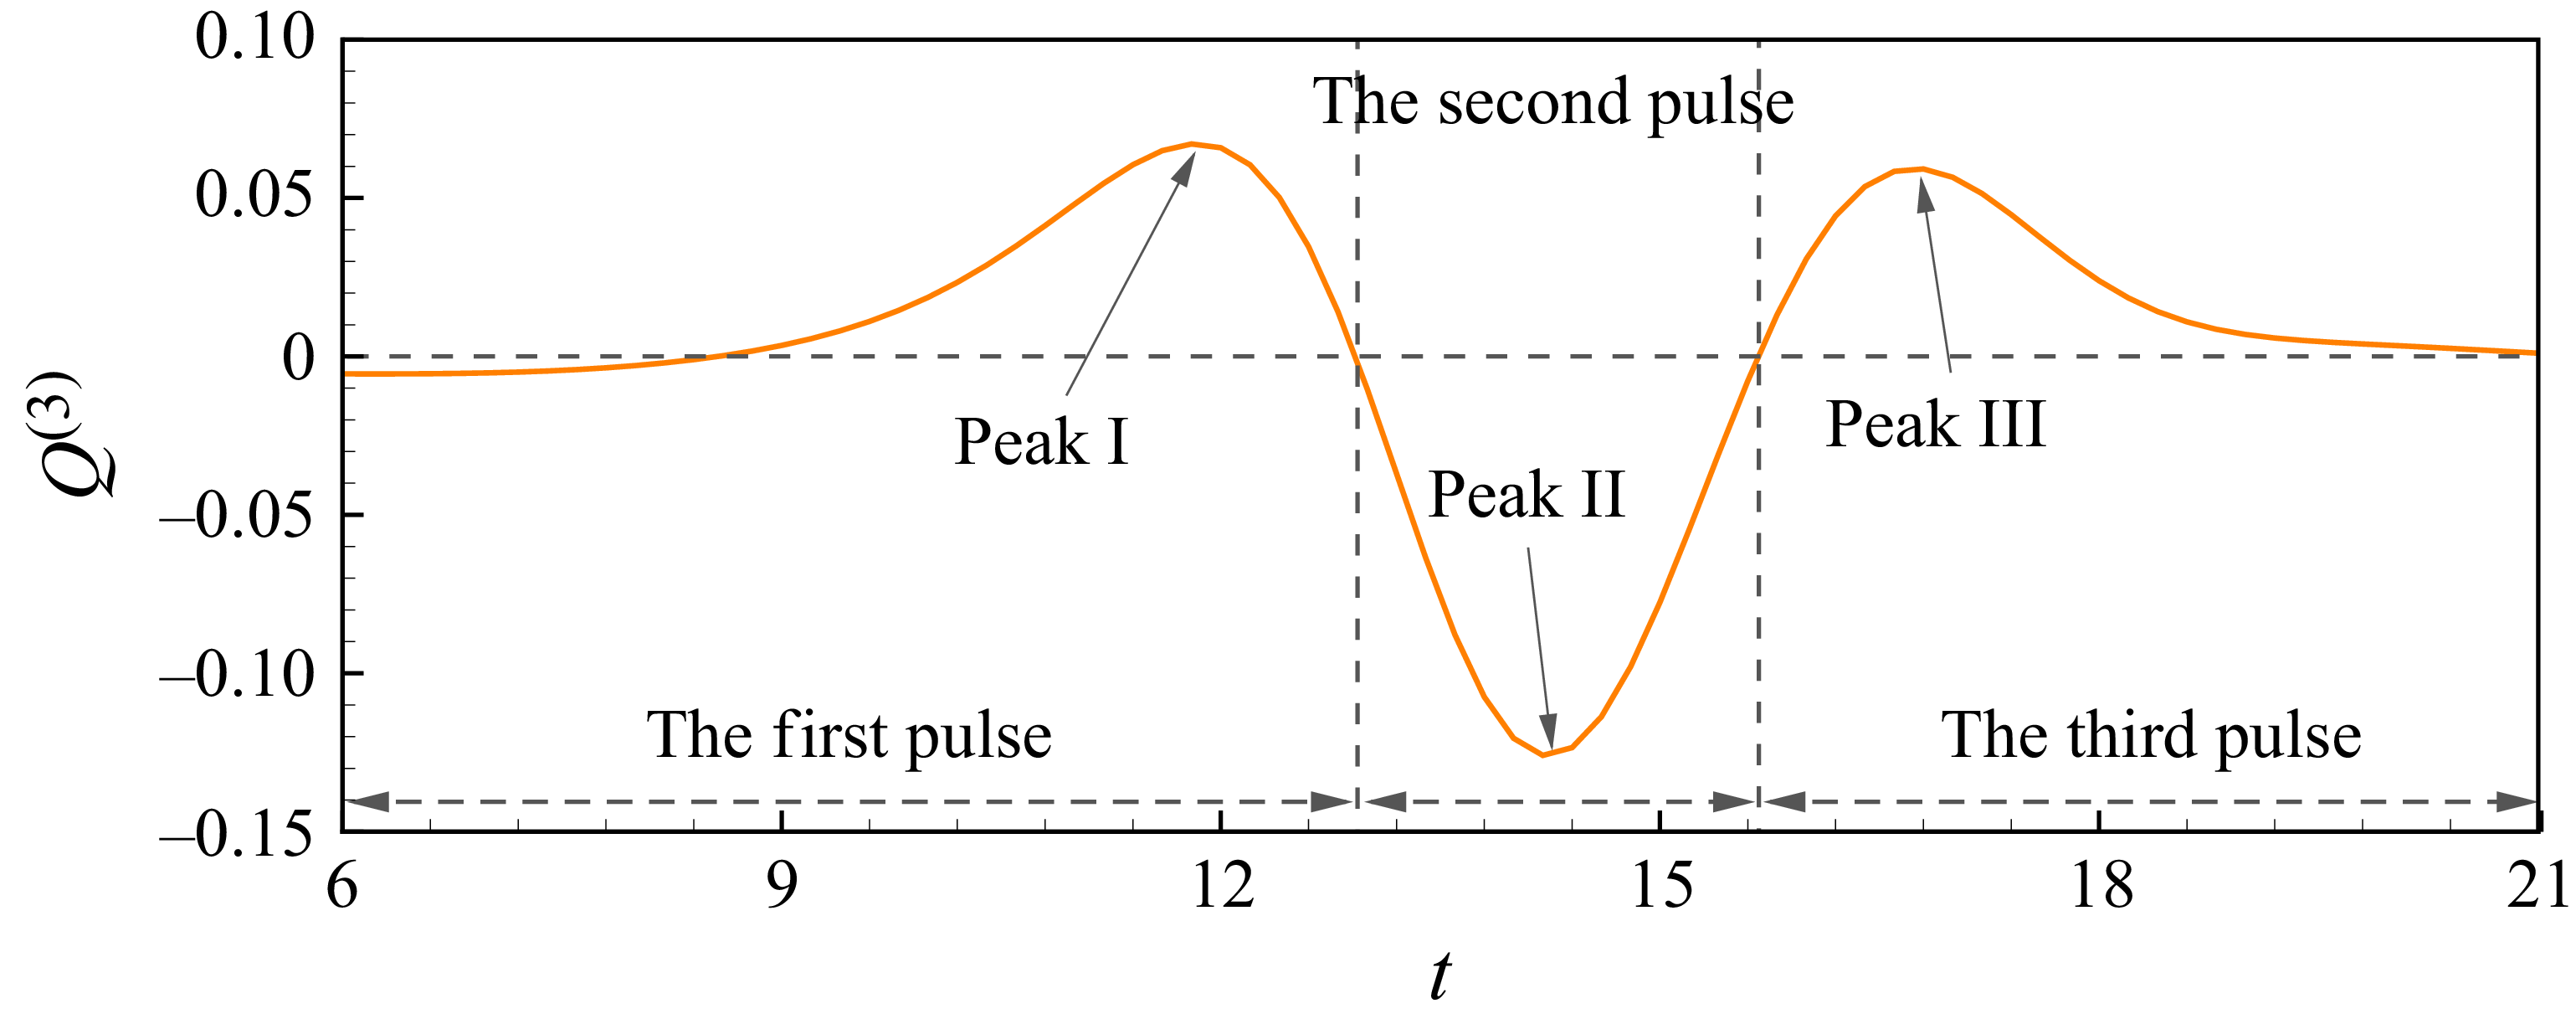
is reported in detail to illustrate the variation of the sound source, as shown in figure 11. The fluctuation of
 $Q^{(3)}$
has two positive peaks and one negative peak, which are consistent with the results of Tang & Ko (Reference Tang and Ko1995b
) and Inoue et al. (Reference Inoue, Hattori and Sasaki2000). The first and third pulses reach positive peak I
 $Q^{(3)}=0.067$
and peak III
 $Q^{(3)}=0.059$
, respectively. The second pulse reaches a negative peak of
 $Q^{(3)}=-0.13$
at
 $t=14.20$
. The ratio between the three peaks is
 $0.52:1:0.45$
. The negative peak in the second pulse is the strongest fluctuation of the source during the coaxial head-on collision of the two vortex rings. The strongest peak occurs at the instant when the two vortex rings are coplanar, as shown in figure 8(d).
The details of the fluctuation of the sound source for
 $\gamma =0.50$
and
 $\eta =1.00$
.

(a) The effect of the initial radius ratio
 $\eta$
for a fixed initial circulation ratio
 $\gamma$
and (b) the variation of negative peaks with the initial radius ratios. (c) The effect of the initial circulation ratio
 $\gamma$
for a fixed initial radius ratio
 $\eta$
on sound sources and (d) the variation of negative peaks with the initial circulation ratios. (e) The variation of the absolute values of negative peaks with all initial configurations investigated in our work.

Figure 12 shows the effect of the initial configurations on the sound source. The sound sources generated by two vortex rings with representative initial radius ratios and a fixed initial circulation ratio
 $\gamma =0.35$
are shown in figure 12(a). The cases for two vortex rings with other initial vortex ring circulation ratios
 $\gamma$
are reported in Appendix B. The temporal evolutions of sound sources for all cases investigated in this work have similar patterns. The sound source for representative cases can illustrate the dependence of the sound source on the initial radius ratio. Different initial vortex ring radius ratios primarily lead to variations in the amplitude and phase of the fluctuation of sound source
 $Q^{(3)}$
. As the initial vortex ring radius ratio
 $\eta$
increases, the amplitudes of the three pulses decrease. Figure 12(b) shows the variation of the absolute values of the negative peaks with initial vortex ring radius ratios
 $\eta$
. The coordinate axes are scaled in logarithmic form. The absolute peak values
 $|Q_{\textit{peaks}}^{(3)}|$
are negatively correlated with the initial radius ratios
 $\eta$
. The instants
 $t_{\textit{peaks}}$
when the second pulses reach minimum are delayed as the initial vortex ring radius ratio
 $\eta$
grows. The deviation of the negative peak instants represents the time taken for the two vortex rings to move forward in the axial direction from the initial configuration to the coplanar state. It is primarily determined by their self- and mutual-induced velocity in the axial direction. The effect of the initial vortex ring circulation ratio
 $\gamma$
on the sound source is shown in figure 12(c). As the initial vortex ring circulation ratio
 $\gamma$
increases, the amplitudes of the three pulses also increase. Figure 12(d) shows the variation of the absolute values of the negative peaks with initial vortex ring circulation ratios
 $\gamma$
. The absolute peak values
 $|Q_{\textit{peaks}}^{(3)}|$
are positively correlated with
 $\gamma$
. Figure 12(e) shows the variation of the absolute values of the negative peaks with all initial configurations investigated in our work. A positive correlation with the initial circulation ratios and a negative correlation with the initial radius ratios are observed for the negative peaks of the sound source across the entire investigated range.
4.3. The decomposition of the sound source
Equation (2.2) shows that the far-field sound pressure generated by the interactions of vortex rings is related to the evolution of vorticity in the inner source region. The head-on collision of two vortex rings features both axial translation and radial stretching, along with reverse motions. These motions can be characterised by the kinematics of vortex centroids (Saffman Reference Saffman1970). The vorticity centroid in the
 $z$
direction of the stronger ring
 $Z_S$
and weaker ring
 $Z_W$
can be defined as follows according to the work of Inoue et al. (Reference Inoue, Hattori and Sasaki2000):
 \begin{align} {Z_S} = \frac { \int _{\varOmega ,\omega _\phi \gt 0}{\omega _\phi {r^2}z}\,{\rm d}s}{\int _{\varOmega ,\omega _\phi \gt 0}{{\omega _\phi }}{r^2}\, {\rm d}s}, \quad {Z_W} = \frac { \int _{\varOmega ,\omega _\phi \lt 0}{\omega _\phi {r^2}z}\,{\rm d}s}{\int _{\varOmega ,\omega _\phi \lt 0}{{\omega _\phi }}{r^2}\, {\rm d}s} . \end{align}
Here
 $\varOmega ,\omega _{\phi }\gt 0$
and
 $\varOmega ,\omega _{\phi }\lt 0$
represent integration over the region where
 $\omega _{\phi }$
is greater than zero and smaller than zero, respectively. The vorticity centroid of the stronger ring and weaker ring in the
 $r$
direction can be written as
 \begin{align} {R_S^2} = \frac { \int _{\varOmega ,\omega _\phi \gt 0}{ r^2 {\omega _\phi }}\,{\rm d}s}{\int _{\varOmega ,\omega _\phi \gt 0}{{\omega _\phi }} \,{\rm d}s}, \quad {R_W^2} = \frac { \int _{\varOmega ,\omega _\phi \lt 0}{ r^2 {\omega _\phi }}\,{\rm d}s}{\int _{\varOmega ,\omega _\phi \lt 0}{{\omega _\phi }} \,{\rm d}s} . \end{align}
The circulation of the stronger ring and weaker ring in this meridional plane can be written as
 \begin{align} {\varGamma _S} = \int _{\varOmega ,\omega _\phi \gt 0}{{\omega _\phi }}\, {\rm d}s, \quad {\varGamma _W} = \int _{\varOmega ,\omega _\phi \lt 0}{{\omega _\phi }}{\rm d}s . \end{align}
It is worth noting that the numerator of (4.1) corresponds to the form of the sound source, while the denominator is identical to the numerator of (4.2). The sound source in the form of integral formulation (2.2b ) can be rewritten as the product of the circulation and vorticity centroid of each vortex ring (Tang & Ko Reference Tang and Ko1995b ; Zang et al. Reference Zang, Zhou, Liu and Wang2025):
 \begin{align} Q(t) = \varGamma _S R_S^2 Z_S + \varGamma _W R_W^2 Z_W . \end{align}
According to (2.2a
), the sound generated by coaxial vortex ring pairs is directly proportional to the third-order time derivative of
 $Q$
. Therefore, the radiated sound pressure can be expanded as
 \begin{align} \begin{split} p \propto Q^{(3)}(t) &= \underbrace {6 \sum _{i} \varGamma _{i} R_{i} {R}_{i}^{(1)} {Z}_{i}^{(2)}}_{T_1} + \underbrace {6 \sum _{i} \varGamma _{i} ({R}_{i}^{(1)})^2 {Z}_{i}^{(1)}}_{T_2} + \underbrace {6 \sum _{i} \varGamma _{i} R_{i} {R}_{i}^{(2)} {Z}_{i}^{(1)}}_{T_3} \\& \quad + \underbrace {6 \sum _{i} \varGamma _{i} {R}_{i}^{(1)} {R}_{i}^{(2)} Z_{i}}_{T_4} + \underbrace {\sum _{i} \varGamma _{i} R_{i}^{2} {Z}_{i}^{(3)}}_{T_5} + \underbrace {2 \sum _{i} \varGamma _{i} R_{i} {R}_{i}^{(3)} Z_{i}}_{T_6} \\& \quad + \underbrace {f(\varGamma _i^{(k)},Z_i^{(m)},R_i^{(s)})}_{T_{{td}}}. \end{split} \end{align}
Here
 $T_1$
is the term dominated by the radial velocity and axial acceleration of the vorticity centroids,
 $T_2$
is the term dominated by the radial and axial velocity of the vorticity centroids,
 $T_3$
is the term dominated by the radial acceleration and axial velocity of the vorticity centroids,
 $T_4$
is the term dominated by the radial velocity and acceleration of the vorticity centroids and
 $T_5$
and
 $T_6$
are the terms dominated by the axial and radial jerk of the vorticity centroids, respectively. Term
 $T_{{td}}$
is that related to the time derivatives of the circulations of vortex rings
 $\varGamma _i^{(k)}$
, which can be written as the product of
 $\varGamma _i^{(k)}$
and
 $Z_i^{(m)},R_i^{(s)}$
. The superscripts
 $k,m,s$
, with values
 $k=1,2,3,m,s=0,1,2,3$
, are the order of the time derivatives of the circulations and the vortex centroids, respectively. This term reflects the influence of circulation decay induced by viscous diffusion on the sound source. A limitation must be acknowledged that the present numerical method precludes the assessment of the effect of azimuthal waves on the sound source. More details of
 $T_{{td}}$
are reported in Appendix C. Equation (4.5) relates the vorticity centroid dynamics to the far-field sound pressure.
The validation of the decomposition is conducted by four typical initial configurations, as shown in figure 13. These four initial configurations are the same as these representing the four typical Patterns I–IV in § 4.1 and the subsequent analysis of the sound sources will also be based on these four cases. The result of
 $f(\varGamma )$
is the sum from
 $T_1$
to
 $T_6$
, and the results of
 $f(\varGamma ^{(1)}), f(\varGamma ^{(2)}), f(\varGamma ^{(3)})$
which are related to the time derivatives of the circulation are all contained in
 $T_{{td}}$
. The expressions of
 $f(\varGamma ^{(1)}), f(\varGamma ^{(2)}), f(\varGamma ^{(3)})$
are available in Appendix C. The term related to the zeroth-order time derivatives of the circulations of vortex rings
 $f(\varGamma )$
shows good agreement with the sound source
 $Q^{(3)}$
. When the circulations of two vortex rings decrease during the interaction, the fluctuations of
 $f(\varGamma )$
are synchronised with those of
 $Q^{(3)}$
and exhibit nearly identical amplitudes. The terms related to the zeroth-order time derivatives of the circulations of vortex rings
 $f(\varGamma )$
are dominant in the sound generated by the coaxial collision of two vortex rings. The terms related to the time derivatives of the circulations of vortex rings
 $\varGamma _i^{(k)}$
are nearly zero throughout the entire process. The decomposition presented in (4.5) is reasonable and the time derivative of circulation is found to have a negligible contribution to sound generation in all the cases investigated in this work.
The validation of the decomposition and the test conducted on the time derivative of circulation for (a)
 $\gamma =0.30, \eta =0.60$
, (b)
 $\gamma =0.50, \eta =1.00$
, (c)
 $\gamma =0.50, \eta =0.60$
and (d)
 $\gamma =0.4, \eta =2.2$
.

Figure 14 shows the decomposition of the sound source
 $Q^{(3)}$
for cases with these four initial configurations. Among all six components
 $T_1$
–
 $T_6$
related to the zeroth-order time derivatives of the circulation in (4.5), the third component associated with the radial acceleration and axial velocity of the vortex rings
 $T_3=6 \sum _{i} \varGamma _{i} R_{i} {R}_{i}^{(2)} {Z}_{i}^{(1)}$
exhibits the dominant fluctuation of the sound sources generated by these four typical motion patterns, especially in the second pulse. The other five terms cancel each other out in the second pulse. The magnitudes of pulses of the first two terms
 $T_1, T_2$
are negligible compared with the others. Therefore,
 $T_1, T_2$
are not presented in figure 14. The negative peaks of
 $T_3$
are almost synchronised with that of
 $Q^{(3)}$
in the cases investigated in this work. Component
 $T_3$
contributes more than
 $92\,\%$
to the peaks of the second pulses. Component
 $T_3$
is the dominant contributor of the negative peak in sound generated by the coaxial collision of two vortex rings.
The decomposition of the third-order time derivative of
 $Q$
for (a)
 $\gamma =0.30, \eta =0.60$
, (b)
 $\gamma =0.50, \eta =1.00$
, (c)
 $\gamma =0.50, \eta =0.60$
and (d)
 $\gamma =0.4, \eta =2.2$
. For the sake of clarity, the first two terms
 $T_1, T_2$
are not presented due to their significantly smaller magnitudes.

4.4. The contribution to the source from the stronger/weaker ring
The contributions to
 $Q^{(3)}$
from the stronger ring
 $T_{3S}$
and the weaker ring
 $T_{3W}$
for (a)
 $\gamma =0.30, \eta =0.60$
, (b)
 $\gamma =0.50, \eta =1.00$
, (c)
 $\gamma =0.50, \eta =0.60$
and (d)
 $\gamma =0.4, \eta =2.2$
.

Term
 $T_3$
is composed of two components: that related to the vortex dynamics of the stronger ring
 $T_{3S}=\varGamma _{S} R_{S} {R}_{S}^{(2)} {Z}_{S}^{(1)}$
and that related to the vortex dynamics of the weaker ring
 $T_{3W}=\varGamma _{W} R_{W} {R}_{W}^{(2)} {Z}_{W}^{(1)}$
. Figure 15 shows the contributions to the second pulses of
 $Q^{(3)}$
from
 $T_{3S}$
and
 $T_{3W}$
. The fluctuations of
 $T_{3S}$
have three pulses while
 $T_{3W}$
mainly exhibits large negative peaks around the coplanar configuration. Figure 15(a) shows the time evaluation of the sound source
 $Q^{(3)}$
and the terms
 $T_{3S}$
and
 $T_{3W}$
for the case with initial configuration
 $\gamma =0.30, \eta =0.60$
in Pattern I. The second pulse of
 $Q^{(3)}$
reaches the minimum value
 $-0.13$
and that of
 $T_{3W}$
also reaches the minimum value
 $-0.098$
around the coplanar configuration. The amplitude of
 $T_{3S}$
is much smaller than that of
 $Q^{(3)}$
and
 $T_{3W}$
. The term related to the vortex dynamics of the weaker ring
 $T_{3W}$
dominates the second pulse of the sound source
 $Q^{(3)}$
. Figure 15(b) shows the time evaluation of
 $Q^{(3)}$
and
 $T_{3S}$
,
 $T_{3W}$
for the case with initial configuration
 $\gamma =0.50, \eta =1.00$
in Pattern II. The second pulse of sound source
 $Q^{(3)}$
exhibits a negative peak around the coplanar configuration. Component
 $T_{3W}$
has a negative peak while
 $T_{3S}$
has a positive peak during the second pulse of
 $Q^{(3)}$
. Terms
 $Q^{(3)}$
,
 $T_{3S}$
and
 $T_{3W}$
simultaneously reach the extrema with values of −0.13, 0.024 and −0.14, respectively. The second pulse of
 $T_{3W}$
dominates the sound fluctuation in the second pulse and the positive peak of
 $T_{3S}$
reduces the the sound fluctuation in the second pulse. Figure 15(c) shows the time evaluation of
 $Q^{(3)}$
and
 $T_{3S}$
,
 $T_{3W}$
for the case with initial configuration
 $\gamma =0.50, \eta =0.60$
in Pattern III. The sound source
 $Q^{(3)}$
exhibits a negative peak around the coplanar configuration with a value
 $-0.16$
. Term
 $T_{3W}$
has a negative peak with a value of −0.23 while
 $T_{3S}$
exhibits a positive peak with a value of 0.063 during the second pulse of
 $Q^{(3)}$
. The contributions to sound fluctuation from
 $T_{3S}$
and
 $T_{3W}$
are same as those in the case
 $\gamma =0.50, \eta =1.00$
. A greater portion of the strong negative peak produced by the term related to the vortex dynamics of the weaker ring
 $T_{3W}$
is neutralised by the contribution from the term related to the vortex dynamics of the stronger ring
 $T_{3S}$
. Figure 15(d) shows the time evaluation of
 $Q^{(3)}$
and
 $T_{3S}$
,
 $T_{3W}$
for the case with initial configuration
 $\gamma =0.40, \eta =2.20$
in Pattern IV. Terms
 $Q^{(3)}$
,
 $T_{3S}$
and
 $T_{3W}$
all have negative peaks at the coplanar configuration with values of
 $-8.85\times 10^{-3}$
,
 $-5.63\times 10^{-3}$
and
 $-3.51\times 10^{-3}$
, respectively. Unlike the other three cases,
 $T_{3R}$
, the term related to the stronger ring, contributes
 $64\,\%$
to the peak in the second pulse.
The sound generated by the coaxial collision of two vortex rings in the first three typical vortex interaction patterns is mainly contributed by the vortex dynamics of the weaker ring. The results are consistent with those obtained by Tang & Ko (Reference Tang and Ko1995a
). However, for the case with a large initial radius ratio
 $\eta$
and a small initial circulation ratio
 $\gamma$
in the fourth vortex interaction pattern, a relatively mild interaction between vortex rings occurs, producing no reverse motion and a significantly lower sound source, in which the dominance of the weaker ring in generating the sound source does not occur. This new phenomenon has not been reported in previous work.
The evaluation of the contributions from the stronger and weaker vortex rings is extended across the parameter space presented in table 1. Figure 16 shows the contour of the natural logarithm of ratios between the peak values of the source term related to the radial acceleration and axial velocity of the weaker ring
 $T_{3W}$
in the negative pulse and that related to the stronger ring
 $T_{3S}$
in the second pulse:
 \begin{align} \varepsilon =\mathrm{ln} |T_{3W,p}/ T_{3S,p}| . \end{align}
The classification boundary of the contribution to the sound source from the stronger and weaker rings is also plotted in figure 16. The critical initial vortex ring radius ratio
 $\eta _s$
which separates whether the stronger or weaker vortex ring contributes more to the sound source fluctuations is proportional to the initial circulation ratio
 $\gamma$
. The phenomenon that the weaker ring plays a more dominant role in the sound source is valid only in a local region, which is below the critical threshold
 $\eta _s$
and labelled by
 in figure 16. The sources related to the stronger ring
 $T_{3S}$
make greater contributions to the sound sources in the cases above the critical threshold
 $\eta _s$
, as labelled by
 in figure 16.
The evaluation of the contributions from the two vortex rings. represent the cases of the weaker ring contributing more to the generated sound and represent the cases of the stronger ring contributing more to the generated sound. The background is shaded with the natural logarithm of ratios between peaks of the terms related to the weaker ring and stronger ring
 ${\mathrm{ln}}|T_{3W,p}/ T_{3S,p}|$
. The fitting equation of the critical initial radius ratio
 $\eta _{s}$
is also provided in this figure.

Figure 17 shows the peak values of the dominant source related to the weaker ring
 $T_{3W}$
and the stronger ring
 $T_{3S}$
for all cases investigated in our work. The peak values of
 $T_{3S}$
are negative for cases with initial vortex ring circulation ratio
 $\gamma \leqslant 0.35$
and the absolute values of peaks decrease as the initial vortex ring radius ratio
 $\eta$
increases. The positive values of the peaks of
 $T_{3S}$
are observed for cases with initial vortex ring circulation ratio
 $\gamma \geqslant 0.40$
. For these cases, the peak value of
 $T_{3S}$
gradually decays, undergoes a zero-crossing and shifts from positive to negative. It is noted that for the cases with large initial radial ratios, such as
 $\eta \gt 1.5$
, the absolute values of peaks are also significantly low. When the initial radius ratios are
 $\eta =0.75, 1.10, 1.35$
, for initial circulation ratios
 $\gamma =0.40, 0.45, 0.50$
, respectively, the peaks of
 $T_{3S}$
vanish, as marked in figure 17(a). It is worth noting that the cases generating the positive peaks of
 $T_{3S}$
are identical to the cases with reverse motion of the stronger ring in Patterns II and III. It suggests that the reverse motion generates the positive fluctuation of the sound source. Figure 17(b) shows that the magnitudes of peaks of
 $T_{3W}$
decrease as initial radius ratios increase and are also significantly low for the cases with large initial radial ratios
 $\eta \gt 1.5$
. The reverse motion of the weaker ring occurring before and after the coplanar configuration has no influence on the negative pulse of
 $T_{3W}$
around the coplanar configuration.
Figure 17(c) shows the natural logarithm of ratios between the peak values of
 $T_{3W}$
and
 $T_{3S}$
in the form of a line chart. The ratio for cases with initial vortex ring circulation ratio
 $\gamma \leqslant 0.35$
decreases monotonically. It suggests that the contribution of the stronger ring becomes increasingly dominant. For cases with initial vortex ring circulation ratio
 $\gamma \geqslant 0.40$
, the ratios exhibit pronounced peaks in the variation with the initial radius ratio. Maxima of the ratios are observed at
 $\eta =0.75, 1.10, 1.35$
, where three spots are also observed in figure 16. The three spots are due to the vanishing of the positive peaks of
 $T_{3S}$
, as shown in figure 17(a). For cases with
 $\eta \geqslant \eta _s$
, the ratios
 $\varepsilon$
are negative. The amplitude of the source related to the stronger ring exceeds that of the source related to the weaker ring.
The peaks of the source related to (a) the stronger ring
 $T_{3S}$
in the second pulse, (b) the weaker ring
 $T_{3WL}$
in the negative pulse and (c) the natural logarithm of the ratios between the peak values.

4.5. The effect of vorticity centroid dynamics on the sound source
The trends of ratios
 $\varepsilon$
between the peak values of
 $T_{3W}$
and
 $T_{3S}$
are governed by the axial velocity and radial acceleration of vorticity centroids. This section focuses on the dynamics of vortex rings to reveal the effect of vorticity centroid dynamics on the sound source.
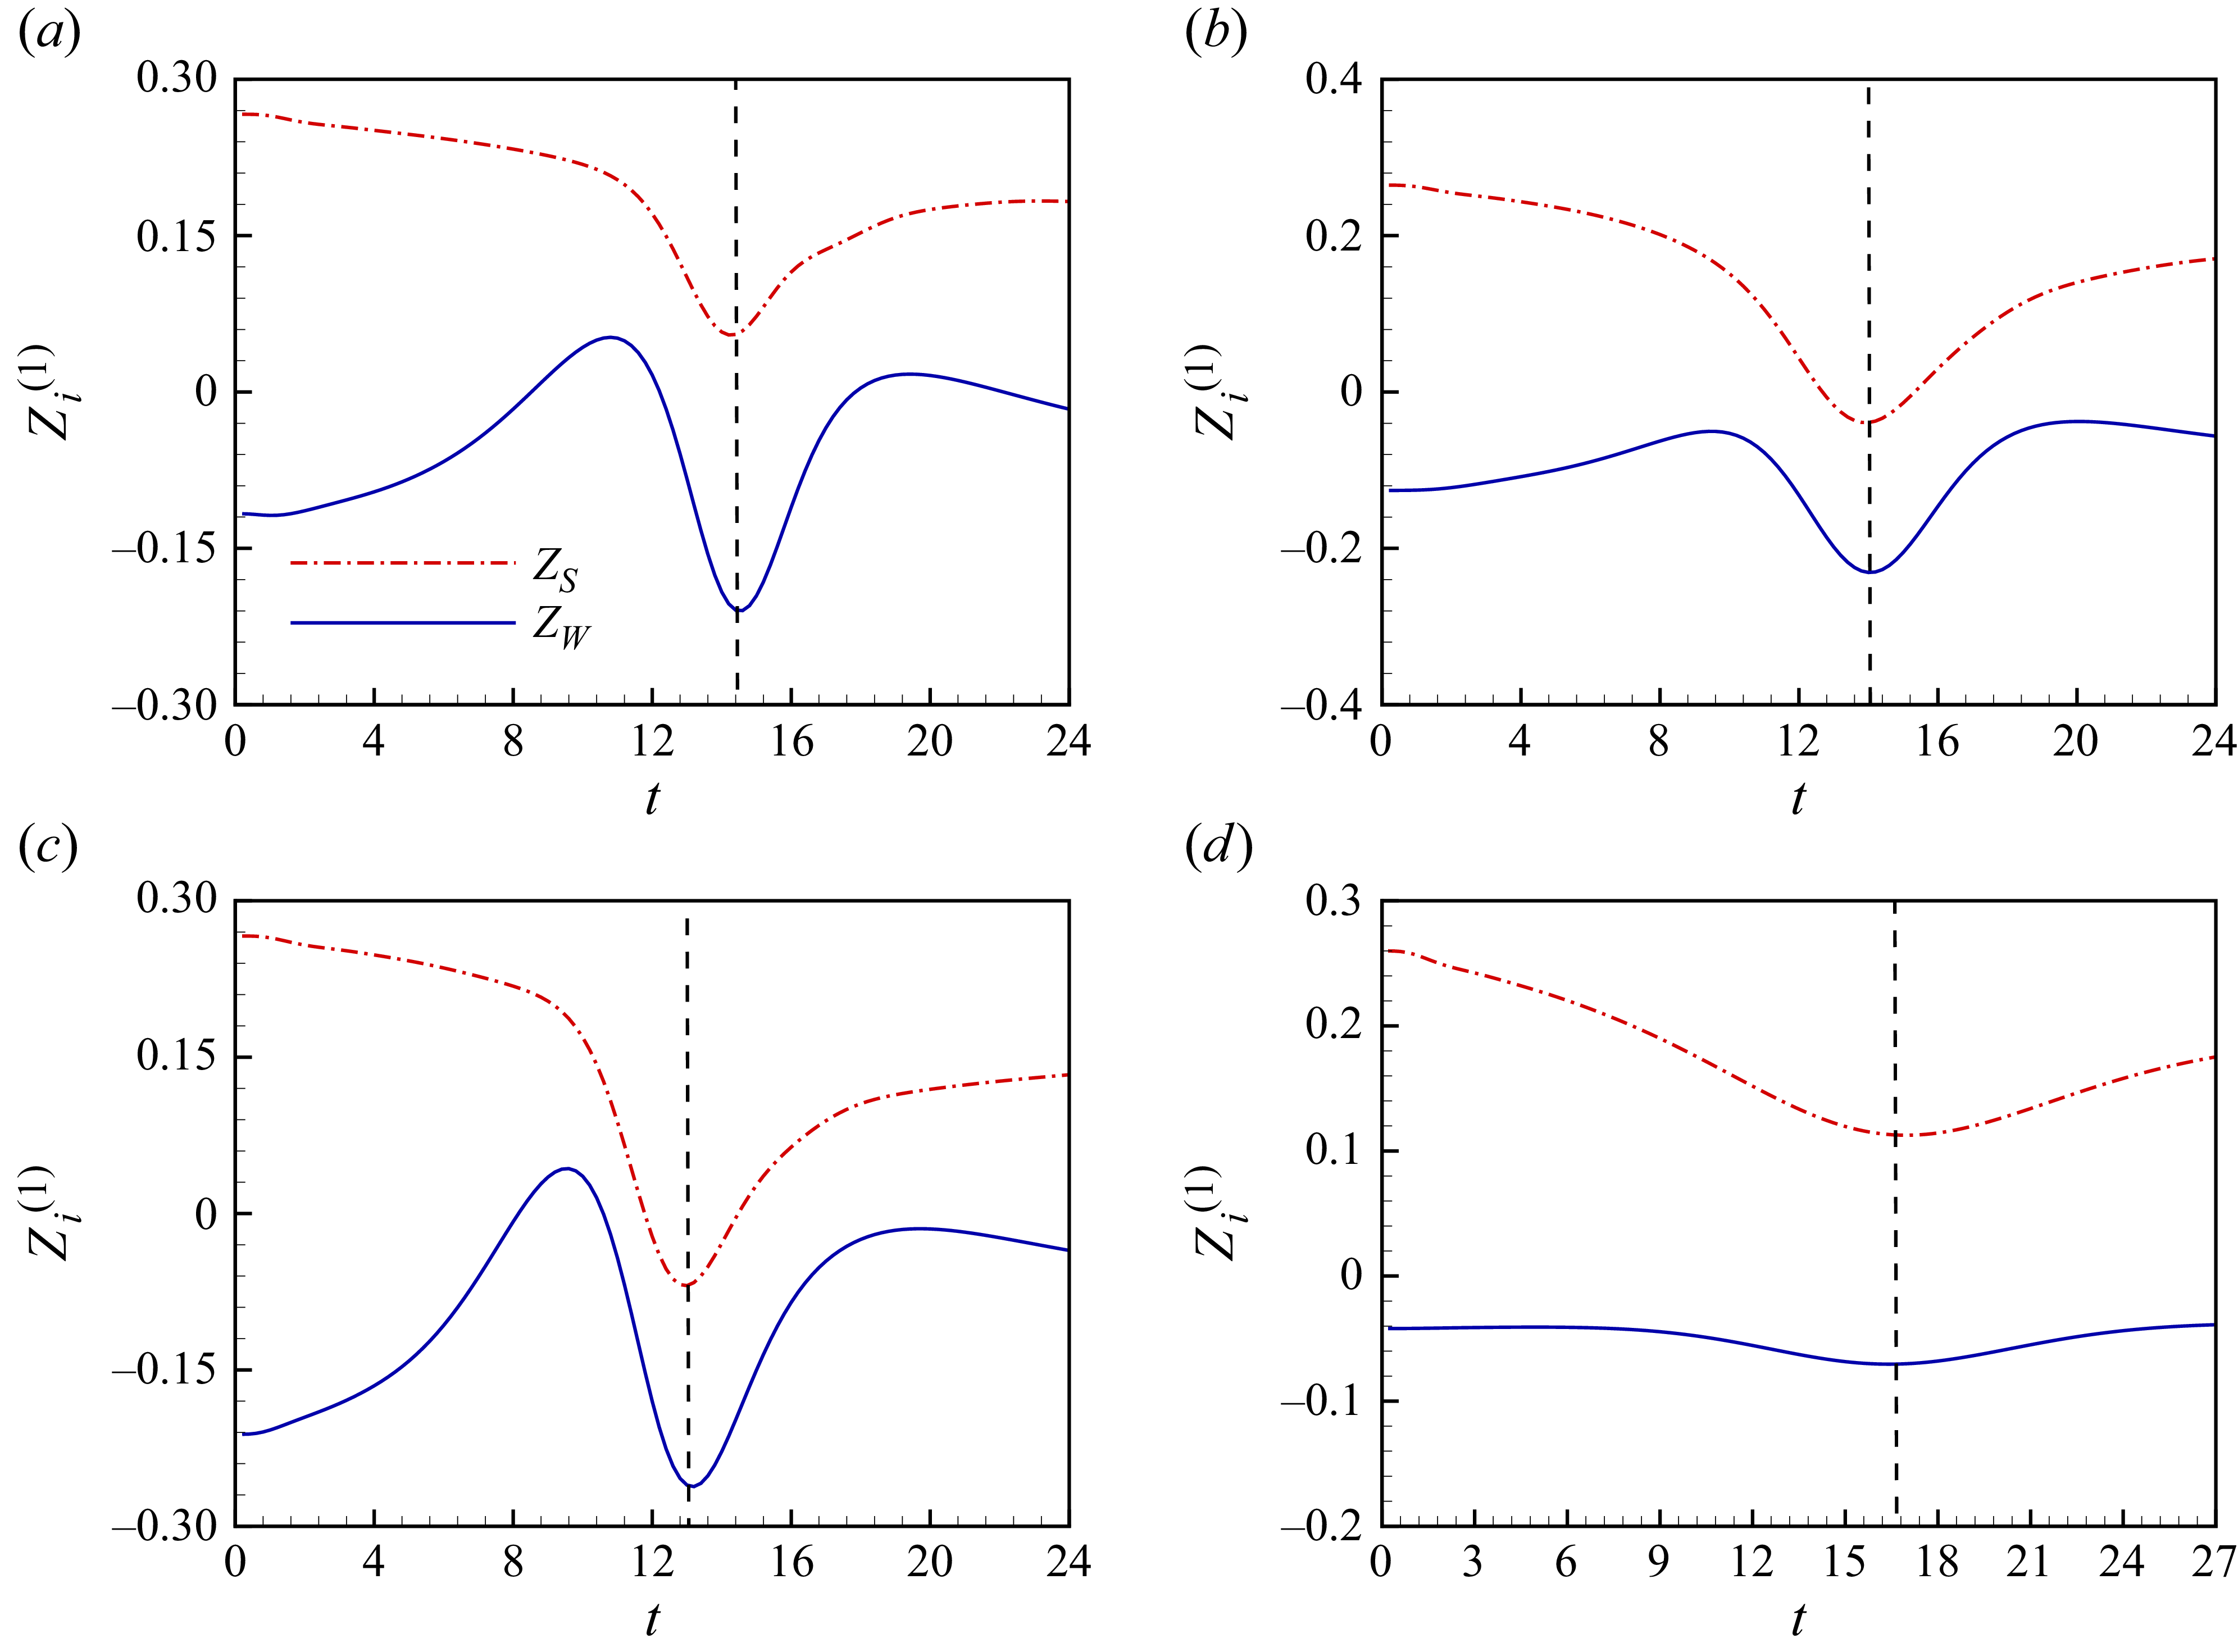
The axial velocity of two vortex rings with initial circulation ratio and radius ratio (a)
 $\gamma =0.30, \eta =0.60$
, (b)
 $\gamma =0.50, \eta =1.00$
, (c)
 $\gamma =0.50, \eta =0.60$
and (d)
 $\gamma =0.40, \eta =2.20$
.

The radial acceleration of two vortex rings with initial circulation ratio and radius ratio (a)
 $\gamma =0.30, \eta =0.60$
, (b)
 $\gamma =0.50, \eta =1.00$
, (c)
 $\gamma =0.50, \eta =0.60$
and (d)
 $\gamma =0.40, \eta =2.20$
.

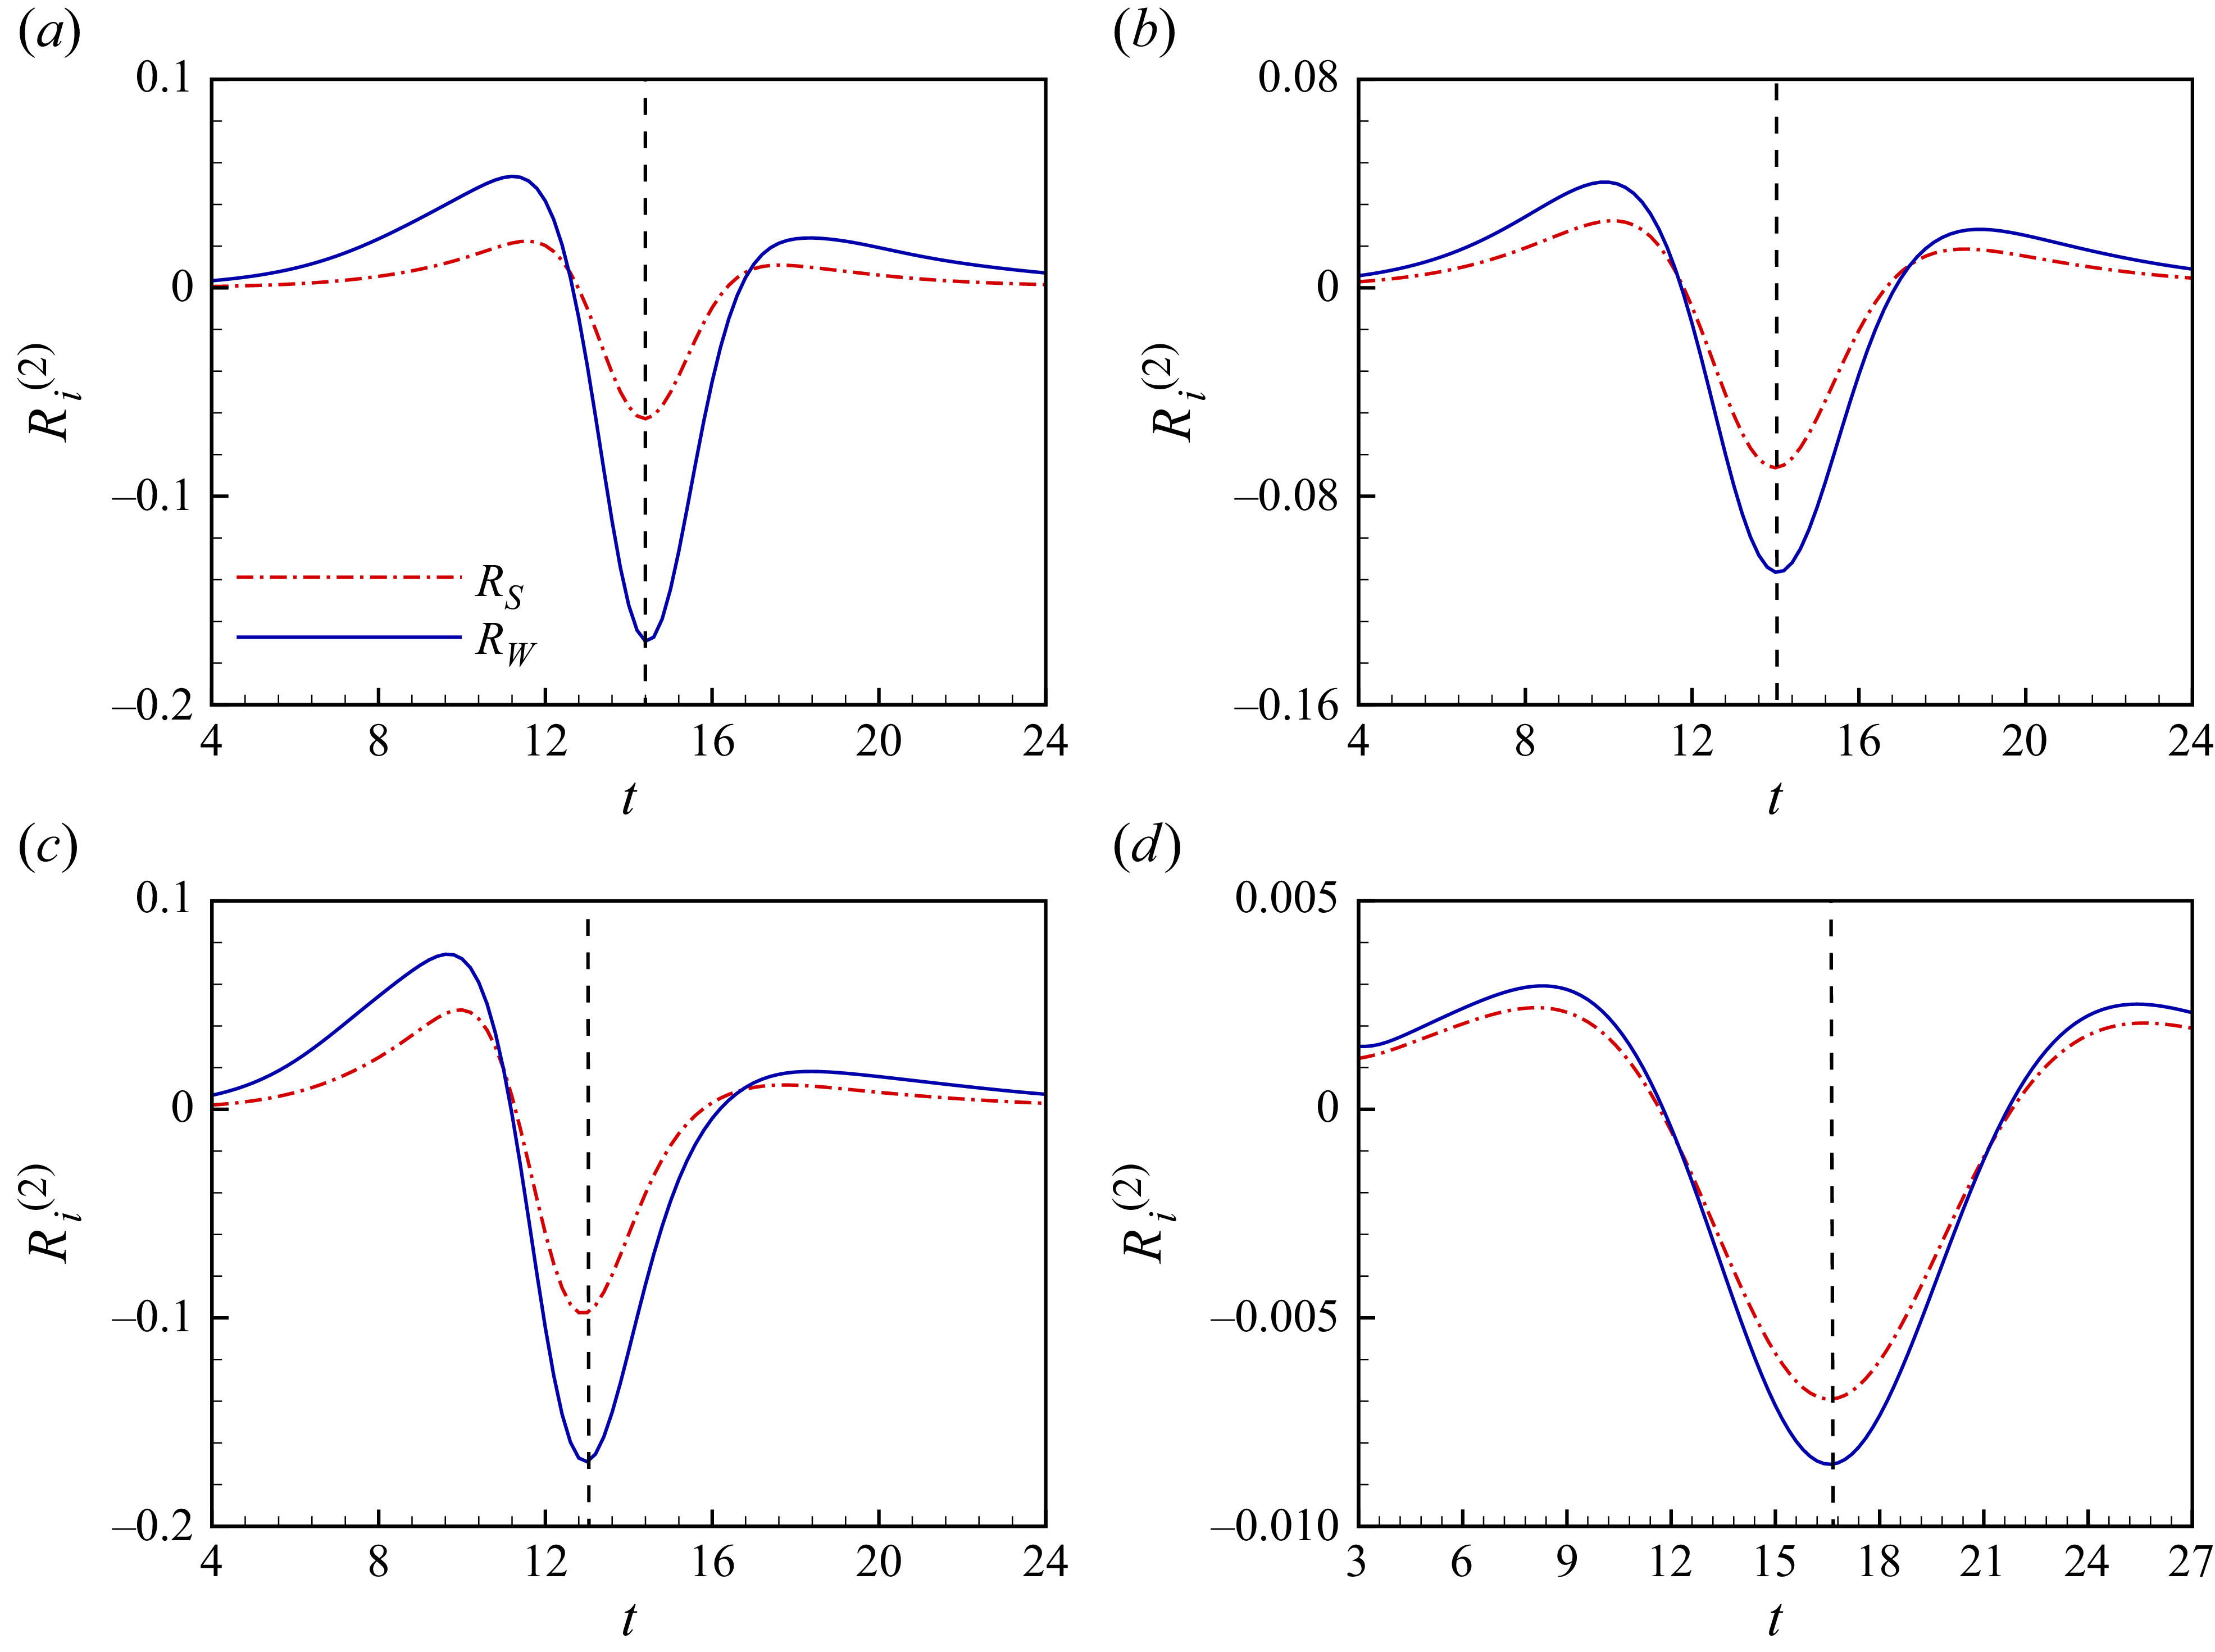
Figure 18 shows the axial velocity of two vortex rings for the cases with the four initial configurations. The dashed lines represent the instant when the source term related to radial acceleration of the weaker ring reaches the peak in the negative pulse, which is also the coplanar configuration during the interaction of the vortex rings. The peaks are also observed for the axial velocity in this instant. All of the axial velocity of the stronger ring first decreases and then increases. The axial velocity of the weaker ring has three pulses. The reversal of axial velocity of the stronger ring takes place near the vortex ring coplanar configuration for cases with initial configurations
 $\gamma =0.50, \eta =0.10$
and
 $\gamma =0.50, \eta =0.06$
. The reversal of axial velocity of the weaker ring is observed before the vortex ring coplanar configuration. Figure 19 shows the radial acceleration of two vortex rings for the four initial configurations. The time evaluations of the radial acceleration of the stronger and weaker rings in the four cases are similar, which is featured by positive–negative–positive peaks. The negative peaks are also observed at the coplanar configuration. Figures 18(d) and 19(d) quantify the interaction of two vortex rings with initial configuration
 $\gamma =0.40, \eta =2.20$
, which is not readily apparent in figure 10. In this sense, both the axial velocity
 $Z_i^{(1)}$
and the radial acceleration
 $R_i^{(2)}$
are dominant vortex dynamics in sound generated by the coaxial collision of two vortex rings. It is noteworthy that both positive and negative values of
 $Z_i^{(1)}$
are observed during the coaxial collision of the two vortex rings because of their reverse motion. The velocity of vortex rings also plays an important role in sound generated by their coaxial collision, which is not reported in previous work.
Figure 20 shows the natural logarithm of the ratios between the absolute peak values of the axial velocity of vorticity centroids for weaker and stronger rings
 $\beta _1=\mathrm{ln} |Z_{W}^{(1)} / Z_{S}^{(1)}|$
and those of the radial acceleration of vorticity centroids
 $\beta _2=\mathrm{ln} |R_{W}^{(2)} / R_{S}^{(2)}|$
. The change in
 $\beta _1$
against the initial vortex ring radius ratio
 $\eta$
is almost the same as that of the ratio between the peak values of the source term
 $\varepsilon =\mathrm{ln} |T_{3W,p}/ T_{3S,p}|$
. The relationship between
 $\varepsilon$
and
 $\beta _1$
is shown in figure 20(c) and can be expressed as
 \begin{align} \beta _1 \propto \varepsilon . \end{align}
The critical initial vortex ring radius ratios for
 $\beta _1\lt 0$
are identical to those separating whether the stronger or weaker ring contributes more significantly to the sound source fluctuations. It shows that if the contribution from the source term related to the stronger ring
 $T_{3,S}$
is more than that from
 $T_{3,W}$
, the axial velocity of the stronger ring
 $Z_S^{(1)}$
is also larger than that of the weaker ring
 $Z_W^{(1)}$
. The changes in
 $\beta _2$
against the initial vortex ring radius ratio decrease monotonically. The values of
 $\beta _2$
remain positive in the vast majority of cases and are slightly less than 0 only for cases of the initial vortex ring circulation and radius ratios
 $\gamma =0.45, \eta =2.50$
and
 $\gamma =0.50, \eta =2.30,2.40,2.50$
. It indicates that the absolute value of the acceleration component in the
 $r$
direction of the weaker ring
 $R_W^{(2)}$
remains greater than or approximately equal to that of the stronger ring
 $R_S^{(2)}$
. Therefore, the difference in the contributions of the stronger and weaker rings to the sound source as shown in figure 16 mainly depends on the axial velocity of the vorticity centroid.
It is noted that for the case with a large initial radius ratio
 $\eta$
and a small initial circulation ratio
 $\gamma$
, the interaction between vortex rings is mild and the fluctuation of the sound source is also low. A new phenomenon occurs by which the stronger ring contributes more significantly to the sound. The relationship shown in (4.7) can provide insights into understanding the mechanism of the transition in dominant role from the weaker ring to the stronger ring. The acceleration and deceleration of vortex rings are the key mechanism. This manifests as the deceleration of the stronger ring due to the velocity induced by the weaker ring, which is contrary to the travelling direction of the stronger ring, even leading to a reverse velocity during the evolution of the stronger ring. In contrast, the evolution of the weak vortex ring is characterised by the acceleration of the weaker ring in the negative direction due to the velocity induced by the stronger ring. Within the parameter range investigated in our work, the initial axial velocity of the stronger ring is larger than that of the weaker ring. For the case with a relatively small initial radius ratio
 $\eta$
, an intense interaction occurs around the coplanar configuration, resulting in a rapid deceleration of the stronger ring and a rapid acceleration of the weaker ring. The absolute value of the axial velocity of the weaker ring is larger than that of the stronger ring. The intense interaction leads to the contribution to the sound source from the weaker ring being more than that from the stronger ring. For the cases with a relatively large initial radius ratio
 $\eta$
, a mild interaction between the two vortex rings occurs. The stronger and weaker rings experience relatively mild deceleration and acceleration, respectively. This leaves the relative magnitudes between the axial velocity of the two vortex rings unchanged. Therefore, the dominance of the weaker ring in generating the sound source does not occur.
The ratios between the peaks of (a) the velocity component in the
 $z$
direction of the vorticity centroids
 $\beta _1=\mathrm{ln} |Z_{W}^{(1)} / Z_{S}^{(1)}|$
and (b) the acceleration component in the
 $r$
direction of the vorticity centroids
 $\beta _2=\mathrm{ln} |R_{W}^{(2)} / R_{S}^{(2)}|$
. (c) The relationship of the ratios between the source term
 $\varepsilon =\mathrm{ln} |T_{3W,p}/ T_{3S,p}|$
and the ratios between the axial velocity of the vorticity centroids
 $\beta _1=\mathrm{ln} |Z_{W}^{(1)} / Z_{S}^{(1)}|$
.

5. Conclusion
The coaxial collisions of two vortex rings with initial configurations of different initial vortex ring radius ratios
 $\eta$
and initial vortex ring circulation ratios
 $\gamma$
are numerically simulated in viscous flows.
The sound generated by the coaxial collisions of the two vortex rings features three pulses with positive–negative–positive peaks, respectively. The second pulses have the intensest peaks during the time evaluation of the sound source. The variations of the amplitude of the second pulse are studied in the present work. As the initial vortex ring radius ratio
 $\eta$
increases, the amplitude of the three pulses decreases. The negative peaks of the second pulses are positively correlated with the initial circulation ratios
 $\gamma$
and negatively correlated with the initial radius ratios
 $\eta$
. The source in the theory of vortex sound can be decomposed into terms related to the vorticity centroid dynamics of the stronger rings and the weaker rings. The velocity, acceleration and jerk of the vorticity centroids of vortex rings are the main factors for the sound source. The term related to the radial acceleration and axial velocity of the vortex rings
 $T_3=6 \sum _{i} \varGamma _{i} R_{i} {R}_{i}^{(2)} {Z}_{i}^{(1)}$
is the dominant contributor to the second pulses. The conclusion reported in prior work that the weaker ring plays a dominant role in the sound source is valid only in a local region. A threshold separating whether the dominance of the weaker ring in generating the sound source occurs is found. For cases with initial vortex ring radius ratios above the critical threshold, a relatively weak interaction between the vortex rings occurs, producing a significantly lower sound source, in which the dominance of the weaker ring in generating the sound source does not occur.
In the present work, four patterns of the interactions of two vortex rings are identified. The four patterns are classified based on whether the stronger and weaker rings exhibit reverse motion. The axial velocity and radial acceleration of vortex rings in the four patterns are analysed. The reverse motion of the stronger ring near the coplanar configuration plays a significant role in the peaks of the negative peak of the sound source. The ratio between the peaks of the sound source
 $T_{3,W}$
and
 $T_{3,S}$
is linearly correlated with the ratio between the peaks of the axial velocity
 $Z_{W}^{(1)}$
and
 $Z_{S}^{(1)}$
. The axial velocity of the vorticity centroid is identified as the key kinematic parameter for generating the far-field sound.
Supplementary materials
Supplementary materials are available at https://doi.org/10.1017/jfm.2026.11630.
Acknowledgements
This work is supported by NSFC via the Excellence Research Group Program for multiscale problems in nonlinear mechanics (grant no. 12588201), the National Natural Science Foundation of China (no. 12425207), the Chinese Academy of Sciences Project for Young Scientists in Basic Research (grant no. YSBR-087) and the Strategic Priority Research Program of Chinese Academy of Sciences (grant no. XDB0620102). In the preparation of the manuscript, the authors used ChatGPT for improvement of grammatical fluency. The AI-generated content was subsequently rigorously reviewed and edited by the authors, who take full responsibility for the accuracy, integrity and originality of the final content.
Declaration of interests
The authors report no conflict of interest.
Appendix A. The far-field sound pressure obtained by three-dimensional validation simulations
To ascertain whether azimuthal waves occur at the current Reynolds number, a full three-dimensional simulation for the interaction of two vortex rings with initial circulation ratio
 $\gamma =0.50$
and radius ratio
 $\eta =1.00$
is conducted. The full three-dimensional domain is a rectangular domain of
 $y_{1,3} \in [ -6,6 ], y_{2} \in [ 0,18 ]$
. The subdomain
 $y_{1,3} \in [ -4,4 ], y_{2} \in [ 6,14 ]$
, where the interaction of vortex rings occurs, is discretised with a spatial step size of
 ${\rm d}y_i = 0.02$
. The spatial step size is selected to balance computational cost and numerical accuracy, with verification confirming that its impact on the far-field sound predictions is negligible in figure 2. The mesh transitions from the locally refined subdomain to the outer boundaries via a linear expansion, reaching a maximum spacing of
 ${\rm d}h = 0.05$
at the boundaries. The cells of the full three-dimensional domain are approximately
 $2.1 \times 10^8$
. A slip boundary condition is used in the three directions. The time step is set as
 ${\rm d}t=0.0025$
and the simulation duration is
 $T_E=24$
. The initial velocity field is calculated via the Biot–Savart law:
 \begin{align} \boldsymbol{\mathit{u}}=\frac {1}{4\pi } \int \frac {\boldsymbol{\mathit{\omega }} \times \boldsymbol{\mathit{y}}}{\left | \boldsymbol{\mathit{y}} \right | ^{3} }{\rm d}V . \end{align}
The far-field sound in a three-dimensional flow can be investigated by a Cartesian coordinate system
 $(y_1,y_2,y_3)$
and a spherical coordinate system
 $(r_s,\theta _s,\phi _s)$
. The formula for the sound pressure can be approximated by two quadrupolar modes as follows (Kambe Reference Kambe2010):
 \begin{align} p'\left ( {r_s,\theta _s ,\phi _s ,t} \right ) \approx A_1(t) P_{2}^{0}(\cos \theta _s) + A_2(t) P_{2}^{2}(\cos \theta _s)\cos (2\phi _s) , \end{align}
where
 $P_{n}^{m}$
is the associated Legendre polynomials of degree
 $n$
and order
 $m$
and
 $A_1$
and
 $A_2$
are the coefficients of the two quadrupolar modes, respectively. Coefficients
 $A_1$
and
 $A_2$
can be computed as follows:
 \begin{align} A_{1} & =-\frac {\rho _{0}}{c_{0}^{2}r}Q_{33}^{(3)}(t) , \\[-12pt] \nonumber \end{align}
 \begin{align} A_{2} & =-\frac {\rho _{0}}{6c_{0}^{2}r}\left [ Q_{11}^{(3)}(t) - Q_{22}^{(3)}(t) \right ] , \\[-12pt] \nonumber \end{align}
 \begin{align} Q_{ij}(t)& =-\frac {1}{12\pi } \int {\left ( \boldsymbol{\mathit{y}} \times \boldsymbol{\mathit{\omega }} \right )_{i}y_{j} }\,{\rm d}V. \\[10pt] \nonumber \end{align}
The perturbed initial vortex ring radius of the stronger ring.

The sound pressure is detected at
 $r_s=60$
and
 $\theta _s=\pi /2, \phi _s=\pi /2$
, which coincides with the position of
 $\boldsymbol{\mathit{x}}=60, \theta =0$
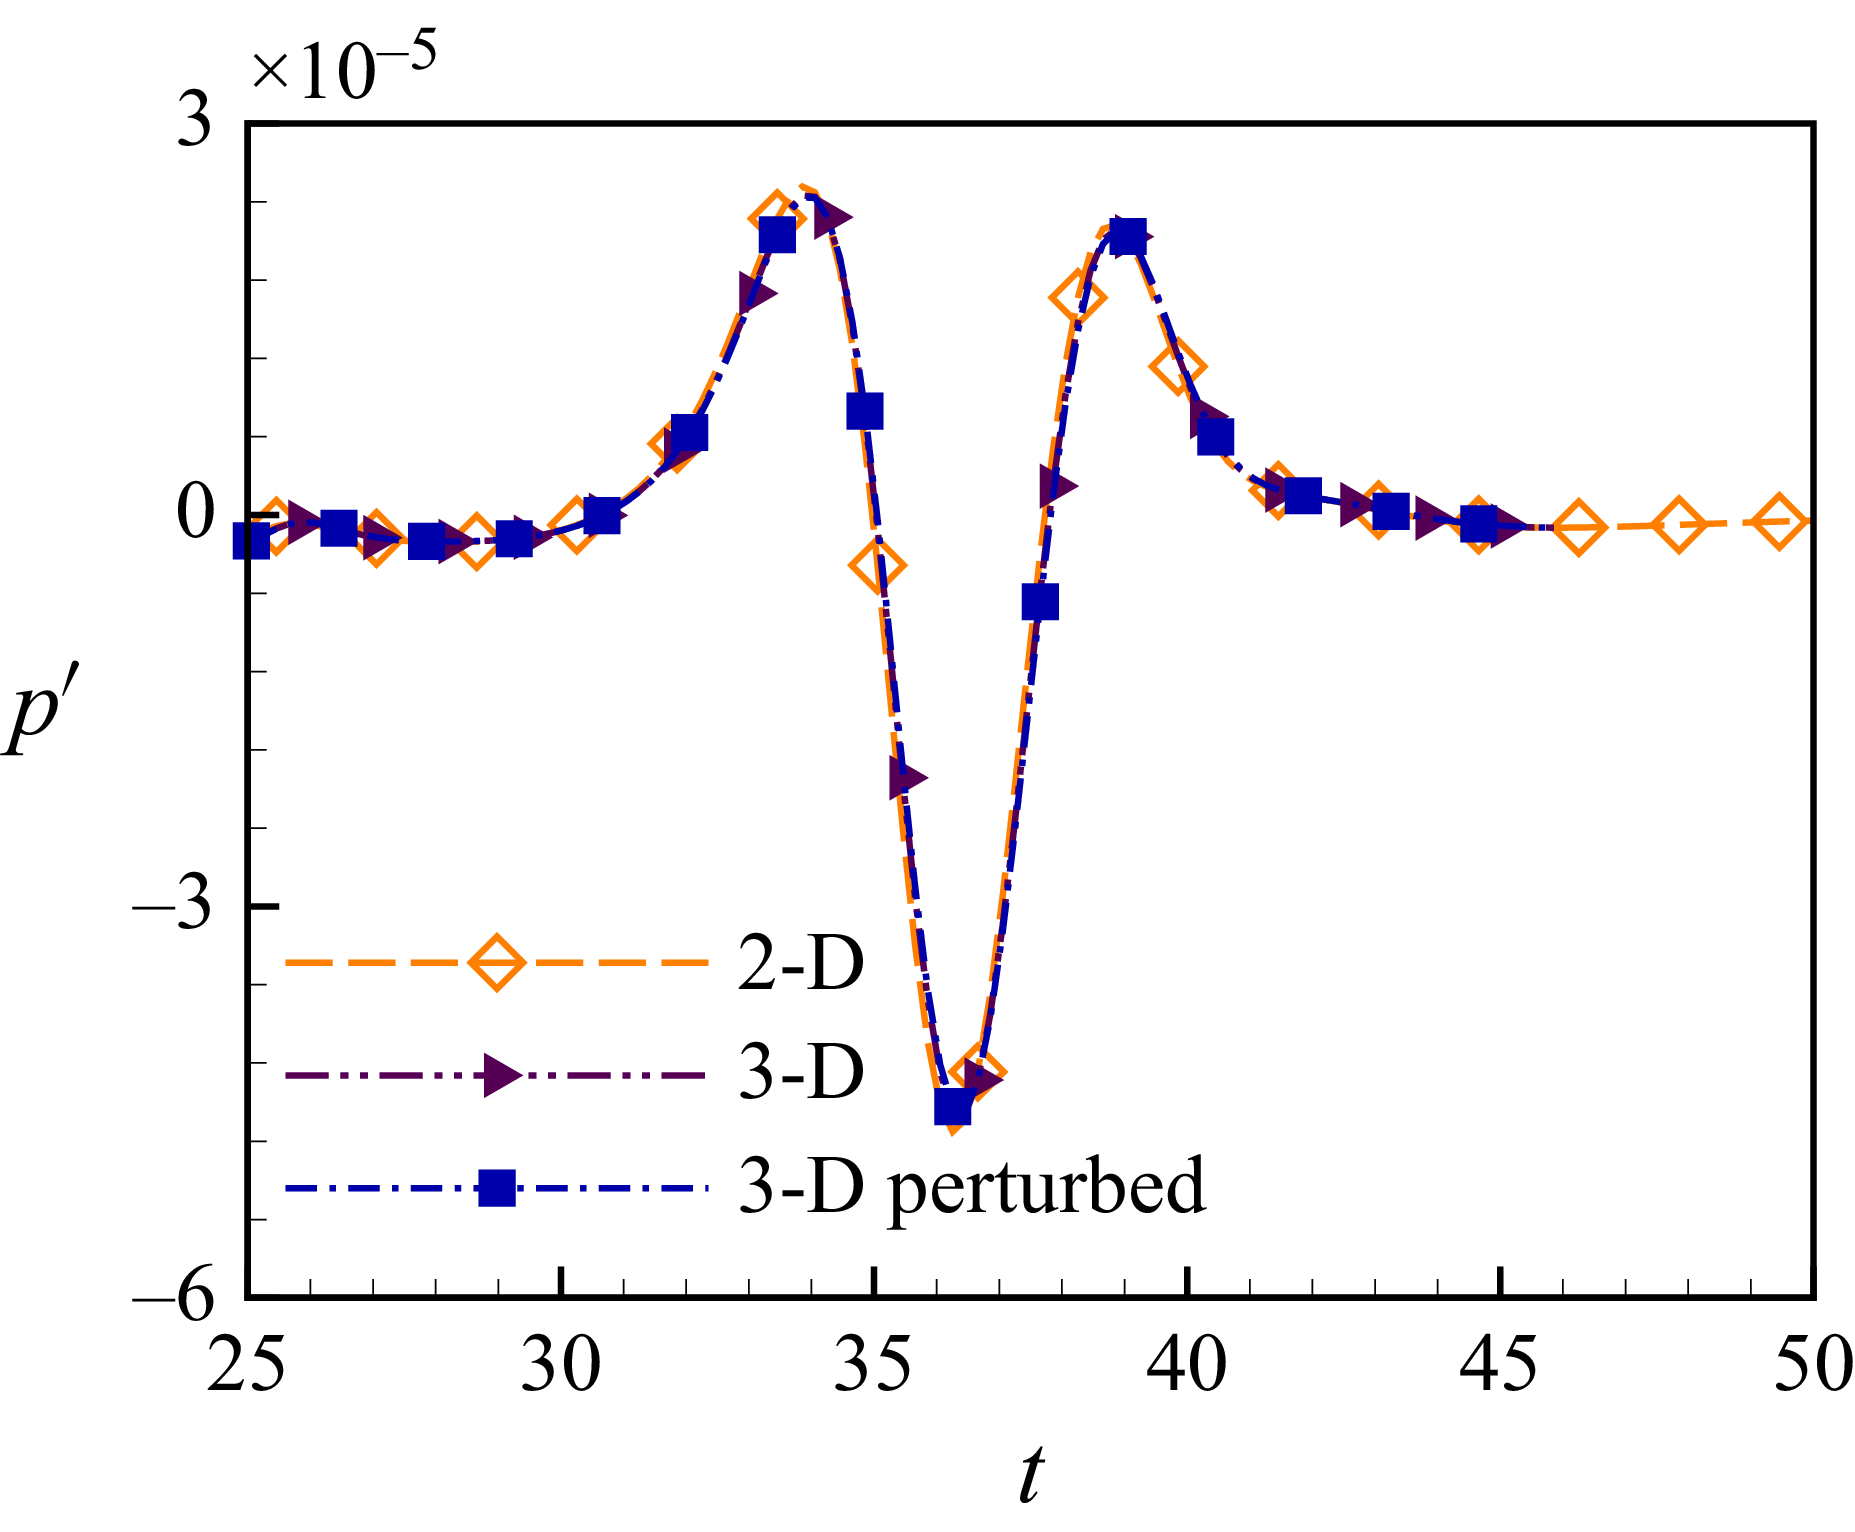
in (2.2). The sound pressure obtained from the axisymmetric simulation and the full three-dimensional simulation is shown in figure 22. The sound pressure is highly consistent. This suggests that azimuthal waves do not occur at the current Reynolds number.
To further investigate the impact of azimuthal waves on the far-field sound, the interaction of two vortex rings with random perturbation is simulated in the full three-dimensional domain. The random perturbation which is a sum of the 32 Fourier modes with random phases
 $\varphi _r$
and uniform magnitudes
 $\epsilon = 6.0\times 10^{-4} R_{S0}$
is imposed on the vortex ring radius. The perturbed initial vortex ring radius can be expressed as follows:
 \begin{align} R_{i,P} = R_{i0} \left(1+\sum _{i=1}^{32} \epsilon \cos (i\phi + \varphi _r )\right) , \end{align}
where the subscripts
 $i=S,W$
represents the stronger ring and weaker ring, respectively. Figure 21 shows the perturbed initial vortex ring radius of the stronger ring. The initial perturbation follows the methodology described by Shariff, Verzicco & Orlandi (Reference Shariff, Verzicco and Orlandi1994), Yu, Dorschner & Colonius (Reference Yu, Dorschner and Colonius2022) and Arun & Colonius (Reference Arun and Colonius2024). The sound generated by the interaction of two vortex rings with random perturbation is also shown in figure 22. The differences in sound pressure are negligible. This indicates that the initial perturbation does not develop into azimuthal waves.
Mansfield, Knio & Meneveau (Reference Mansfield, Knio and Meneveau1999) believe that without an initial perturbation, the onset of azimuthal instability in vortex rings is notably elusive. According to the numerical study of the head-on collision of two counter-rotating vortex rings with circulations of equal strength and equal radii, azimuthal waves are observed at Reynolds number
 $ \textit{Re}=2200$
(Mansfield et al. Reference Mansfield, Knio and Meneveau1999) and
 $ \textit{Re}=3500$
(McKeown et al. Reference McKeown, Ostilla-Mónico, Pumir, Brenner and Rubinstein2018) when initial perturbations with uniform magnitudes
 $10^{-2} R_{0}$
are imposed. Furthermore, azimuthal waves are observed at Reynolds number
 $ \textit{Re}=7500$
(Yu et al. Reference Yu, Dorschner and Colonius2022; Arun & Colonius Reference Arun and Colonius2024) when initial perturbations with uniform magnitudes
 $10^{-4} R_{0}$
are imposed. It is noted that azimuthal waves occur subsequent to a pronounced radial stretching. This indicates a dual dependence of the azimuthal waves on the Reynolds number and the magnitude of the initial perturbation. Once the azimuthal waves have developed, they completely change the interaction of the vortex rings. When two vortex rings collide with each other, vortex lines in each vortex ring reconnect to those in another vortex ring. Subsequently, secondary vortex structures develop, such as smaller vortex tubes (Yu et al. Reference Yu, Dorschner and Colonius2022; Arun & Colonius Reference Arun and Colonius2024). Vortex reconnection plays a significant role in the generation of sound radiation. The details of the mechanism of the vortex reconnection generating far-field sound are reported by Zang et al. (Reference Zang, Zhou, Liu and Wang2025).
The sound pressure obtained by the axisymmetric simulation and the full three-dimensional simulations.

Appendix B. The sound source generated by two vortex rings with initial circulation ratios
 $\boldsymbol{\gamma =0.30, 0.40, 0.45, 0.50}$

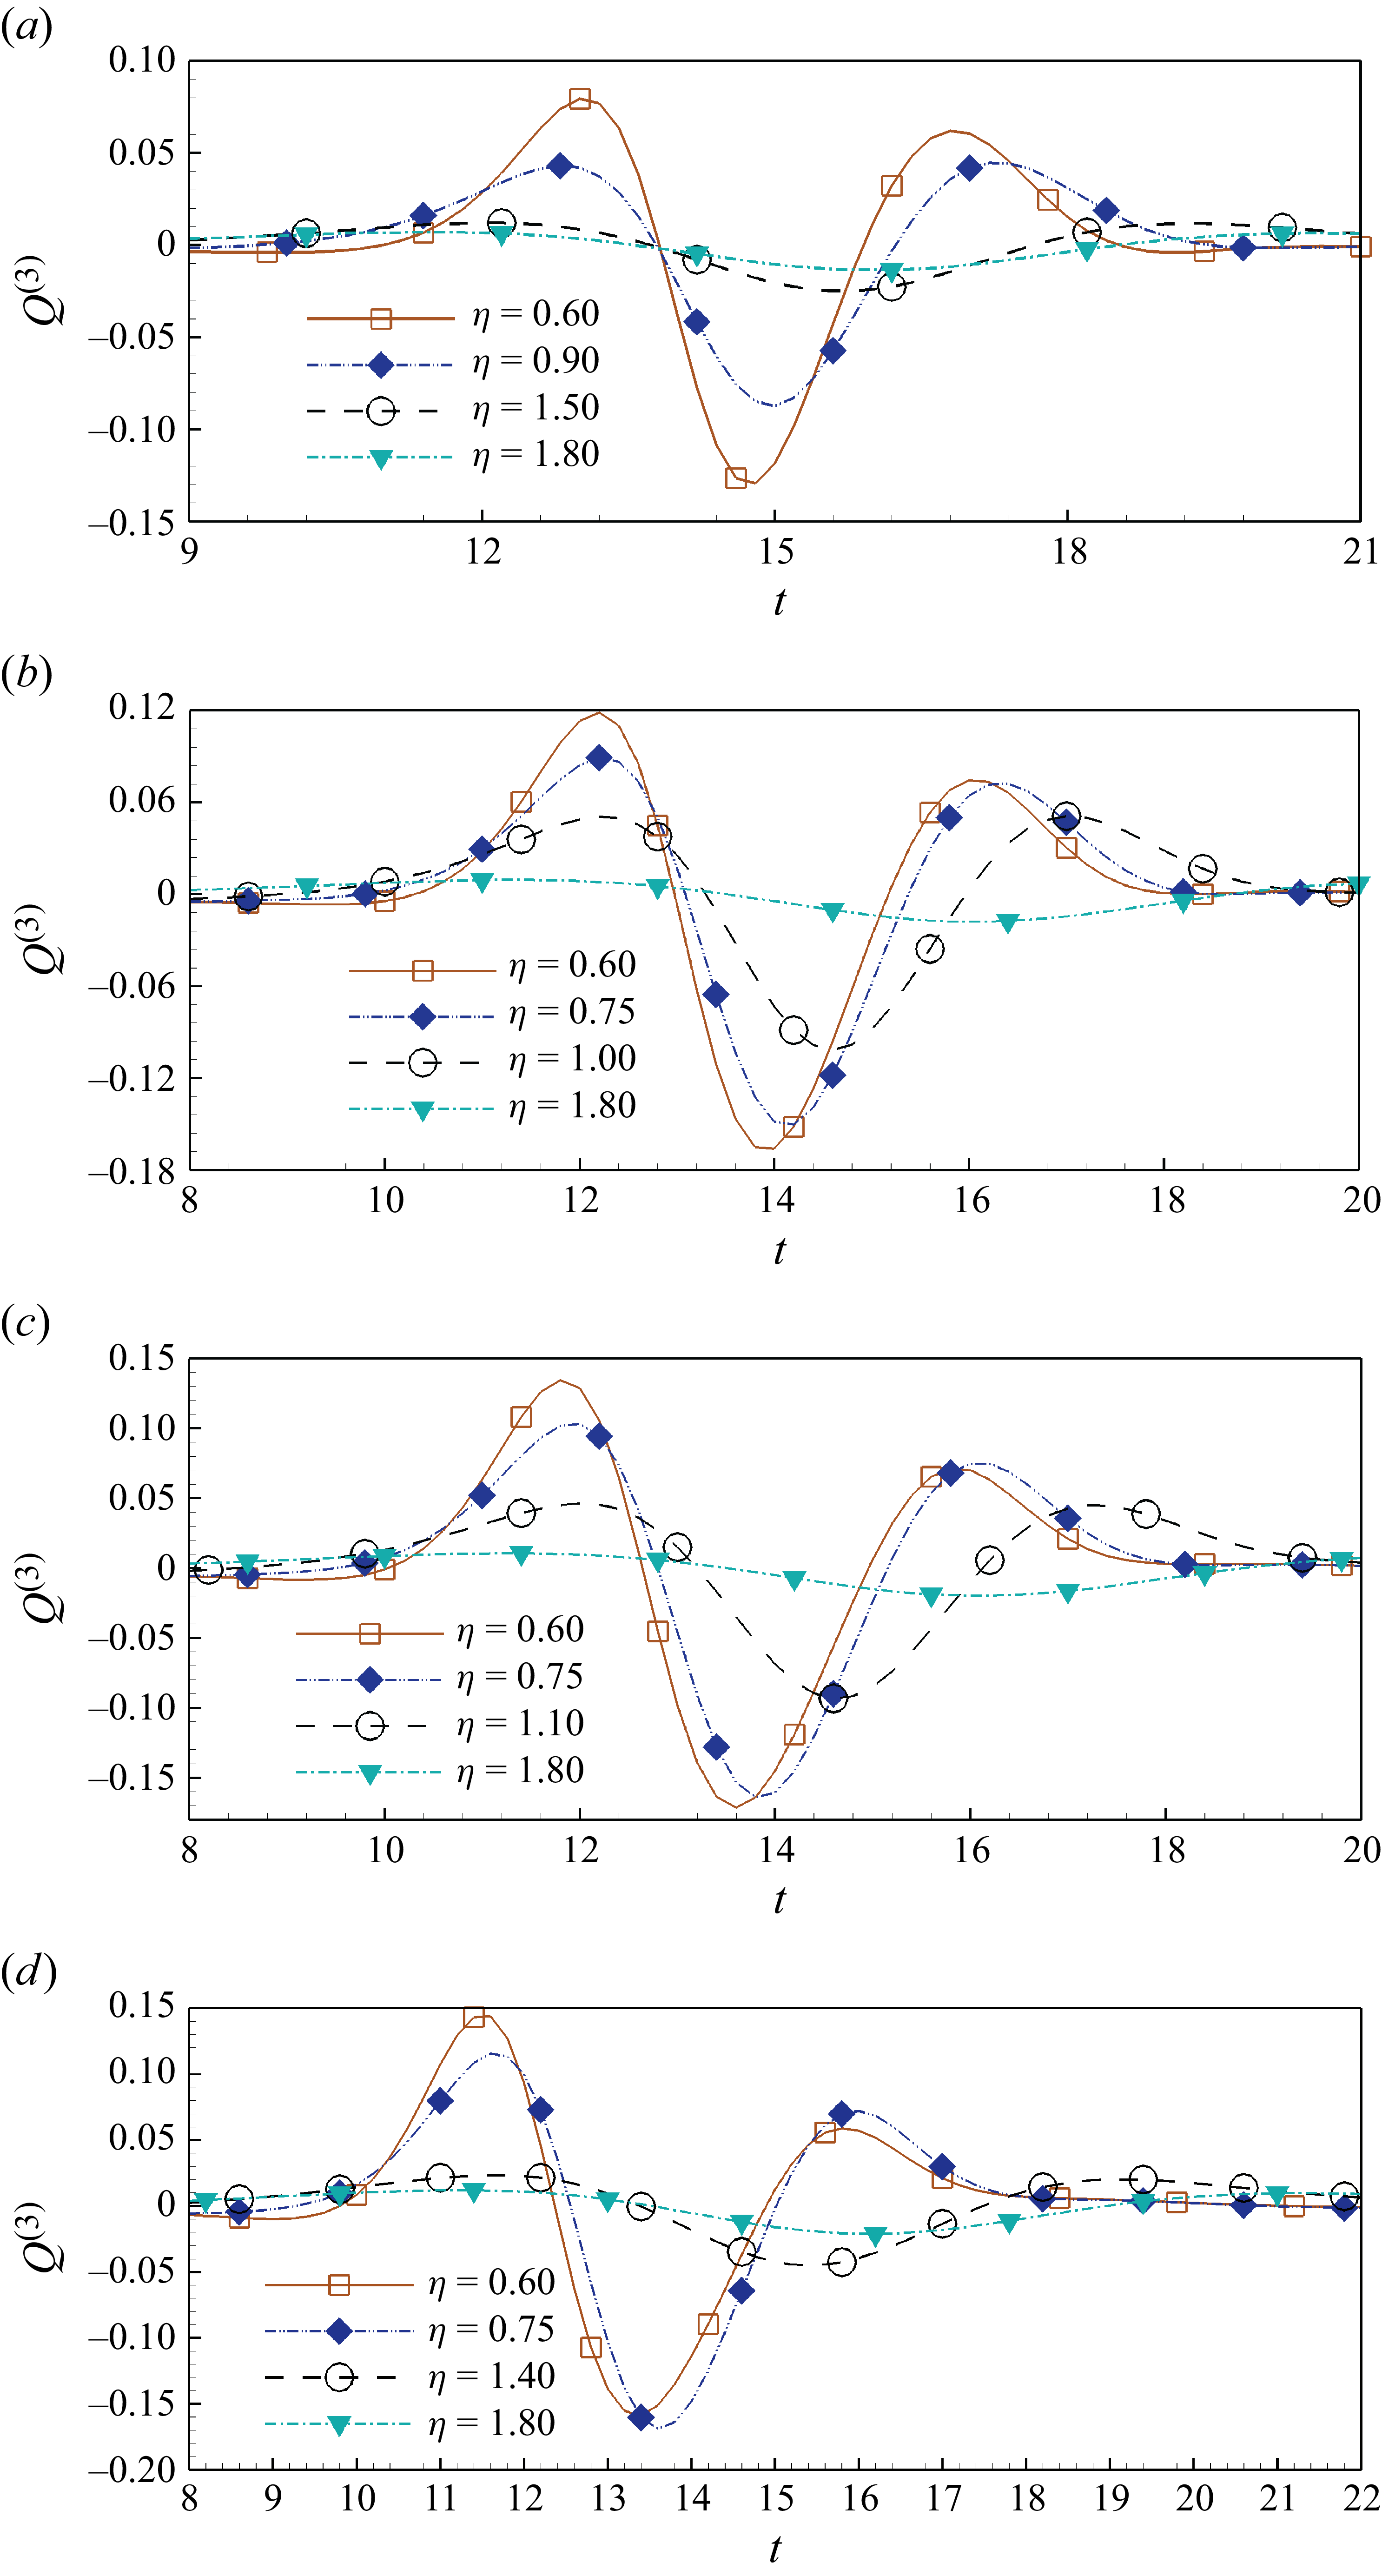
The sound source generated by the coaxial head-on collision of two vortex rings with initial configurations of
 $\eta =0.6{-} 2.5$
for (a)
 $\gamma =0.30$
, (b)
 $\gamma =0.40$
, (c)
 $\gamma =0.45$
and (d)
 $\gamma =0.50$
.

The temporal evolutions of the sound sources generated by the interactions of two vortex rings with initial circulation ratios
 $\gamma =0.30, 0.40, 0.45, 0.50$
are reported in figure 23. The behaviour of the sound sources are similar to that analysed in § 4.2. Three pulses are also observed in all cases. As the initial radius ratio
 $\eta$
increases, the amplitudes of the three pulses decrease. The instants
 $t_{\textit{peaks}}$
are also delayed as
 $\eta$
grows.
Appendix C. The sound pressure formula with circulation decay due to viscosity
The circulation decay due to viscosity should be taken into account for studying the mechanism of sound generated by the interaction of vortex rings in viscous flows, as expressed by (4.5). More details of the term
 $T_{{td}}$
related to the time derivatives of the circulations of vortex rings of (4.5) are reported here. Term
 $T_{{td}}$
consists of three components related to the first-, second- and third-order time derivatives of vortex ring circulations, respectively. The term related to the first-order time derivative of the vortex ring circulation can be expressed as
 \begin{align} f(\varGamma ^{(1)}) &= 6 \sum _{i} \varGamma _{i}^{(1)} R_{i} {R}_{i}^{(1)} {Z}_{i}^{(2)} + 6 \sum _{i} \varGamma _{i}^{(1)} {R}_{i}^{(1) 2} {Z}_{i}^{(1)} + 6 \sum _{i} \varGamma _{i}^{(1)} R_{i} {R}_{i}^{(2)} {Z}_{i}^{(1)} \nonumber \\[5pt]& \quad + 6 \sum _{i} \varGamma _{i}^{(1)} {R}_{i}^{(1)} {R}_{i}^{(2)} Z_{i} + \sum _{i} \varGamma _{i}^{(1)} R_{i}^{2} {Z}_{i}^{(3)} + 2 \sum _{i} \varGamma _{i}^{(1)} R_{i} {R}_{i}^{(3)} Z_{i}. \end{align}
The term related to the second-order time derivative of the vortex ring circulation can be expressed as
 \begin{align} f(\varGamma ^{(2)}) &= 6 \sum _{i} \varGamma _{i}^{(2)} R_{i} {R}_{i}^{(1)} {Z}_{i}^{(2)} + 6 \sum _{i} \varGamma _{i}^{(2)} {R}_{i}^{(1) 2} {Z}_{i}^{(1)} + 6 \sum _{i} \varGamma _{i}^{(2)} R_{i} {R}_{i}^{(2)} {Z}_{i}^{(1)} \nonumber \\[4pt]& \quad + 6 \sum _{i} \varGamma _{i}^{(2)} {R}_{i}^{(1)} {R}_{i}^{(2)} Z_{i} + \sum _{i} \varGamma _{i}^{(2)} R_{i}^{2} {Z}_{i}^{(3)} + 2 \sum _{i} \varGamma _{i}^{(2)} R_{i} {R}_{i}^{(3)} Z_{i}. \end{align}
The term related to the third-order time derivative of the vortex ring circulation can be expressed as
 \begin{align} f(\varGamma ^{(3)}) &= 6 \sum _{i} \varGamma _{i}^{(3)} R_{i} {R}_{i}^{(1)} {Z}_{i}^{(2)} + 6 \sum _{i} \varGamma _{i}^{(3)} {R}_{i}^{(1) 2} {Z}_{i}^{(1)} + 6 \sum _{i} \varGamma _{i}^{(3)} R_{i} {R}_{i}^{(2)} {Z}_{i}^{(1)} \nonumber\\[4pt]& \quad + 6 \sum _{i} \varGamma _{i}^{(3)} {R}_{i}^{(1)} {R}_{i}^{(2)} Z_{i} + \sum _{i} \varGamma _{i}^{(3)} R_{i}^{2} {Z}_{i}^{(3)} + 2 \sum _{i} \varGamma _{i}^{(3)} R_{i} {R}_{i}^{(3)} Z_{i}. \end{align}
The effects of these terms are shown in figure 13.