


1 Introduction
Recent experiments have shown that large steady-state plasma currents to the targets establish in the scrape-off-layer (SOL) of limited tokamaks (Dejarnac et al. Reference Dejarnac, Stangeby, Goldston, Gauthier, Horacek, Hron, Kocan, Komm, Panek and Pitts2015; Nespoli et al. Reference Nespoli, Furno, Halpern, Labit, Loizu, Ricci and Riva2016; Halpern et al. Reference Halpern, Labombard, Terry and Zweben2017; Nespoli et al. Reference Nespoli, Labit, Furno, Horacek, Tsui, Boedo, Maurizio, Reimerdes, Theiler and Ricci2017; Tsui et al. Reference Tsui, Boedo, Halpern, Loizu, Nespoli, Horacek, Labit, Morales, Reimerdes and Theiler2017). These currents, typically exceeding the ion saturation current, are radially localized and carry large amounts of negative charge out of the plasma via the sheaths in the near SOL. Given that essentially no charge is injected into the plasma, it must be that no net charge can be flowing out of the plasma in steady state. These observations thus lead to the following fundamental question: how are currents circulating and closing in the SOL?
The answer to this question is probably one of the missing pieces of the puzzle that is the generation of the so-called narrow heat flux feature in the SOL (Kocan et al.
Reference Kocan, Pitts, Arnoux, Balboa, de Vries, Dejarnac, Furno, Goldston, Gribov and Horacek2015), which has recently become crucial for the design of ITER and future magnetic fusion devices (Motojima Reference Motojima2015). While the sheath currents themselves are not the main direct contributors to the increased heat flux in the near SOL (Dejarnac et al.
Reference Dejarnac, Stangeby, Goldston, Gauthier, Horacek, Hron, Kocan, Komm, Panek and Pitts2015), the plasma potential profile resulting from the non-ambipolarity at the sheaths plays a crucial role in the description of the gradient steepening in the near SOL via strongly sheared
 $\boldsymbol{E}\times \boldsymbol{B}$
flows (Tsui Reference Tsui1992; Halpern & Ricci Reference Halpern and Ricci2017).
If there were no radial cross-field currents in the SOL, then every flux tube would be independent in terms of charge conservation. Namely, we would have that in a given flux tube the plasma current to the targets, if any, is equal and opposite at each end of the field line. Experiments show, however, that on certain flux tubes, large equilibrium plasma currents evacuate net charge at the targets, and associated with that a non-zero floating potential is measured. This suggests that non-divergence-free cross-field currents must develop in the SOL to ensure charge conservation. Furthermore, since the plasma density radially decays in the SOL, the net positive charge that is transported by cross-field currents is most likely evacuated through the sheaths as well, perhaps in the transition between the near SOL and the far SOL. A somewhat equivalent picture was already realized in Tsui (Reference Tsui1992). In that work, however, a current circulation model was developed based on the assumption that cross-field transport was dominated by ion–neutral collisions, and the magnitude of the non-ambipolar flows established at the sheaths was predicted to increase with the ion–neutral collision frequency. While this model may certainly explain non-ambipolar flows in certain experiments (Strawitch & Emmert Reference Strawitch and Emmert1981), it cannot describe the recent observations made in ITER-relevant tokamak devices: the fact that the magnitude of these sheath currents decreases with plasma collisionality, namely with the normalized collision frequency
 $\unicode[STIX]{x1D708}_{\text{SOL}}^{\ast }$
(Tsui et al.
Reference Tsui, Boedo, Halpern, Loizu, Nespoli, Horacek, Labit, Morales, Reimerdes and Theiler2017). Moreover, it has been recently shown via nonlinear SOL turbulence simulations that both the heat-flux narrow feature and the associated non-ambipolar flows arise even without accounting for the effect of neutrals (Halpern & Ricci Reference Halpern and Ricci2017).
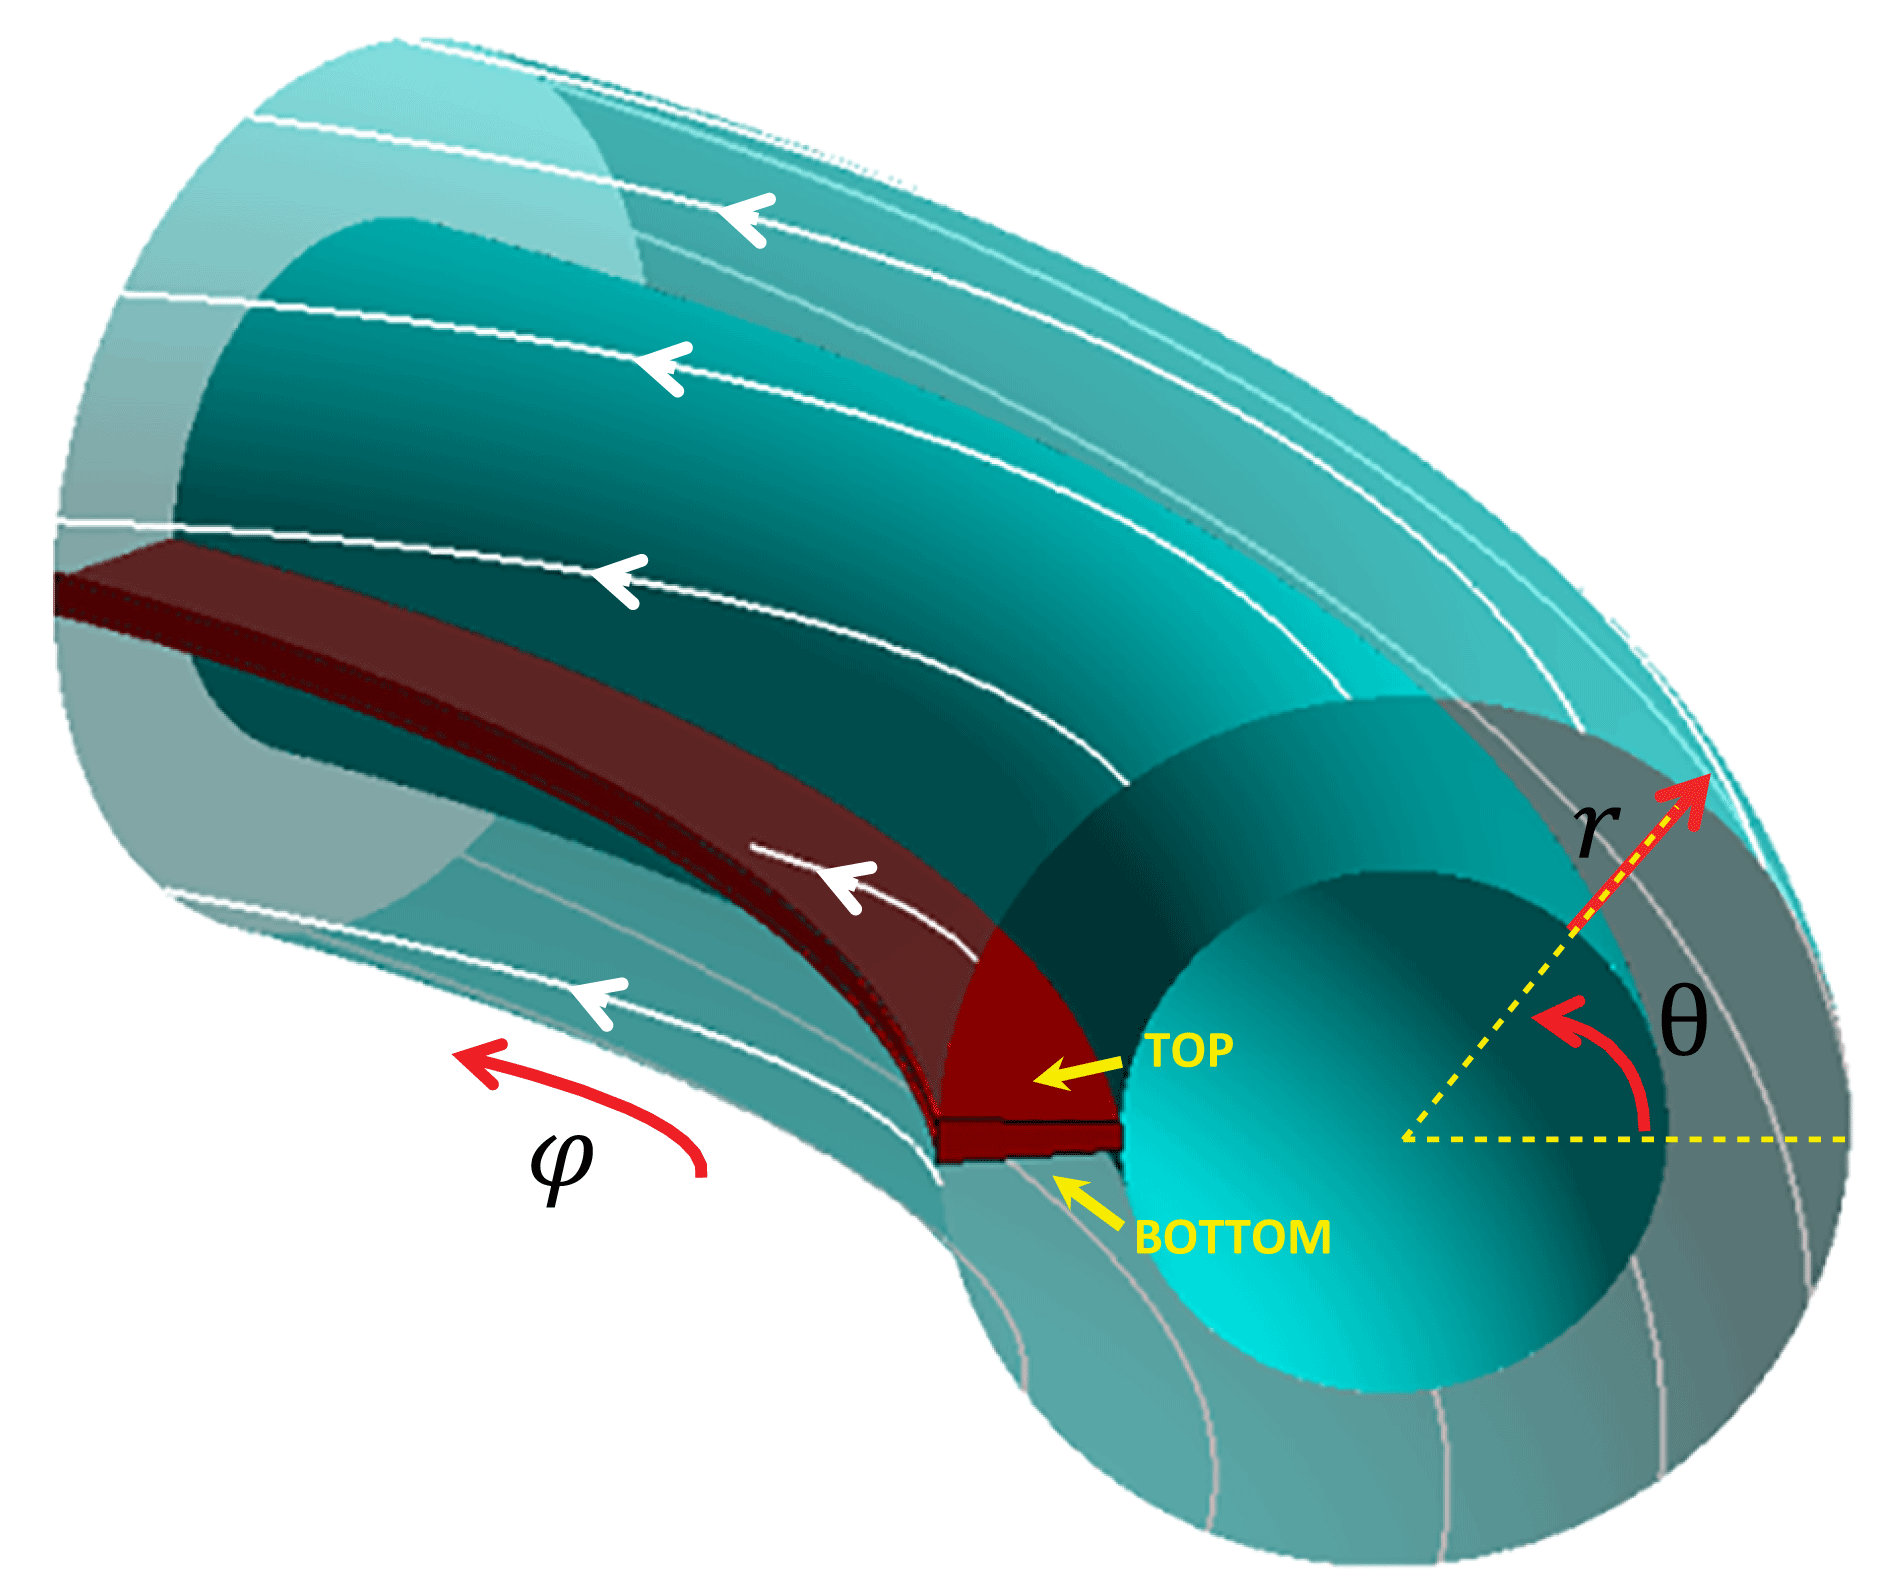
In this paper, we develop a simple but useful model to elucidate the question of how currents are circulating in the SOL of circular, limited tokamak plasmas (figure 1). The model predicts that a non-zero floating potential profile with a dipolar structure appears as a natural consequence of turbulence-driven cross-field currents, and we provide estimates for its magnitude and scale. Some of these model predictions have been recently shown to compare well with experimental measurements (Tsui et al. Reference Tsui, Boedo, Halpern, Loizu, Nespoli, Horacek, Labit, Morales, Reimerdes and Theiler2017). Here we also show that numerical simulations carried out with a fluid turbulence code lend further support to the model.
Sketch of the SOL geometry considered in this paper. The white lines indicate typical magnetic field lines connecting the two sides of a toroidal limiter located on the inboard side.
2 Theory of current closure
The fundamental equation we need to solve is the one that describes the conservation of charge in the SOL, namely
 $$\begin{eqnarray}\frac{\unicode[STIX]{x2202}\unicode[STIX]{x1D70C}}{\unicode[STIX]{x2202}t}+\unicode[STIX]{x1D735}\boldsymbol{\cdot }\boldsymbol{j}=0,\end{eqnarray}$$
where
 $\unicode[STIX]{x1D70C}$
is the charge density and
 $\boldsymbol{j}$
is the current density. We neglect here the effect of neutrals, which may restrict the validity of the model to convection-limited regimes (Stangeby Reference Stangeby2000). Also, we use the drift-reduced Braginskii theory (Zeiler, Drake & Rogers Reference Zeiler, Drake and Rogers1997), which may restrict the validity of the model to regimes in which the scale lengths are larger than the ion gyroradius; this is particularly true in L-mode plasmas. In this limit, the fluid velocities of electrons and ions are, respectively,
 $\boldsymbol{v}_{e}=v_{\Vert e}\boldsymbol{b}+\boldsymbol{v}_{E\times B}+\boldsymbol{v}_{\text{dia},e}$
and
 $\boldsymbol{v}_{i}=v_{\Vert i}\boldsymbol{b}+\boldsymbol{v}_{E\times B}+\boldsymbol{v}_{\text{dia},i}+\boldsymbol{v}_{\text{pol}}$
. Namely, the perpendicular velocity is expanded in terms of a small parameter,
 $\unicode[STIX]{x1D716}=\unicode[STIX]{x1D714}_{ci}^{-1}(\text{d}/\text{d}t)\sim \unicode[STIX]{x1D70C}_{i}^{2}/L_{\bot }^{2}\ll 1$
, so that the
 $\boldsymbol{E}\times \boldsymbol{B}$
drift and diamagnetic drifts,
 $\boldsymbol{v}_{E\times B}$
and
 $\boldsymbol{v}_{\text{dia}}$
, are the zeroth-order terms, and the lowest-order ion polarization drift,
 $$\begin{eqnarray}\boldsymbol{v}_{\text{pol}}=\frac{\boldsymbol{b}}{\unicode[STIX]{x1D714}_{ci}}\times \left(\frac{\unicode[STIX]{x2202}}{\unicode[STIX]{x2202}t}+(\boldsymbol{v}_{E\times B}+v_{\Vert i}\boldsymbol{b})\boldsymbol{\cdot }\unicode[STIX]{x1D735}\right)\boldsymbol{v}_{E\times B},\end{eqnarray}$$
is of order
 $O(\unicode[STIX]{x1D716})$
. Here
 $\unicode[STIX]{x1D714}_{ci}=eB/m_{i}$
is the ion gyrofrequency,
 $\unicode[STIX]{x1D70C}_{i}=v_{\text{thi}}/\unicode[STIX]{x1D714}_{ci}$
is the ion gyroradius,
 $v_{\text{thi}}=\sqrt{T_{i}/m_{i}}$
is the ion thermal speed,
 $L_{\bot }$
is the equilibrium perpendicular scale length and
 $\boldsymbol{b}=\boldsymbol{B}/B$
. The absence of the ion diamagnetic drift in the convective derivative is due to the so-called diamagnetic cancellation which arises from the lowest-order term in the pressure tensor, in the large-aspect-ratio limit (Ramos Reference Ramos2005). The electron polarization drift is of order
 $(m_{e}/m_{i})O(\unicode[STIX]{x1D716})$
and is neglected. Under these assumptions, equation (2.1) can be reduced to
 $$\begin{eqnarray}\langle \unicode[STIX]{x1D735}_{\Vert }\,j_{\Vert }\rangle _{t,\unicode[STIX]{x1D703}}+\langle \unicode[STIX]{x1D735}\boldsymbol{\cdot }\boldsymbol{j}_{\text{dia}}\rangle _{t,\unicode[STIX]{x1D703}}+\langle \unicode[STIX]{x1D735}\boldsymbol{\cdot }\boldsymbol{j}_{\text{pol}}\rangle _{t,\unicode[STIX]{x1D703}}=0,\end{eqnarray}$$
where
 $\langle \cdot \rangle _{t,\unicode[STIX]{x1D703}}$
represents a time average and poloidal average,
 $$\begin{eqnarray}\langle F\rangle _{t,\unicode[STIX]{x1D703}}(r)\equiv \frac{1}{2\unicode[STIX]{x03C0}}\int _{0}^{2\unicode[STIX]{x03C0}}\left[\frac{1}{T}\int _{0}^{T}F(r,\unicode[STIX]{x1D703},\unicode[STIX]{x1D711},t)\,\text{d}t\right]\text{d}\unicode[STIX]{x1D703},\end{eqnarray}$$
where
 $(r,\unicode[STIX]{x1D703},\unicode[STIX]{x1D711})$
are toroidal coordinates (figure 1) and the time interval
 $T$
is much larger than the time scale of turbulence fluctuations. Writing
 $F(r,\unicode[STIX]{x1D703},\unicode[STIX]{x1D711},t)=\langle F\rangle _{t,\unicode[STIX]{x1D703}}(r)+\tilde{F}(r,\unicode[STIX]{x1D703},\unicode[STIX]{x1D711},t)$
, we consider
 $T\gg |\tilde{F}/\unicode[STIX]{x2202}_{t}\tilde{F}|$
. We note that in deriving (2.3) we have assumed that
 $\unicode[STIX]{x1D735}\boldsymbol{\cdot }(j_{\Vert }\boldsymbol{b})=\unicode[STIX]{x1D735}_{\Vert }\,j_{\Vert }$
, or equivalently,
 $\unicode[STIX]{x1D735}\boldsymbol{\cdot }\boldsymbol{b}=0$
, which is true in the large-aspect-ratio limit.
We now estimate the three terms in the charge-balance equation (2.3), which are the divergence of the parallel, diamagnetic, and polarization currents. This will lead to an equation for the radial profile of plasma potential, thereby providing a prediction for the profile of floating potential.
2.1 Parallel term
In the absence of magnetic flutter, namely in the electrostatic limit, the time average of the divergence of the parallel current is
 $\langle \unicode[STIX]{x1D735}_{\Vert }\,j_{\Vert }\rangle _{t}=\unicode[STIX]{x1D735}_{\Vert }\langle \,j_{\Vert }\rangle _{t}$
. Assuming a circular tokamak equilibrium, we then have that
 $$\begin{eqnarray}\langle \unicode[STIX]{x1D735}_{\Vert }\,j_{\Vert }\rangle _{t,\unicode[STIX]{x1D703}}=\frac{\langle \,j_{\Vert }\rangle _{t}^{+}-\langle \,j_{\Vert }\rangle _{t}^{-}}{L_{\Vert }},\end{eqnarray}$$
where
 $L_{\Vert }=2\unicode[STIX]{x03C0}qR$
is the parallel connection length,
 $q=q(r)$
is the safety factor and
 $\langle \,j_{\Vert }\rangle _{t}^{\pm }$
is the time-averaged parallel current evaluated at both sides of the limiter, referred to as top (
 $+$
) and bottom (
 $-$
), respectively (figure 1). More precisely, these are evaluated at the entrance of the magnetic presheath (Loizu et al.
Reference Loizu, Ricci, Halpern and Jolliet2012). The parallel current density is
 $j_{\Vert }=en(v_{\Vert i}-v_{\Vert e})$
and we assume that
 $$\begin{eqnarray}\langle \,j_{\Vert }\rangle _{t}\approx e\langle n\rangle _{t}(\langle v_{\Vert i}\rangle _{t}-\langle v_{\Vert e}\rangle _{t}).\end{eqnarray}$$
In doing so, we have neglected the terms
 $\langle {\tilde{n}}\tilde{v}_{\Vert }\rangle _{t}$
with respect to the terms
 $\langle n\rangle _{t}\langle v_{\Vert }\rangle _{t}$
. This is justified since, even if fluctuations correlate perfectly, we have that
 $$\begin{eqnarray}\frac{\langle {\tilde{n}}\tilde{v}_{\Vert }\rangle _{t}}{\langle n\rangle _{t}\langle v_{\Vert }\rangle _{t}}\sim \left(\frac{{\tilde{n}}}{\langle n\rangle _{t}}\right)\left(\frac{\tilde{v}_{\Vert }}{c_{s}}\right)\ll 1\end{eqnarray}$$
because in typical SOL conditions,
 ${\tilde{n}}/\langle n\rangle _{t}\approx 0.05{-}1$
(Zweben et al.
Reference Zweben, Boedo, Grulke, Hidalgo, LaBombard, Maqueda, Scarin and Terry2007) and
 $\tilde{v}_{\Vert }/c_{s}\approx 0.1{-}0.5$
(Hidalgo et al.
Reference Hidalgo, Gonc, Silva, Pedrosa, Erents, Hron and Matthews2003). Here
 $c_{s}=\sqrt{(T_{e}+T_{i})/m_{i}}$
is the plasma sound speed. The equilibrium parallel current at the entrance of the magnetic presheath is taken as the Bohm current, namely,
 $$\begin{eqnarray}\langle \,j_{\Vert }\rangle _{t}^{\pm }=\pm e\langle n\rangle _{t}^{\pm }\langle c_{s}\rangle _{t}^{\pm }\left(1-e^{\langle \unicode[STIX]{x1D6EC}\rangle _{t}^{\pm }-(e\langle \unicode[STIX]{x1D719}\rangle _{t}^{\pm }/\langle T_{e}\rangle _{t}^{\pm })}\right),\end{eqnarray}$$
where the plasma potential,
 $\unicode[STIX]{x1D719}$
, is measured with respect to the wall potential, which is taken as the zero of the potential,
 $\unicode[STIX]{x1D719}_{wall}=0$
. The quantity
 $$\begin{eqnarray}\unicode[STIX]{x1D6EC}=\log \sqrt{\displaystyle \frac{m_{i}}{2\unicode[STIX]{x03C0}m_{e}}\frac{1}{\displaystyle 1+\frac{T_{i}}{T_{e}}}}\end{eqnarray}$$
determines the ambipolar potential, i.e.
 $\langle \,j_{\Vert }\rangle _{t}^{\pm }=0$
if and only if
 $e\langle \unicode[STIX]{x1D719}\rangle _{t}^{\pm }=\langle \unicode[STIX]{x1D6EC}\rangle _{t}^{\pm }\langle T_{e}\rangle _{t}^{\pm }$
. In principle, the sheath parallel current contains an additional term mainly due to the recirculation of the diamagnetic current (Loizu et al.
Reference Loizu, Ricci, Halpern and Jolliet2012), but this does not contribute to the outflow of charge since it is simply compensating the outflowing diamagnetic current (Cohen & Ryutov Reference Cohen and Ryutov1995). In practice, therefore, the contribution from the outflowing diamagnetic current at the sheaths shall be ignored.
2.2 Diamagnetic term
The divergence of the diamagnetic current is
 $$\begin{eqnarray}\unicode[STIX]{x1D735}\boldsymbol{\cdot }\boldsymbol{j}_{\text{dia}}=\unicode[STIX]{x1D735}p\boldsymbol{\cdot }\unicode[STIX]{x1D735}\times \left(\frac{\boldsymbol{b}}{B}\right),\end{eqnarray}$$
where
 $p=p_{e}+p_{i}$
is the total scalar plasma pressure. Assuming a large-aspect-ratio circular magnetic equilibrium, equation (2.10) reduces to
 $$\begin{eqnarray}\unicode[STIX]{x1D735}\boldsymbol{\cdot }\boldsymbol{j}_{\text{dia}}=\frac{2}{BR}\left(\cos \unicode[STIX]{x1D703}\frac{1}{r}\frac{\unicode[STIX]{x2202}p}{\unicode[STIX]{x2202}\unicode[STIX]{x1D703}}+\sin \unicode[STIX]{x1D703}\frac{\unicode[STIX]{x2202}p}{\unicode[STIX]{x2202}r}\right),\end{eqnarray}$$
where
 $R$
is the major radius of the tokamak. We now assume that
 $$\begin{eqnarray}\left\langle \cos \unicode[STIX]{x1D703}\frac{1}{r}\frac{\unicode[STIX]{x2202}p}{\unicode[STIX]{x2202}\unicode[STIX]{x1D703}}\right\rangle _{t,\unicode[STIX]{x1D703}}\approx 0\end{eqnarray}$$
and
 $$\begin{eqnarray}\left\langle \sin \unicode[STIX]{x1D703}\frac{\unicode[STIX]{x2202}p}{\unicode[STIX]{x2202}r}\right\rangle _{t,\unicode[STIX]{x1D703}}\approx -\frac{\unicode[STIX]{x1D6FF}p}{L_{p}},\end{eqnarray}$$
where
 $L_{p}=|\langle p\rangle _{t,\unicode[STIX]{x1D703}}/\unicode[STIX]{x2202}_{r}\langle p\rangle _{t,\unicode[STIX]{x1D703}}|$
is the equilibrium pressure scale length, and
 $\unicode[STIX]{x1D6FF}p=\langle p\rangle _{t}^{+}-\langle p\rangle _{t}^{-}$
measures the poloidal asymmetry in the pressure. These assumptions are justified in appendix A, based on the effects that
 $\boldsymbol{E}\times \boldsymbol{B}$
drifts and poloidally asymmetric cross-field transport have on the equilibrium pressure profile. In particular, an estimate for the pressure poloidal asymmetry is provided, showing that
 $\unicode[STIX]{x1D6FF}p/p\sim 0.1$
is expected for an inner-wall-limited plasma with ballooning-like cross-field transport. Therefore, we have that
 $$\begin{eqnarray}\langle \unicode[STIX]{x1D735}\boldsymbol{\cdot }\boldsymbol{j}_{\text{dia}}\rangle _{t,\unicode[STIX]{x1D703}}\approx -\frac{2}{\mathit{BR}}\frac{\unicode[STIX]{x1D6FF}p}{L_{p}}.\end{eqnarray}$$
2.3 Polarization term
Turbulence simulations in tokamak SOL geometry with medium-size tokamak parameters (Halpern & Ricci Reference Halpern and Ricci2017) revealed that the divergence of the polarization current is mainly due to the radially sheared convection of vorticity. Namely,
 $$\begin{eqnarray}\langle \unicode[STIX]{x1D735}\boldsymbol{\cdot }\boldsymbol{j}_{\text{pol}}\rangle _{t,\unicode[STIX]{x1D703}}\approx \frac{e\langle n\rangle _{t,\unicode[STIX]{x1D703}}}{\unicode[STIX]{x1D714}_{ci}B^{2}}\left|\frac{\unicode[STIX]{x2202}}{\unicode[STIX]{x2202}r}\left\langle \tilde{\unicode[STIX]{x1D6FA}}\frac{1}{r}\frac{\unicode[STIX]{x2202}\tilde{\unicode[STIX]{x1D719}}}{\unicode[STIX]{x2202}\unicode[STIX]{x1D703}}\right\rangle _{t,\unicode[STIX]{x1D703}}\right|,\end{eqnarray}$$
where
 $\tilde{\unicode[STIX]{x1D6FA}}=\unicode[STIX]{x1D6FB}_{\bot }^{2}\tilde{\unicode[STIX]{x1D719}}$
is the fluctuating vorticity. We now simplify this expression by making a certain number of assumptions,
 $$\begin{eqnarray}\displaystyle \langle \unicode[STIX]{x1D735}\boldsymbol{\cdot }\boldsymbol{j}_{\text{pol}}\rangle _{t,\unicode[STIX]{x1D703}} & {\approx} & \displaystyle \frac{e\langle n\rangle _{t,\unicode[STIX]{x1D703}}}{\unicode[STIX]{x1D714}_{ci}B^{2}}\left|\frac{\unicode[STIX]{x2202}}{\unicode[STIX]{x2202}r}\langle k_{\bot }^{2}k_{\unicode[STIX]{x1D703}}\tilde{\unicode[STIX]{x1D719}}^{2}\rangle _{t,\unicode[STIX]{x1D703}}\right|\nonumber\\ \displaystyle & {\approx} & \displaystyle \frac{e\langle n\rangle _{t,\unicode[STIX]{x1D703}}}{k_{\unicode[STIX]{x1D703}}\unicode[STIX]{x1D714}_{ci}}\left|\frac{\unicode[STIX]{x2202}\unicode[STIX]{x1D6FE}^{2}}{\unicode[STIX]{x2202}r}\right|\nonumber\\ \displaystyle & {\approx} & \displaystyle \frac{e\langle n\rangle _{t,\unicode[STIX]{x1D703}}}{k_{\unicode[STIX]{x1D703}}\unicode[STIX]{x1D714}_{ci}}\frac{1}{RL_{p}}\left|\frac{\unicode[STIX]{x2202}\langle c_{s}^{2}\rangle _{t,\unicode[STIX]{x1D703}}}{\unicode[STIX]{x2202}r}\right|\nonumber\\ \displaystyle & {\approx} & \displaystyle \frac{e\langle n\rangle _{t,\unicode[STIX]{x1D703}}}{k_{\unicode[STIX]{x1D703}}\unicode[STIX]{x1D714}_{ci}}\frac{\langle c_{s}\rangle _{t,\unicode[STIX]{x1D703}}^{2}}{RL_{p}L_{T}}\nonumber\\ \displaystyle & {\approx} & \displaystyle \frac{e\langle n\rangle _{t,\unicode[STIX]{x1D703}}\langle c_{s}\rangle _{t,\unicode[STIX]{x1D703}}}{k_{\unicode[STIX]{x1D703}}\langle \unicode[STIX]{x1D70C}_{s}\rangle _{t,\unicode[STIX]{x1D703}}R}\frac{2}{5}\left(\frac{\langle \unicode[STIX]{x1D70C}_{s}\rangle _{t,\unicode[STIX]{x1D703}}}{L_{p}}\right)^{2},\end{eqnarray}$$
where
 $\unicode[STIX]{x1D70C}_{s}=c_{s}/\unicode[STIX]{x1D714}_{ci}$
is the ion sound Larmor radius. Here we have assumed that the saturated amplitude of the fluctuations has magnitude
 $\langle \tilde{\unicode[STIX]{x1D719}}^{2}\rangle _{t,\unicode[STIX]{x1D703}}\sim B^{2}\unicode[STIX]{x1D6FE}^{2}/(k_{\unicode[STIX]{x1D703}}^{2}k_{r}^{2})$
, where
 $\unicode[STIX]{x1D6FE}\sim c_{s}/\sqrt{RL_{p}}$
is the linear growth rate for interchange-like modes. We have also assumed that eddies have comparable radial and poloidal wavenumbers,
 $k_{\bot }\sim k_{r}\sim k_{\unicode[STIX]{x1D703}}$
(Zweben et al.
Reference Zweben, Davis, Kaye, Myra, Bell, Leblanc, Maqueda, Munsat, Sabbagh and Sechrest2015), and have taken
 $L_{T}=(5/2)L_{p}$
for the equilibrium temperature scale length. These assumptions are based on the hypothesis that (i) resistive ballooning modes are dominant, (ii) saturation of fluctuations occurs due to the gradient removal mechanism (Ricci & Rogers Reference Ricci and Rogers2013) and (iii) there is no effect of shear flows on mode growth (which may overestimate the term). Of course, because of these assumptions a correction factor of order one may be applied in front of this term. For our purposes, however, what matters is the scaling and the order of magnitude of this term.
2.4 Overall charge balance
Bringing together the approximate expressions for each of the three terms in (2.3), dropping the bracket notation (all quantities are now averages), and dividing everything by
 $enc_{s}/(2\unicode[STIX]{x03C0}qR)$
, we get
 $$\begin{eqnarray}\displaystyle & & \displaystyle \frac{\unicode[STIX]{x1D6E4}^{+}}{\unicode[STIX]{x1D6E4}}\left(1-e^{\unicode[STIX]{x1D6EC}^{+}-(e\unicode[STIX]{x1D719}^{+}/T_{e}^{+})}\right)+\frac{\unicode[STIX]{x1D6E4}^{-}}{\unicode[STIX]{x1D6E4}}\left(1-e^{\unicode[STIX]{x1D6EC}^{-}-(e\unicode[STIX]{x1D719}^{-}/T_{e}^{-})}\right)\nonumber\\ \displaystyle & & \displaystyle \quad +\,2\unicode[STIX]{x03C0}q\left[\frac{1}{k_{\unicode[STIX]{x1D703}}\unicode[STIX]{x1D70C}_{s}}\frac{2}{5}\left(\frac{\unicode[STIX]{x1D70C}_{s}}{L_{p}}\right)^{2}-2\frac{\unicode[STIX]{x1D6FF}p}{p}\left(\frac{\unicode[STIX]{x1D70C}_{s}}{L_{p}}\right)\right]\approx 0,\end{eqnarray}$$
where
 $\unicode[STIX]{x1D6E4}=nc_{s}$
and
 $\unicode[STIX]{x1D6E4}^{\pm }=n^{\pm }c_{s}^{\pm }$
. The validity of (2.17) is verified with turbulence simulations in § 3. We now further simplify this expression in order to derive a simple expression for the floating potential. In the limit of a sheath-limited regime (Stangeby Reference Stangeby2000), in which we can assume that
 $\unicode[STIX]{x1D6E4}^{\pm }\approx \unicode[STIX]{x1D6E4}/2$
,
 $\unicode[STIX]{x1D6EC}^{\pm }\approx \unicode[STIX]{x1D6EC}$
and
 $\unicode[STIX]{x1D719}^{\pm }/T_{e}^{\pm }\approx \unicode[STIX]{x1D719}/T_{e}$
, equation (2.17) reduces to
 $$\begin{eqnarray}1-e^{-V_{f}/T_{e}}+2\unicode[STIX]{x03C0}q\left[\frac{1}{k_{\unicode[STIX]{x1D703}}\unicode[STIX]{x1D70C}_{s}}\frac{2}{5}\left(\frac{\unicode[STIX]{x1D70C}_{s}}{L_{p}}\right)^{2}-2\frac{\unicode[STIX]{x1D6FF}p}{p}\left(\frac{\unicode[STIX]{x1D70C}_{s}}{L_{p}}\right)\right]\approx 0,\end{eqnarray}$$
where
 $V_{f}=e\unicode[STIX]{x1D719}-\unicode[STIX]{x1D6EC}T_{e}$
is the floating potential. Solving for
 $V_{f}$
, we have that
 $$\begin{eqnarray}V_{f}\approx -T_{e}\ln (1+\unicode[STIX]{x1D6E5}),\end{eqnarray}$$
with
 $$\begin{eqnarray}\unicode[STIX]{x1D6E5}=2\unicode[STIX]{x03C0}q\left[\frac{1}{k_{\unicode[STIX]{x1D703}}\unicode[STIX]{x1D70C}_{s}}\frac{2}{5}\left(\frac{\unicode[STIX]{x1D70C}_{s}}{L_{p}}\right)^{2}-2\frac{\unicode[STIX]{x1D6FF}p}{p}\left(\frac{\unicode[STIX]{x1D70C}_{s}}{L_{p}}\right)\right].\end{eqnarray}$$
Schematic view of the current circulation in the SOL.

The function
 $\unicode[STIX]{x1D6E5}$
determines whether there are electron currents to the sheath (
 $\unicode[STIX]{x1D6E5}>0$
), no sheath currents (
 $\unicode[STIX]{x1D6E5}=0$
) or ion currents to the sheath (
 $\unicode[STIX]{x1D6E5}<0$
). Here
 $L_{p}$
and
 $\unicode[STIX]{x1D6FF}p/p$
are seen as functions of the radius,
 $r$
, and so
 $\unicode[STIX]{x1D6E5}=\unicode[STIX]{x1D6E5}(r)$
. The first term in (2.20) is the polarization current contribution due to turbulent fluctuations, and the second term is the diamagnetic current contribution, which is only non-zero due to finite magnetic curvature and gradients, and whose poloidal average does not vanish when pressure asymmetries are present. In appendix A, we estimate that typically
 $\unicode[STIX]{x1D6FF}p/p\sim 0.1$
is expected in inner-wall-limited plasmas with ballooning-like cross-field transport. These numbers are also confirmed in SOL turbulence simulations (see § 3). Also, we typically expect
 $k_{\unicode[STIX]{x1D703}}\unicode[STIX]{x1D70C}_{s}\sim 0.1$
(Mosetto et al.
Reference Mosetto, Halpern, Jolliet, Loizu and Ricci2013). We can thus estimate the ratio of the two terms in (2.20) as
 $\unicode[STIX]{x1D6E5}_{\text{pol}}/\unicode[STIX]{x1D6E5}_{\text{dia}}\sim 20\unicode[STIX]{x1D70C}_{s}/L_{p}$
. In the near SOL,
 $L_{p}$
is of the order of a few millimetres (Tsui et al.
Reference Tsui, Boedo, Halpern, Loizu, Nespoli, Horacek, Labit, Morales, Reimerdes and Theiler2017), thus
 $\unicode[STIX]{x1D6E5}_{\text{pol}}>\unicode[STIX]{x1D6E5}_{\text{dia}}$
; while it becomes of the order of a few centimetres in the far SOL, and thus
 $\unicode[STIX]{x1D6E5}_{\text{pol}}<\unicode[STIX]{x1D6E5}_{\text{dia}}$
. Hence we expect that
 $\unicode[STIX]{x1D6E5}>0$
in the near SOL and
 $\unicode[STIX]{x1D6E5}<0$
in the far SOL.
The picture of how currents circulate in the SOL emerges as follows (figure 2). Radially increasing polarization currents push ions radially outward in the near SOL; the sheath must then evacuate electrons to compensate the loss of charge (
 $V_{f}<0$
, region I in figure 2). As
 $L_{p}$
becomes larger, the increase in polarization current is reduced; also, pressure asymmetries may have built up and produce diamagnetic currents that push electrons radially outward; the sheath is then relieved from the task of compensating (
 $V_{f}\approx 0$
,
 $r=r_{1}$
in figure 2). The polarization contribution,
 $\unicode[STIX]{x1D6E5}_{\text{pol}}\sim (\unicode[STIX]{x1D70C}_{s}/L_{p})^{2}$
, dies out faster than the diamagnetic contribution,
 $\unicode[STIX]{x1D6E5}_{\text{dia}}\sim (\unicode[STIX]{x1D70C}_{s}/L_{p})$
, thus leading to an effective outward push of negative charge; the sheath must now evacuate ions to compensate (
 $V_{f}>0$
, region II in figure 2). Finally, both contributions cancel each other once again because the divergence of each current dies away (
 $V_{f}\approx 0$
,
 $r=r_{2}$
in figure 2).
Charge-balance terms computed from the different contributions in (2.17) and using the equilibrium quantities obtained from GBS simulations with
 $\unicode[STIX]{x1D70F}=0$
. The vertical violet stripe indicates the extent of the density and heat source in the simulations. From (2.17), the dashed-blue curve is expected to approximately balance the solid blue line.

Same as figure 3 but with
 $\unicode[STIX]{x1D70F}=2$
.

3 SOL turbulence simulations
The Global Braginskii Solver, or GBS (Ricci et al.
Reference Ricci, Halpern, Jolliet, Loizu, Mosetto, Fasoli, Furno and Theiler2012; Halpern et al.
Reference Halpern, Ricci, Jolliet, Loizu, Morales, Mosetto, Musil, Riva, Tran and Wersal2016), is used to simulate the SOL electrostatic turbulence in an inner-wall-limited tokamak plasma configuration of relatively small size,
 $R/\unicode[STIX]{x1D70C}_{s}=500$
; aspect ratio
 $R/a=4$
; normalized plasma resistivity
 $\unicode[STIX]{x1D708}=e^{2}n_{e}c_{s}/(m_{i}\unicode[STIX]{x1D70E}_{\Vert }R)=0.1$
, where
 $\unicode[STIX]{x1D70E}_{\Vert }$
is the Spitzer conductivity; mass ratio
 $m_{i}/m_{e}=200$
; safety factor
 $q=4$
; and only with an open-field-line region. The Boussinesq approximation is relaxed to ensure an accurate conservation of charge (Halpern et al.
Reference Halpern, Ricci, Jolliet, Loizu, Morales, Mosetto, Musil, Riva, Tran and Wersal2016) and a complete set of boundary conditions at the magnetic presheath entrance is used (Loizu et al.
Reference Loizu, Ricci, Halpern and Jolliet2012). The effect of finite ion temperature is captured (Mosetto et al.
Reference Mosetto, Halpern, Jolliet, Loizu and Ricci2015) and controlled by the dimensionless parameter
 $\unicode[STIX]{x1D70F}=T_{i}/T_{e}$
.
We consider two cases: cold ions (
 $\unicode[STIX]{x1D70F}=0$
) and warm ions (
 $\unicode[STIX]{x1D70F}=2$
). For each case, we check the validity of the approximate charge-balance equation derived in § 2, namely (2.17), by comparing the three terms corresponding to the parallel, diamagnetic, and polarization contributions, expressed analytically as a function of equilibrium quantities. Figures 3 and 4 show these different contributions as a function of the radial coordinate in the SOL. We observe that the three terms balance each other relatively well, especially in the
 $\unicode[STIX]{x1D70F}=2$
case. In both cases, the parallel term is balanced first by the polarization term (near SOL), and then by the diamagnetic term (far SOL). The maximum of the pressure asymmetry,
 $\unicode[STIX]{x1D6FF}p/p$
, is
 ${\approx}0.1$
for the
 $\unicode[STIX]{x1D70F}=0$
case and
 ${\approx}0.25$
for the
 $\unicode[STIX]{x1D70F}=2$
case. This is in agreement with the magnitude and sign estimated in the appendix A. We note that the imperfect balance of the three terms in figures 3 and 4 is mainly due to the approximations made in deriving (2.8), (2.13) and (2.16), i.e. the balance given by (2.3) is excellent in the GBS simulations, as pointed out in Halpern & Ricci (Reference Halpern and Ricci2017).
The validity of (2.18), or equivalently, the predicted profile of floating potential, equation (2.19), relies on the assumption that
 $V_{f}$
is the same on both sides of the limiter. Figures 5 and 6 show that this is not exactly true in the simulations, especially in the
 $\unicode[STIX]{x1D70F}=0$
case. Nevertheless, the predicted profile of
 $V_{f}(r)$
does lie in between
 $V_{f}^{+}(r)$
and
 $V_{f}^{-}(r)$
, and shows a dipolar structure. This structure is in agreement with the picture of current circulation proposed in § 2.
We would like to note that in both figures 4 and 6 the parallel current and the floating potential at the sheaths seem to diverge in the ‘far far SOL’, namely as the outer radial boundary is approached. This is due to the lack of appropriate radial boundary conditions for the density and the ion temperature. This feature could be removed by reducing the values of
 $n$
and
 $T_{i}$
at the right boundary or by considering a larger radial domain in order to reduce the effect of the boundary. Since this behaviour is present only in the ‘far far SOL’, it does not affect much the results in the near and far SOL, and we shall ignore it for the purpose of this investigation.
Radial profile of floating potential obtained from GBS (black curves) and from the model (blue curve), equation (2.19), for the case
 $\unicode[STIX]{x1D70F}=0$
. The vertical violet stripe indicates the extent of the density and heat source in the simulations.

Same as figure 5 but with
 $\unicode[STIX]{x1D70F}=2$
.

4 Discussion and conclusions
The theory of current circulation developed herein is consistent with turbulence simulations but the floating potential cannot be assumed to be poloidally symmetric. Improving the predictions for
 $V_{f}(r)$
may require a more detailed study of poloidal asymmetries in the SOL, for example by coupling the charge-conservation equation with a generalized Ohm’s law (Loizu et al.
Reference Loizu, Ricci, Halpern, Jolliet and Mosetto2013, Reference Loizu, Ricci, Halpern, Jolliet and Mosetto2014). Nevertheless, the model presented here predicts that a ‘
 $V_{f}$
-hump’ appears as a consequence of two competing non-divergence-free cross-field currents, namely (i) turbulence-driven polarization currents and (ii) poloidally asymmetric diamagnetic currents. A relatively simple expression for
 $V_{f}(r)$
, equation (2.19), has been derived that could be used for the interpretation of experimental measurements.
The dependence of the amplitude of this hump,
 $V_{f}^{\text{ LCFS}}\equiv \max |V_{f}(r)|$
, on the dimensionless parameter
 $\unicode[STIX]{x1D708}_{\text{SOL}}^{\ast }$
was recently measured and shown to be consistent with the predictions of the model (Tsui et al.
Reference Tsui, Boedo, Halpern, Loizu, Nespoli, Horacek, Labit, Morales, Reimerdes and Theiler2017). Experimentally, the value of
 $\unicode[STIX]{x1D708}_{\text{SOL}}^{\ast }$
was varied by scanning
 $I_{p}$
, namely the toroidal plasma current. The ‘
 $V_{f}$
-hump’ was only observed for values of
 $I_{p}$
above a certain threshold (
 $I_{p}\sim 90~\text{kA}$
), with an amplitude that increases linearly with
 $I_{p}$
. All these features were reproduced by the model described herein (see figure 11 of Tsui et al.
Reference Tsui, Boedo, Halpern, Loizu, Nespoli, Horacek, Labit, Morales, Reimerdes and Theiler2017). We would like to remark that while
 $I_{p}$
does not appear explicitly in the model prediction, equation (2.19), the value of
 $I_{p}$
significantly modifies the equilibrium electron temperature profile,
 $T_{e}(r)$
, in the SOL, thereby altering the values of
 $\unicode[STIX]{x1D70C}_{s}/L_{p}$
appearing in the model. For low values of toroidal plasma current (e.g.
 $I_{p}<90~\text{kA}$
), the temperature profile is very flat, thus
 $\unicode[STIX]{x1D70C}_{s}/L_{p}\approx 0$
and hence from (2.19) one expects
 $V_{f}^{\text{LCFS}}/T_{e}\ll 1$
. For large values of
 $I_{p}$
, however, the temperature profile becomes steeper,
 $\unicode[STIX]{x1D70C}_{s}/L_{p}$
increases, and thus the expected value of
 $V_{f}^{\text{LCFS}}$
increases. As a matter of fact, we can estimate how
 $V_{f}^{\text{LCFS}}$
is expected to scale with
 $I_{p}$
. Assuming that
 $\unicode[STIX]{x1D6E5}\ll 1$
in (2.19) and that
 $k_{\unicode[STIX]{x1D703}}\unicode[STIX]{x1D70C}_{s}$
remains constant, we obtain the scaling
 $V_{f}^{\text{LCFS}}/T_{e}\sim q(\unicode[STIX]{x1D70C}_{s}/L_{p})^{2}$
. Since the near-SOL width has been shown to scale roughly as
 $L_{p}/\unicode[STIX]{x1D70C}_{s}\sim q$
(Halpern & Ricci Reference Halpern and Ricci2017), we expect that
 $V_{f}^{\text{LCFS}}/T_{e}\sim q^{-1}\sim I_{p}$
, namely a linear scaling with toroidal plasma current.
This paper provides a first detailed look at how currents circulate and close in the SOL and proposes a simple expression for the radial profile of the floating potential. Furthermore, this work may guide future investigations seeking to develop a more detailed understanding of the formation of the narrow heat-flux feature as well as that of a poloidally asymmetric floating potential profile.
Acknowledgements
We acknowledge useful discussions with C. Tsui, J. Boedo, C. Wersal and F. Riva. This work has been partly carried out in the framework of the EUROfusion Consortium and has received funding from the Euratom research and training programme 2014–2018 under grant agreement no. 633053. The views and opinions expressed herein do not necessarily reflect those of the European Commission. The material in this paper is also partly based upon work supported by the US Department of Energy, Office of Science, Office of Fusion Energy Sciences, Theory Program, under Award no. DE-FG02-95ER54309. Part of this work was carried out using HELIOS supercomputer system (IFERC-CSC).
Appendix A
Here we estimate the effect of poloidal drifts (in general both
 $\boldsymbol{E}\times \boldsymbol{B}$
and diamagnetic) on the pressure poloidal profile. This allows estimating the integrals present in (2.12) and (2.13) and more generally provides an estimate for the expected pressure poloidal asymmetry. First, we derive the equilibrium density poloidal profile resulting from different possible combinations of plasma sources and poloidal drifts.
The ion continuity equation in a flux tube can be written as
 $$\begin{eqnarray}\frac{\unicode[STIX]{x2202}}{\unicode[STIX]{x2202}y}(nV_{y})=S_{p},\end{eqnarray}$$
where
 $y=r\unicode[STIX]{x1D703}$
is the poloidal coordinate,
 $V_{y}$
is the ion poloidal velocity (which is the sum of the projected parallel velocity and the poloidal drifts) and
 $S_{p}$
is the plasma volumetric source in the flux tube, which is for example determined by the divergence of the turbulent cross-field transport. This leads to
 $$\begin{eqnarray}n(y)=\frac{\displaystyle \int _{y_{0}}^{y}S_{p}(y^{\prime })\,\text{d}y^{\prime }}{V_{y}(y)},\end{eqnarray}$$
where
 $y_{0}$
is the location at which
 $V_{y}(y_{0})=0$
. We consider four cases:
-
(i)
 $S_{p}=S_{0}$
and
$V_{y}=(2\unicode[STIX]{x1D6FC}c_{s}/L)y$
;
-
(ii)
$S_{p}=S_{0}$
and
$V_{y}=(2\unicode[STIX]{x1D6FC}c_{s}/L)y+v_{D}$
; -
(iii)
$S_{p}=S_{0}(1-y^{2}/l^{2})$
and
$V_{y}=(2\unicode[STIX]{x1D6FC}c_{s}/L)y$
; -
(iv)
$S_{p}=S_{0}(1-y^{2}/l^{2})$
and
$V_{y}=(2\unicode[STIX]{x1D6FC}c_{s}/L)y+v_{D}$
.







Here
 $L=2\unicode[STIX]{x03C0}r$
is the poloidal extent,
 $y\in (-y_{m},y_{m})$
,
 $y_{m}=L/2$
,
 $\unicode[STIX]{x1D6FC}$
is the pitch angle of the magnetic field,
 $v_{D}$
is the sum of poloidal drifts (which is assumed constant) and
 $l\gtrsim L$
is the scale length of variation of the source, which mimics a ‘ballooning-like’ transport with maximum amplitude half-way between the two targets. Cases (iii) and (iv) are thus implicitly assuming an inner-wall-limited plasma with outboard-dominant transport. Cases (i) and (ii) assume a constant plasma source. Cases (ii) and (iv) assume a finite poloidal drift.
For the case (i),
 $y_{0}=0$
and (A 2) implies a constant density profile,
 $$\begin{eqnarray}n(y)=\frac{S_{0}L}{2\unicode[STIX]{x1D6FC}c_{s}}\equiv n_{0}.\end{eqnarray}$$
For the case (ii),
 $y_{0}=-v_{D}L/(2\unicode[STIX]{x1D6FC}c_{s})$
and we still get
 $n(y)=n_{0}$
. This implies that a constant poloidal drift alone does not produce an asymmetry in the density.
For the case (iii),
 $y_{0}=0$
and we get
 $$\begin{eqnarray}n(y)=n_{0}\frac{\displaystyle \int _{0}^{y}(1-{y^{\prime }}^{2}/l^{2})\,\text{d}y^{\prime }}{y}=n_{0}\left(1-\frac{y^{2}}{3l^{2}}\right),\end{eqnarray}$$
which is still poloidally symmetric.
For the case (iv),
 $y_{0}=-v_{D}L/(2\unicode[STIX]{x1D6FC}c_{s})$
and we get
 $$\begin{eqnarray}n(y)=n_{0}\frac{\displaystyle \int _{y_{0}}^{y}(1-{y^{\prime }}^{2}/l^{2})\,\text{d}y^{\prime }}{y-y_{0}}=n_{0}\left(1-\frac{1}{3l^{2}}(y^{2}+yy_{0}+y_{0}^{2})\right).\end{eqnarray}$$
Therefore there is only a density asymmetry, equation (A 5), if the poloidal flow is asymmetric and the source is not constant. We can now estimate the density asymmetry,
 $$\begin{eqnarray}\frac{\unicode[STIX]{x1D6FF}n}{n}\equiv \frac{n^{+}-n^{-}}{n_{0}}=-\frac{2y_{0}y_{m}}{3l^{2}}=\frac{1}{6}\frac{v_{D}}{\unicode[STIX]{x1D6FC}c_{s}}\left(\frac{L}{l}\right)^{2},\end{eqnarray}$$
which is non-zero if and only if
 $v_{D}\neq 0$
and
 $l<\infty$
. Typically, we have
 $v_{D}\lesssim \unicode[STIX]{x1D6FC}c_{s}$
and
 $l\sim L$
, thus
 $\unicode[STIX]{x1D6FF}n/n\lesssim 1/6$
, or
 $$\begin{eqnarray}\frac{\unicode[STIX]{x1D6FF}n}{n}\sim 0.1.\end{eqnarray}$$
A similar exercise should be repeated for the ion and electron temperatures in order to combine the results and estimate the total pressure profile,
 $p(y)=n(y)T(y)$
, and the pressure asymmetry,
 $$\begin{eqnarray}\frac{\unicode[STIX]{x1D6FF}p}{p}=\frac{\unicode[STIX]{x1D6FF}n}{n}\frac{T^{+}}{T_{0}}+\frac{\unicode[STIX]{x1D6FF}T}{T}\frac{n^{-}}{n_{0}}\approx \frac{\unicode[STIX]{x1D6FF}n}{n}+\frac{\unicode[STIX]{x1D6FF}T}{T},\end{eqnarray}$$
where
 $T=T_{e}+T_{i}$
. While the ion and electron equilibrium temperature profiles can exhibit different poloidal asymmetries (Zhu, Francisquez & Rogers Reference Zhu, Francisquez and Rogers2017), for example due to the different heat conduction coefficients, the total pressure usually shows an equilibrium profile similar to that depicted in (A 5). If we are only interested in providing an estimate for the order of magnitude of the pressure asymmetry, we may simply assume
 $\unicode[STIX]{x1D6FF}T/T\sim \unicode[STIX]{x1D6FF}n/n$
, and hence
 $\unicode[STIX]{x1D6FF}p/p\sim 0.1$
. Moreover, if the form of
 $p(y)$
resembles that of
 $n(y)$
, (A 5), then the fact that
 $$\begin{eqnarray}\frac{1}{2y_{m}}\int _{-y_{m}}^{y_{m}}\cos \left(\frac{y\unicode[STIX]{x03C0}}{y_{m}}\right)\frac{\unicode[STIX]{x2202}n(y)}{\unicode[STIX]{x2202}y}\,\text{d}y=0\end{eqnarray}$$
lends support to (2.12). Similarly, the fact that
 $$\begin{eqnarray}\frac{1}{2y_{m}}\int _{-y_{m}}^{y_{m}}\sin \left(\frac{y\unicode[STIX]{x03C0}}{y_{m}}\right)~n(y)\,\text{d}y=-n_{0}\frac{y_{m}y_{0}}{3\unicode[STIX]{x03C0}l^{2}}=n_{0}\frac{1}{12\unicode[STIX]{x03C0}}\frac{v_{D}}{\unicode[STIX]{x1D6FC}c_{s}}\left(\frac{L}{l}\right)^{2}\sim \unicode[STIX]{x1D6FF}n\end{eqnarray}$$
lends support to (2.13).



