I. INTRODUCTION
In recent years, three-dimensional (3D) microstructural datasets, experimentally measured from real material systems, have become available for image-based analysis and simulation of a variety of phenomena, including grain growth, phase transformations, and mechanical response.Reference Aretz, Luce, Wolske, Kopp, Gordeler, Pomana and Gottstein1–Reference Zhang, Godfrey, Liu, Liu and Juul Jensen23 With sufficiently large 3D datasets, statistically significant structure–property correlations can also be extracted from simulations of microstructural response. In the case of mechanical properties, simulated loads may be applied to reconstructed 3D microstructures and the resulting local spatial distribution of stresses and strains can be determined.Reference Cailletaud, Forest, Jeulin, Feyel, Galliet, Mounoury and Quilici5, Reference Lewis, Qidwai and Geltmacher14, Reference Qidwai, Lewis and Geltmacher16, Reference Barbe, Decker, Jeulin and Cailletaud24 These techniques allow for the analysis of critical microstructural features that produce high stress and strain values and thus may initiate local plasticity or failure that are particularly valuable for material design.
To simulate accurately the mechanical response of polycrystalline materials at both local and global scales, suitable representative volumes with statistical significance, as well as appropriate constitutive models of crystal plasticity, are required that account for materials’ crystallography. For most polycrystalline materials, however, the optimal size of the representative volume element (RVE) required to achieve statistical significance for a specific local property under consideration, or even an effective property on a global scale, is computationally prohibitive. Similarly, even for simple crystal plasticity models such as that of Asaro,Reference Asaro25 accounting for plastic strain owing to slip on known slip systems in the material can be cost-prohibitive for large models. For example, in BCC materials, slip can occur on 48 different slip systems and accounting for plastic strain on each system in each grain in a microstructure can lead to enormous data accumulation for even small strain simulations.
Although large amounts of data can make analysis difficult or time-consuming, storage and mining techniques specifically tailored for material analysis are under development, which could alleviate much of the inconvenience.Reference Ortiz, Eriksson and Klintenberg26–Reference Sundararaghavan and Zabaras29 Currently, the amount of memory and time required to process the simulations on large microstructural models is more limiting than the size of data resulting from simulations. For example, even with the advantage of supercomputing facilities, simulations of mechanical response of an image-based model (i.e., a model in which the input was derived directly from the measured micrographs or other images) with 500,000–700,000 degrees of freedom [∼200,000 linear brick finite elements (FEs)] can take as much as 1500–2500 CPU·h (or CPH, i.e., number of CPU times the number of computation hours) with ∼2 GB of random access memory/CPU.Reference Lewis, Qidwai and Geltmacher14 (There is a range in CPH values due to varying boundary constraints affecting the overall number of degrees of freedom and the choice of input/output size and frequency.) As a result of these computational issues, image-based simulations of mechanical response of reconstructed 3D microstructures with full-scale crystal plasticity are effectively limited to a few million degrees of freedom.
One method to reduce the model size while maintaining a statistically relevant (usually very large) number of grains is to reduce the resolution of the reconstructed model—that is, to sample every nth voxel, creating a lower-resolution volume with the same dimensions but fewer voxels (and therefore fewer elements) for simulation.Reference Qidwai, Lewis and Geltmacher16 Although this approach does allow for simulation of large numbers of grains, caution must be exercised to avoid undesirable effects, such as low fidelity of important morphological features (e.g., grain morphology and grain boundary curvature). Computation times and memory requirements can also be lowered by reducing the number of parameters in a constitutive model, for example, by considering only 24 of the 48 possible slip systems in a BCC material.Reference Lewis, Qidwai and Geltmacher14, Reference Carpay, Chin, Mahajan and Rubin30, Reference Orlans-Joliet, Bacroix, Montheillet, Driver and Jonas31 However, as shown elsewhere,Reference Chawla, Ganesh and Wunsch7 these approximations should be used only for limited phenomena and extent of loading. The ideal situation, therefore, is to maintain model fidelity and simulate a large number of grains. This is particularly true when determining microstructure–property correlations in polycrystalline materials, as a number of crystallographic, morphological, and geometric factors may combine to affect mechanical response at particular microstructural features. High model fidelity is required to analyze the properties of these features of interest, and a statistically significant number of grains or features is required to determine if a correlation exists in the microstructure.
The aforementioned issues can essentially be resolved if suitable representations can be produced through a combination of multiple small sub-volumes rather than a single, large RVE. This was recently proposed by Kalidindi et al. for two-phase composites.Reference Fullwood, Niezgoda, Adams and Kalidindi32 Their particular approach allows for the calculation of the global bulk response using statistical weight-averaging of the individual global responses of a number of smaller sub-volumes. More precisely, a predetermined number of small sub-volumes are selected from a large reconstructed volume. Two-point statistical correlation methods are then used to calculate associated weights for each sub-volume to reproduce a specific microstructural variable, such as crystallographic texture. The advantage of this method is that statistical significance can be attained by running multiple models having the same manageable model size as those currently being used, without need for additional computational resources or for altering the underlying architectures.
While the current work does not use 2-point statistical correlations for selection and weighting of the sub-volumes, the concept of selecting and analyzing multiple sub-volumes from the larger volume has been applied. For analysis parameters or structure–property correlations that rely solely on local neighborhood interactions and geometries and not on any long-range dependencies, it is possible to combine data from multiple simulations to extract useful observations. For example, to investigate the potential correlation between grain size and mechanical response, sampling of a large number of grains with a broad distribution of sizes is required. This can be accomplished by simulating an appropriate number of smaller volumes enough to achieve statistical significance and by plotting the relevant mechanical data to determine a correlation or a trend. Another example is the case of grain crystallography and mechanical response; to determine a general relationship between the two, it is useful to sample a wide variety of grain orientations. A broad distribution of orientations might not be representative of a particular specimen (e.g., a textured specimen), but if a trend exists relating crystallography to response, it is most useful to investigate as many crystallographic orientations as possible.
In this work, we demonstrate the utility of extracting subsets from large microstructural datasets to determine structure–property correlations through property simulation. Image-based FE simulations are used to investigate correlations between grain crystallography and effective stress under various mechanical loads in a polycrystalline BCC β-titanium alloy. A large number of grains were sampled from the full 3D reconstructed volume by selecting smaller sub-volumes for parallel simulations. We demonstrate that this technique for data selection and simulation is quite useful in determining structure–property correlations, particularly between crystallographic orientation and mechanical behavior at small strains.
II. METHODS
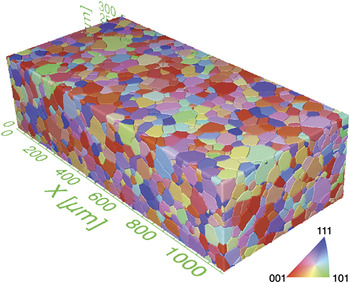
The microstructure investigated in this work is a 3D reconstruction of a β-stabilized polycrystalline titanium alloy, Ti-21S. The 3D data was collected using serial sectioning by optical microscopy, with electron backscatter diffraction (EBSD) mapping used to determine crystallography every tenth section. The details of the serial sectioning procedure for this microstructure have been given previously.Reference Spanos, Rowenhorst, Lewis and Geltmacher20, Reference Rowenhorst, Lewis and Spanos33 The reconstructed volume consists of ∼4300 individual grains and measures ∼1.2 × 0.6 × 0.3 mm3. The dataset consists of a volume of 1670 × 770 × 200 voxels, each of which is given a unique grain identifier. For each grain, an averaged crystallographic orientation was determined from values measured using EBSD. Collecting and arranging the data in this fashion allows for the direct analysis of a number of parameters, such as grain shape and morphology, texture, misorientations, and number of neighbors. Additionally, microstructural analysis and quantification tools have been developed to extract the full five-parameter definition of each individual grain boundary and grain boundary curvatures. Figure 1 shows the 3D reconstructed volume.
Three-dimensional (3D) reconstruction of polycrystalline β-Ti microstructure containing ∼4300 grains.Reference Rowenhorst, Lewis and Spanos33 Each grain is colored according to the crystallographic axis aligned with the z-direction.

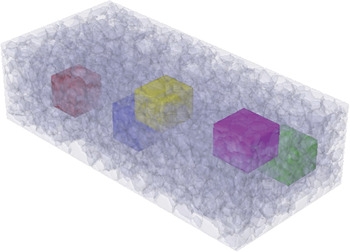
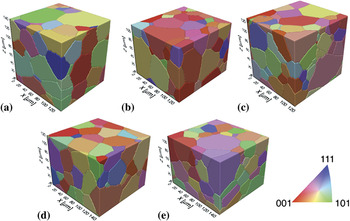
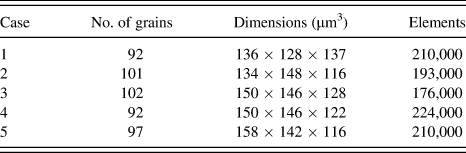
In previous simulations on this material microstructure,Reference Lewis, Qidwai and Geltmacher14, Reference Qidwai, Lewis and Geltmacher16, Reference Spanos, Rowenhorst, Lewis and Geltmacher20 sub-volumes from the larger reconstructed volume containing ∼100 grains were found to be of convenient size in balancing computation speeds and depth of information. In this work, five sub-volumes, containing ∼100 grains each, were selected at random from the larger reconstructed volume with the goal of capturing as many individual grains as possible. Figure 2 shows the volume illustrated in Fig. 1 (shown partially transparent for illustration purposes), with the five sub-volumes highlighted in different colors. The dimensions and number of grains in each sub-volume are listed in Table I. It should be noted that the volumes used for simulation were of a lower resolution than the original reconstructed volume; they were created by sampling every third voxel in the x- and y-directions and every second voxel in the z-direction of the full-resolution dataset. Figure 3 shows the five reconstructed sub-volumes individually, with each grain colored according to the crystallographic direction aligned with the global x-axis (as labeled in the figure).
Partially transparent β-Ti microstructure, showing the location of five randomly selected sub-volumes.

3D reconstructions of the five sub-volumes analyzed. Grains are colored according to the crystallographic direction aligned with the global x-direction.

Sub-volume dimensions
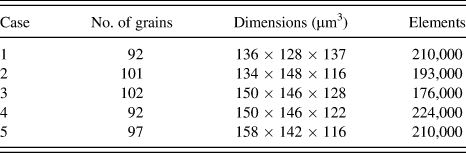
FE meshes were generated directly from the reconstructed 3D volumes by creating one brick element (ABAQUS designation: C3D8) for each voxel in the volume. This procedure was described in detail in previous work.Reference Lewis and Geltmacher34, Reference Lewis, Jordan and Geltmacher35 For these simulations, the input dataset consists of a 3D array, reconstructed from optical micrographs and EBSD data from serial sectioning experiments, representing the microstructure. Each element of the array (or voxel in the 3D reconstruction) is labeled with a unique grain identifier. Each voxel in the reconstruction corresponds to one element in the FE mesh. The number of elements for each sub-volume is also shown in Table I. The mechanical response is simulated using the single crystal plasticity constitutive modelReference Asaro25, Reference Asaro, Hutchinson and Wu36 implemented in the UMAT facility of the ABAQUS software.Reference Huang37 Each of the five sub-volumes was subjected to uniaxial tension in the three global directions (x, y, z) and biaxial tension in the xy-, xz-, and yz-planes. The details of the constitutive model, its implementation, and the boundary conditions for these loading cases are described elsewhere.Reference Qidwai, Lewis and Geltmacher16 The typical computational cost was ∼1500 CPH for the tensile loading cases to ∼2600 CPH for the biaxial tension.
In each simulation, the model was loaded to an effective strain of 2.5%, where the effective strain is defined as ε eff = [(4/3)((ε 1 − ε 2)2 + (ε 2 − ε 3)2 + (ε 1 − ε 3)2)]1/2, where ε 1, ε 2, and ε 3 are the nominal principal strains on the global scale. At each increment in the simulation, variables of interest were calculated at each integration point and interpolated to the centroid of the relevant element. By arranging the data in this way, mechanical response can be correlated directly to the microstructural features for each voxel (as the center of each voxel corresponds to the centroid of each brick element). Although the full stress and strain tensors were available for analysis, two representative scalars were selected for ease of handling and interpretation of the data.Reference Qidwai, Lewis and Geltmacher16 These were the cumulative shear strain (summation of slip, regardless of direction, from all 48 slip systems) and effective (von Mises) stress.
Correlations between mechanical response and microstructure were investigated by computational analysis of the FE simulation results in conjunction with the microstructural analysis of reconstructed volumes. The minimum, mean, and maximum values of effective stress and cumulative shear strain were determined for each grain by isolating the voxels/elements for each individual grain. To avoid consideration of artifacts from the edges of the simulation volume (i.e., boundary effects), the outer 10% of the data points were disregarded (e.g., for a simulation volume comprising 100 × 100 × 100 voxels, the interior volume of 80 × 80 × 80 voxels were considered in the microstructural analysis). The amount of edge material to disregard was chosen based on previous studies.Reference Lewis, Jordan and Geltmacher35, Reference Raabe, Sachtleber, Zhao, Roters and Zaefferer38 Grains that intersected with the edges of the reconstructed volumes were not discounted, that is, the contributions of partially reconstructed grains contained within the interior of the volume were considered along with fully reconstructed grains.
The polycrystalline BCC β-titanium alloy used in this study exhibits strong elastic anisotropy (A = 5.0).Reference Chawla and Sidhu8 Mechanical response is, therefore, expected to have a measurable dependence on crystallography. To determine the correlation between crystallographic grain orientation and mechanical response in this microstructure, the crystallographic direction that was aligned with the loading axis was calculated for each grain. For uniaxial tension loading cases, the crystallographic direction aligned with the global x-, y-, and z-directions was calculated based on the averaged measured orientations for each grain. For biaxial tension, the “loading direction” was considered to be the direction normal to the plane on which the biaxial load was applied, for example, for the biaxial tension on the xy-plane, the global z-direction was taken as the global loading direction. (This choice was based on the idea that biaxial tension in a given plane is akin to generalized compression in the direction normal to that plane.) For each grain, the effective stress and cumulative shear strain were calculated and plotted on a stereographic projection at a location representing the crystallographic direction aligned with the loading axis. The stereographic projection is reduced to a unit triangle based on the symmetry of the cubic system. Plotting the data in this way provides a clear visual representation of the correlations between mechanical response and crystallography.
Sub-volume selection
For the analysis in this work, it was desirable to analyze the largest possible number of grains, with a wide distribution of crystallographic orientations. However, the simulation of a true RVE was not practical due to computational constraints. Additionally, because the data being extracted from these simulations was based on individual grains and not on their interactions with their surroundings per se, it was practical to plot data from multiple simulations on one set of axes, allowing for greater statistical significance of the analysis. For this reason, the sub-volumes selected for the FE analysis were chosen based on position within the large volume, such that overlap of sub-volumes was minimized and maximum regions were represented. While this ad hoc method of sub-volume selection is suitable for this type of analysis, it would be desirable to use a rigorous methodology for other studies to select of sub-volumes that are representative of the sample microstructure in a cumulative sense, as well as in regard to a particular feature or parameter (such as texture or grain size distribution). In this respect, the extension to polycrystalline materials of the recent work of Fullwood et al.Reference Fullwood, Niezgoda, Adams and Kalidindi32 on the replacement of a single, large RVE with sets of smaller statistical volume elements will be appropriate.
III. RESULTS
A. Global response
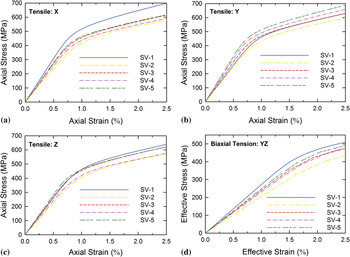
The stress–strain curves for the five sub-volumes are shown in Fig. 4. Figures 4(a), 4(b), and 4(c) show the stress–strain response for uniaxial tension applied in the global x-, y-, and z-directions, respectively, and Fig. 4(d) shows the effective response for biaxial tension applied in the yz-plane.
Global stress–strain curves for 5 sub-volumes under (a) uniaxial tension in the global x-direction, (b) uniaxial tension in the global y-direction, (c) uniaxial tension in the global z-direction, (d) biaxial tension in the global yz-plane.

B. Grain-level response
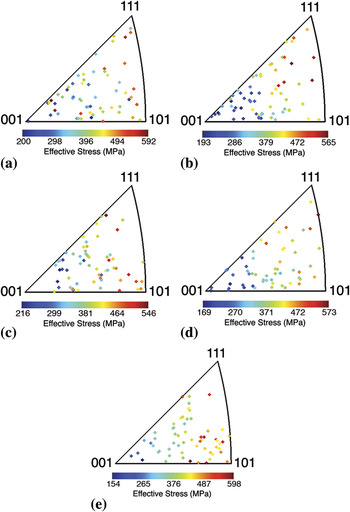
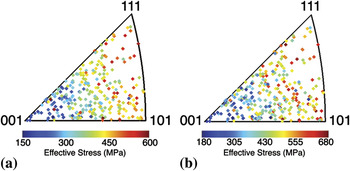
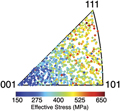
To examine behavior on the grain level, the mean effective stress was plotted versus the crystallographic axis that was aligned with the (global) loading direction for each grain. (Results of cumulative shear strain versus the crystallographic axis show similar trends and are not shown here for brevity.) Figure 5 shows the plots of mean effective stress versus crystallographic axis aligned with the loading direction for the five individual sub-volumes (SVs). In these simulations, a uniaxial tensile strain of 0.7% was applied in the global x-direction. In Fig. 6, the data for all five sub-volumes are plotted simultaneously. Figure 6(a) shows mean effective stress versus crystallographic axis aligned with the loading direction for all five sub-volumes under uniaxial tension in the global x-direction at 0.7% applied strain, and Fig. 6(b) shows the same sub-volumes under biaxial tension in the global yz-plane at 0.7% applied effective strain. Note that the crystallographic directions for these two plots fall on the same points, as the normal to the yz-plane for the biaxial tension simulation is equivalent to the global x-direction in the uniaxial tension simulation.
Mean effective stress (MPa) versus crystallographic axis aligned with the loading direction for five individual sub-volumes (SVs) under uniaxial tension in the global x-direction. (a) SV1, (b) SV2, (c) SV3, (d) SV4, and (e) SV5.

Mean effective stress (MPa) versus crystallographic axis aligned with the loading direction for all five sub-volumes under (a) uniaxial tension in the global x-direction and (b) biaxial tension in the global yz-plane.

IV. DISCUSSION
A. Global response
As seen in Fig. 4, for each loading case, both the elastic and plastic responses show considerable scatter among the five sub-volumes. Also, there is anisotropy in the three tensile responses for each of the sub-volumes individually. There is an inherent small texture in the 4300 grain sample from which these sub-volumes are derived,Reference Rowenhorst, Lewis and Spanos33 but that alone cannot account for the marked differences in the tensile response. Instead, this is most likely caused by the small sampling size (∼100 grains) in each sub-volume, which is not necessarily representative of the crystallographic distribution of the sample. In such small volumes, the presence of few large grains can dominate the behavior of the volume and exhibit high elastic anisotropy, which at small strains dictates the overall mechanical response.
B. Grain-level response
The plots in Fig. 5 show the mechanical response (in this case, mean effective stress) as a function of crystallographic orientation for each grain. Each data point in each plot represents one grain. Although slight trends can be observed in the individual plots, with lower stresses near the <001> directions and higher stresses closer to the <101> and <111> directions, the data from each individual simulation represent too few points to state that the correlation is statistically relevant. The trend is more visible in the plots in Fig. 6, which each contain over 400 data points from all five sub-volumes plotted collectively and covers more of the unit triangle. For both the uniaxial and the biaxial tension cases, the grains with <001> direction aligned with the loading axis have the lowest mean values of effective stress. While it is not clear if a maximum exists on this plot, the mean effective stresses are higher near the <110> and <111> directions. Although the sub-volumes individually were not representative of the global stress–strain response, the data obtained at the local scale can still be used in combination to observe the above-mentioned trend in the orientation–stress correlation.
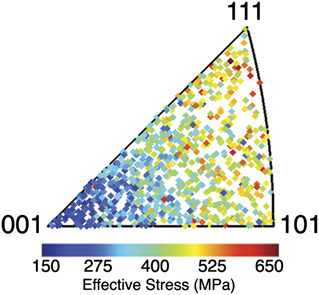
To further investigate this phenomenon, the uniaxial tension data are plotted in Fig. 7 for all five sub-volumes, for all three (x, y and z) global loading directions at 0.7% applied strain. The data on this figure represent 15 separate simulations comprising ∼1500 data points. The trend is quite apparent in this plot; it is shown clearly that grains with the <001> direction aligned with the loading axis have the lowest mean values of effective stress. While the data from each individual simulation of the sub-volumes merely suggested the trend, the combination and agreement of these data for multiple sub-volumes under multiple equivalent loading conditions in multiple directions establishes the statistically relevant correlation between crystallography and mechanical response in this material.
Mean effective stress (MPa) versus crystallographic axis aligned with the loading direction for all five sub-volumes under uniaxial tension in the global x-, y-, and z-directions (15 datasets).

C. Correlation with global response
As shown in Fig. 4, the global stress–strain response shows considerable variation among the five sub-volumes. This is most pronounced in Fig. 4(a), in which sub-volume 1 (blue) is shown to have a higher elastic constant and yield stress than the other four sub-volumes and sub-volume 2 (yellow) has the lowest elastic constant and yield stress. It is assumed that the variation in the response of these sub-volumes is due to the small sampling size and the fact that only a few grain orientations are represented in these sub-volumes, resulting in a difference in texture and, therefore, in response for each sub-volume. Comparison with the data in Fig. 5 confirms this; , it is shown in Fig. 5(a) that very few grains in sub-volume 1 have the <100> axis aligned with the loading direction, as compared to sub-volume 2 in Fig. 5(b), which has the lowest yield stress of the five sub-volumes and also contains a large number of grains with a <001>-type axis aligned with the loading direction.
V. CONCLUSIONS
The ability to perform large-scale crystal plasticity computations has still not reached levels where true RVEs can be simulated customarily for most properties. Representative data can, however, be extracted through the use of smaller sub-volumes for a variety of problems, including intergranular and intragranular material behavior, and structure–property correlations. The later aspect was established in this work for a BCC β-Ti alloy using image-based crystal plasticity simulations. Combination of the crystallographic and mechanical data from five sub-volumes for three separate tensile loading cases yielded ∼1500 data points in the stereographic projection, which indicated clearly the compliance trend of the <001> crystal orientation and the relative stiffness trend of the <110> and <111> orientations. Moreover, this combination of data moved the analysis results closer to achieving the desired statistical significance and showed that investigation of structure–property correlations and trends is not necessarily dependent on analyzing very large set of grains in one volume; rather, smaller sub-volumes allow for an equally thorough analysis, with reduced computational cost.
ACKNOWLEDGMENTS
This research was supported by the Office of Naval Research and DARPA under Grant No. N0001407WX20381 (Dr. Julie Christodoulou, program manager). FE Simulations were performed through the DoD High Performance Computing Modernization Program. The authors express their gratitude to Mr. Leroy Levenberry for significant efforts in performing the serial sectioning and optical microscopy for this work.