Introduction
Nanotechnology research has dramatically fueled the exploration of novel materials with unprecedented properties. However, thus far, few products have bridged the “Valley of Death” from laboratory innovation to industrial integration. Reference Wessner1,Reference Satell2 According to the US National Nanotechnology Initiative (NNI): Sustainable Nanomanufacturing—Creating the Industries of the Future, 3 “two thrust areas in materials design and measurement technology will support product, tool, and process design informed by and adhering to the overall constraints of scalability.” The first thrust area is scalable design and manufacturing of nanomaterials, and the second is nanometrology. DNA nanotechnology is well positioned to integrate both areas, while also addressing their respective challenges by leveraging concepts in materials science and engineering, such as the ability to exploit Watson–Crick base pairing, where nucleobases pair as guanine–cytosine or adenine–thymine to program the structure–property relationships of DNA nanostructures.
The rational integration of next-generation metrology with nanomaterials is a key moment for the NNI, a critical roadblock for the semiconductor industry, and an open invitation for materials scientists and engineers to apply their mantra of characterizing the structure, properties, processing, and performance of material systems. With the declared end of the International Technology Roadmap for Semiconductor and the recent emergence of the Semiconductor Synthetic Biology Roadmap, Reference Zhrinov4 a new materials ecosystem is under way. The ecosystem includes (1) nucleic acid memory for archival storage, (2) computational systems that are either cell-based or cell-inspired, (3) intelligent sensor systems, (4) biological system design, and (5) DNA-controlled sub-10 nm manufacturing. Reference Zhrinov4 In all of these research and technology areas, nanometrology is required.
The developments of DNA nanotechnology over the past 30+ years Reference Seeman5 provide intriguing possibilities for integrating nanoscale structure and function with next-generation metrology by design. As a technical framework for materials scientists and engineers, there are three applications spaces where the integration of DNA nanotechnology and metrology are being explored in anticipation of this new materials world: (1) DNA nanostructures with arbitrary shapes and features can be synthesized with high yield and may serve as calibration standards for scanning probe microscopy (SPM); (2) dynamic DNA nanotechnology enables a programmable version of super-resolution microscopy that, when combined with structural DNA nanotechnology, enables calibration standards for existing and novel super-resolution microscopies; and (3) incorporation of active and programmable DNA elements within large-scale nanostructures provides new opportunities for the measurement of defects and other features during and after the self-assembly process.
Nanometrology with DNA nanostructures
In general, there are several requirements for the calibration standards that can be utilized in SPM, or in SPM-based nanometrology. Reference Leach, Claverley, Giusca, Jones, Nimishakavi, Sun, Tedaldi and Yacoot6 SPM calibration is usually carried out using pre-calibrated grating pitch and step height standards, and these precision rulers should be stable for repetitive measurements over a long time. In other words, the standards should be robust enough to maintain their spatial accuracy and intended shape for days or even months. Importantly, structures containing defects should also be easily distinguished. For SPM, the dimensions of flat sharp-edged calibration areas should be larger than the tip apex radius (area should ideally be >20 nm × 20 nm) in order to obtain reliable and statistically valid results.
All of these previously mentioned criteria for nanoscale calibration systems could be achieved using bottom-up approaches, for example, a fairly robust and versatile DNA origami technique, which is based on folding a long single-stranded DNA into a desired nanoscale shape with the help of dozens of short DNA “staple” strands. It is beneficial that the DNA origami structures are straightforward to design, their fabrication yield is high, and they can easily survive for months in aqueous media. The modularity of DNA origami also allows for formation of large DNA origami superstructures, Reference Rajendran, Endo, Katsuda, Hidaka and Sugiyama7,Reference Tikhomirov, Petersen and Qian8 which can be beneficial for nanometrology as the standards usually have lateral dimensions at the micrometer scale. This is often required in order to easily find the calibration structure.
In practice, large origami assemblies can be formed by stitching single origami tiles using short single-stranded DNA overhangs dubbed “sticky-ends” Reference Liu, Zhong, Wang and Seeman9 or by linking them together through blunt-end stacking of the double-stranded DNA segments. Reference Woo and Rothemund10–Reference Gerling, Wagenbauer, Neuner and Dietz12 As the typical dimensions of conventional DNA origami shapes are <100 nm, the desired assembly should include hundreds of origami monomers, preferably without any errors, to provide large enough structures that can be easily found using SPM. The procedures for forming such large structures often need careful optimization, and although efficient attachment can be achieved, minor non-idealities (twists, bends, etc.) within the tiles accumulate in larger assemblies, thus inhibiting crystal formation or yielding highly defective structures. In general, the self-assembly of 2D lattices can be enhanced by the substrate; for example, large ordered lattices can form through cation-controlled surface diffusion or lipid-bilayer-assisted mechanisms. Reference Woo and Rothemund13,Reference Suzuki, Endo and Sugiyama14 With the origami technique, it is currently possible to achieve domains with dimensions of several micrometers, which is a relevant size for calibration applications.
Despite all the virtues of modular and customized DNA nanostructures, challenges still exist in employing them as feasible SPM calibration standards. One of these is the flexibility of DNA molecules, since the structure needs to be as rigid as possible for calibration purposes. The DNA structures constantly fluctuate in solution, which can be simulated using computational tools, Reference Castro, Kilchherr, Kim, Shiao, Wauer, Wortmann, Bathe and Dietz15 but their immobilization to a supporting substrate may alleviate this problem. One potential challenge is that some DNA structures might be prone to denaturation in low-salt solutions, and they could be sensitive to temperature and pH. Reference Hahn, Wickham, Shih and Perrault16 Nevertheless, DNA structures are stable in the solid state, Reference Kim, Surwade, Powell, O’Donnell and Liu17 and their solution stability can be improved by protective coatings. Reference Auvinen, Zhang, Nonappa, Kopilow, Niemelä, Nummelin, Correia, Santos, Linko and Kostiainen18,Reference Ponnuswamy, Bastings, Nathwani, Ryu, Chou, Vinther, Li, Anastassacos, Mooney and Shih19
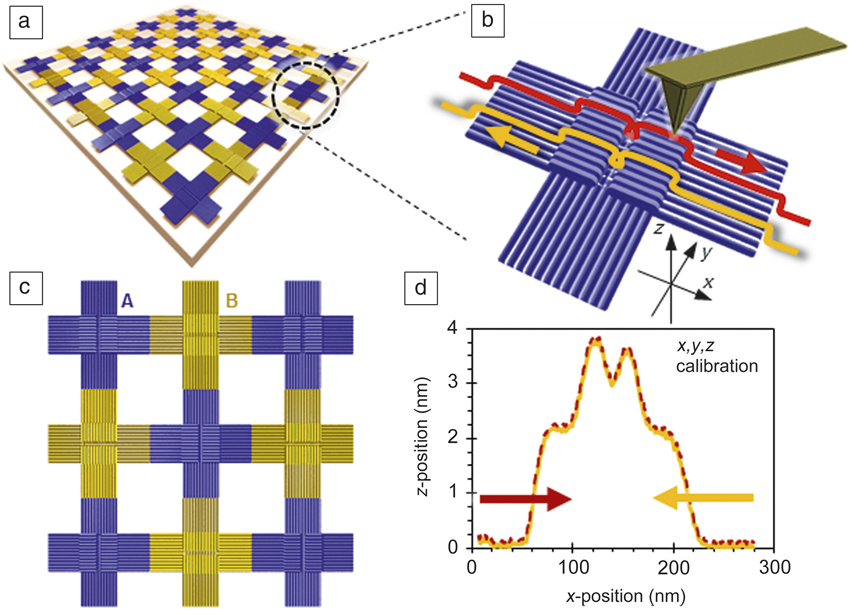
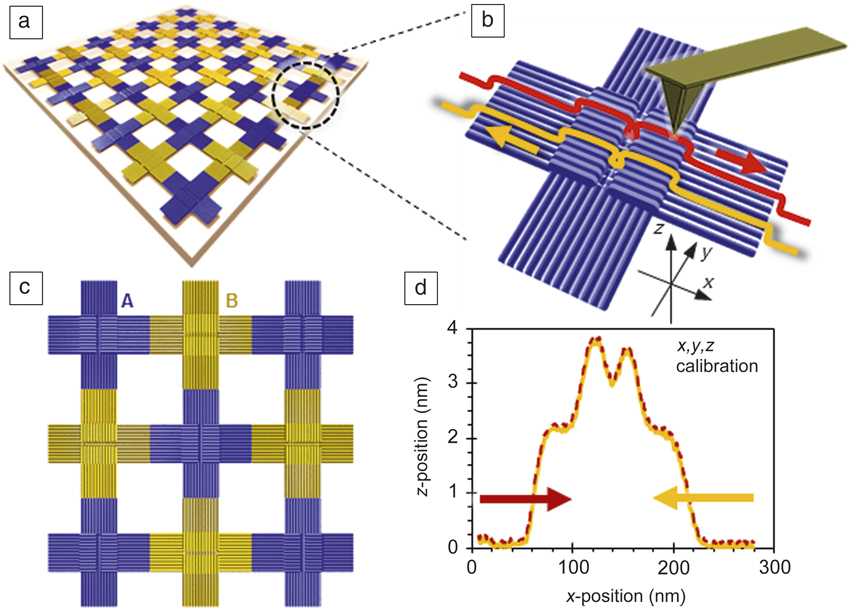
An example of a DNA origami-based calibration standard is presented in Figure 1 . A large periodic assembly can be formed either directly in a solution Reference Liu, Zhong, Wang and Seeman9 or on a suitable substrate from the individual cross-shaped tiles. Reference Aghebat Rafat, Pirzer, Scheible, Kostina and Simmel11 Each tile has two different step height standards (z-calibration) and well-defined lateral dimensions for simultaneously calibrating all three dimensions. A large and nearly uniform step area provides enough individual measuring points for averaging. In a study where these single cross-shaped tiles were characterized on mica using metrological atomic force microscopy, Reference Korpelainen, Linko, Seppä, Lassila and Kostiainen20 the average dimensions of such structures were found to match well with the designed ones. However, the variation in the dimensions was 3–10% (including the measurement error and substrate-induced deformation of dry origami), which is too high for a proper metrological calibration standard. The problems in dimensional stability are likely due to the sample preparation, such as deposition/drying, and are not intrinsic to the structures. Reference Bai, Martin, Schemers and Dietz21 Nevertheless, the study revealed some interesting features that could still make these structures possible candidates for calibration purposes. The calibration samples can be fabricated easily, and the drop-cast deposited DNA tiles were surprisingly stable, as they retained their shape for at least 12 months without any significant degradation. The deposited structures can cover a large substrate area Reference Linko, Shen, Tapio, Toppari, Kostiainen and Tuukkanen22 and allow calibration at a range of scanner offsets with reliable dimensions across the sample. Furthermore, it was found that these samples are well suited for “rough calibration” of SPMs, since the relative scale errors in noncalibrated instruments Reference Seppä, Korpelainen, Bergstrand, Karlsson, Lillepea and Lassila23 can be as high as 30%.
Large-scale assembly of cross-shaped DNA origami structures Reference Liu, Zhong, Wang and Seeman9 deposited on a suitable substrate could be used as a calibration standard in nanometrology. (a) Such origami arrays are assembled from A (blue) and B (yellow) type origami, which are (c) programmed to bind arm to arm. (b) xyz-calibration is based on the exact step heights and well-defined vertical dimensions of each single origami tile (d) as illustrated by the atomic force microscope profiles for scanning in the forward (red) and reverse (yellow) directions over an origami tile. Reference Korpelainen, Linko, Seppä, Lassila and Kostiainen20 Four flat areas with dimensions of 30 nm × 30 nm × 2 nm in each tile provide enough measuring points for averaging and reliable calibration.
Calibrating super-resolution microscopy
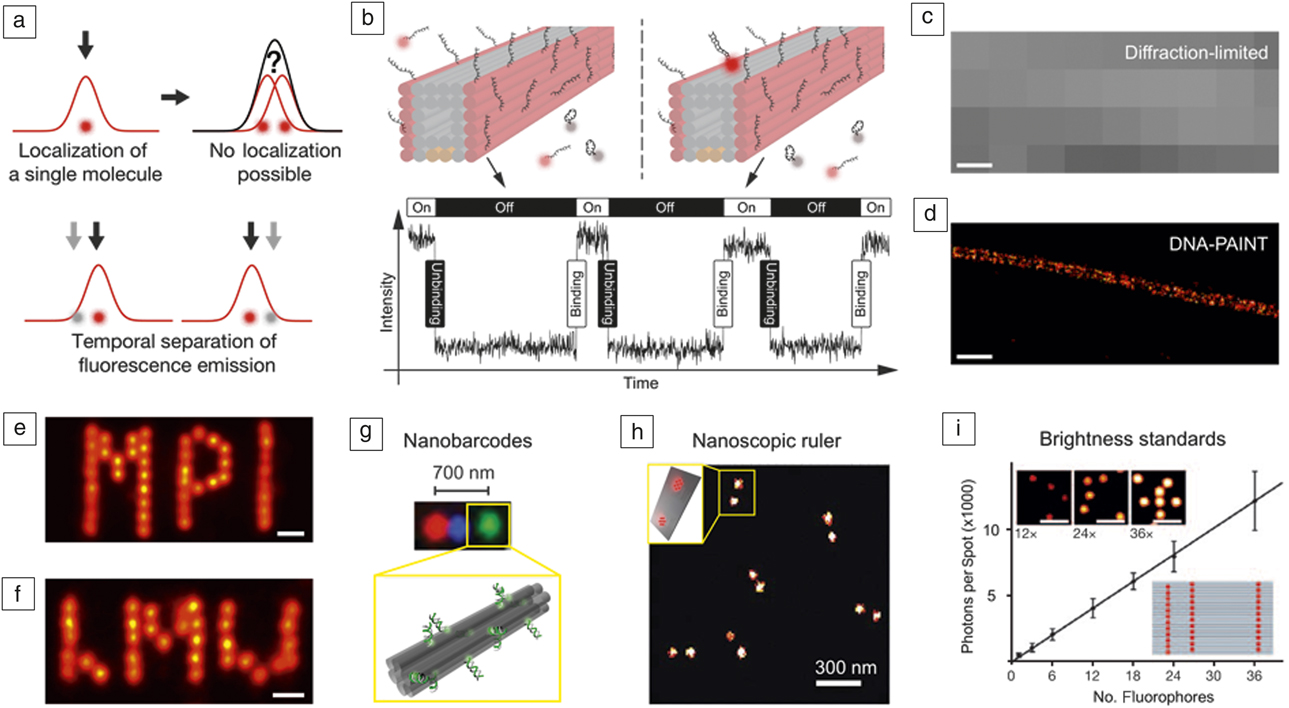
While SPM-based techniques can readily achieve high spatial resolutions on the order of a few to tens of nanometers, optical fluorescence microscopy techniques have long been restricted to ∼200 nm resolution due to the classical diffraction limit of light. However, the recent development of so-called super-resolution techniques Reference Hell, Sahl, Bates, Zhuang, Heintzmann, Booth, Bewersdorf, Shtengel, Hess, Tinnefeld, Honigmann, Jakobs, Testa, Cognet, Lounis, Ewers, Davis, Eggeling, Klenerman, Willig, Vicidomini, Castello, Diaspro and Cordes24 have led to a true revolution in optical microscopy, which is starting to transform research, especially in the life sciences, by enabling structural and functional studies with subdiffraction resolution. Current implementations can achieve spatial resolution of a few tens of nanometers in both two and three dimensions. One popular branch of super-resolution microscopy techniques is based on temporally separating single-molecule events for subsequent super localization in a stochastic manner ( Figure 2a). Reference Jungmann, Scheible and Simmel25 Prominent implementations of these so-called single-molecule localization microscopy (SMLM) techniques include stochastic optical reconstruction microscopy Reference Rust, Bates and Zhuang26 and photo-activated localization microscopy. Reference Betzig, Patterson, Sougrat, Lindwasser, Olenych, Bonifacino, Davidson, Lippincott-Schwartz and Hess27
Super-resolution microscopy, DNA origami calibration standards. (a) Principle of localization microscopy. Localization of single point emitters in a diffraction-limited area is possible with subdiffraction precision by fitting the point spread function to a 2D-Gaussian function. Adapted with permission from Reference Reference Jungmann, Scheible and Simmel25. (b) DNA-PAINT (points accumulation in nanoscale topography) concept. Transient binding of dye-labeled oligonucleotides (colored in red) to their targets enables programmable SRES microscopy. (bottom) The fluorescence intensity versus time trace for a docking site reveals the association and dissociation times of dye-labeled oligonucleotides. Adapted with permission from Reference Reference Jungmann, Avendano, Woehrstein, Dai, Shih and Yin31. (c) Diffraction-limited fluorescence image of a tunnel-like DNA origami structure from (b). Adapted with permission from 31. (d) DNA-PAINT SRES micrograph shows enhanced resolution, resolving the 16-nm distance between the two faces of the DNA origami equipped with DNA-PAINT docking strands. Adapted with permission from Reference Reference Jungmann, Avendano, Woehrstein, Dai, Shih and Yin31. (e–f) DNA origami’s unique structural addressability and integrity visualized with sub-5 nm DNA-PAINT imaging of MPI and LMU logos. Adapted with permission from Reference Reference Schnitzbauer, Strauss, Schlichthaerle, Schueder and Jungmann30. (g) DNA origami can act as breadboards for spatially arranging spectrally distinct dye to create nanobarcodes. Adapted with permission from Reference Reference Lin, Jungmann, Leifer, Li, Levner, Church, Shih and Yin33. (h) DNA origami as a nanoscopic ruler for SRES microscopy allows calibration and resolution checks for a variety of super-resolution techniques. Shown is a STORM (stochastic optical reconstruction microscope) image of dyes spaced ∼60 nm apart on the DNA origami. Adapted with permission from Reference Reference Schmied, Gietl, Holzmeister, Forthmann, Steinhauer, Dammeyer and Tinnefeld37. (i) DNA origami can act as brightness standards for diffraction-limited microscopy with linearly increasing brightness versus number of dyes. Fluorescence images (inset top) of DNA origami with 12, 24, and 36 attached dyes, respectively, and (inset bottom) a schematic of an origami designed with 36 attached dye molecules. Adapted with permission from Reference Reference Schmied, Gietl, Holzmeister, Forthmann, Steinhauer, Dammeyer and Tinnefeld37. Scale bars = 100 nm (c–d), 10 nm (e–f), and 2 µm (i).

Stochastic “blinking” (i.e., fluorescence ON- and OFF-states) for SMLM can also be achieved by an influx of probes that interact statically or transiently with their respective target molecules. This implementation is called points accumulation in nanoscale topography (PAINT) Reference Sharonov and Hochstrasser28 and enables SMLM without the need for special instrumentation or buffer conditions to drive the change from dark to bright states to create the necessary “blinking.” While this alleviates some of the complications of other super-resolution approaches, interactions of imaging probes with their targets are usually limited to hydrophobic interactions of membrane-binding dye molecules and are thus hard to control and program. Reference Auvinen, Zhang, Nonappa, Kopilow, Niemelä, Nummelin, Correia, Santos, Linko and Kostiainen18
A recent variation of the PAINT concept uses dye-labeled DNA strands that transiently and sequence-specifically bind to their complementary targets, thus creating the necessary “blinking” for SMLM in a programmable fashion. This approach is called DNA-PAINT Reference Jungmann, Steinhauer, Scheible, Kuzyk, Tinnefeld and Simmel29,Reference Schnitzbauer, Strauss, Schlichthaerle, Schueder and Jungmann30 (Figure 2b). DNA-PAINT is relatively straightforward to implement for DNA origami structures, since staple strands as targets can simply be extended with “docking” sites for subsequent super-resolution imaging. (See Figure 2c–d for a comparison between a diffraction-limited and DNA-PAINT super-resolution image of a DNA origami structure.) Reference Jungmann, Avendano, Woehrstein, Dai, Shih and Yin31 Recently, the achievable spatial resolution was pushed below 5 nm by optimizing imaging conditions and drift correction, Reference Schnitzbauer, Strauss, Schlichthaerle, Schueder and Jungmann30,Reference Dai, Jungmann and Yin32 now readily approaching SPM-like regimes (Figure 2e–f).
DNA nanostructures, in general, and DNA origami, in particular, are ideally suited as substrates for a variety of single-molecule studies. Due to their straightforward programmability, they can act as scaffolds to arrange fluorophores conjugated to “staple” strands, thus creating geometrically encoded barcodes for multiplexed in vitro detection Reference Lin, Jungmann, Leifer, Li, Levner, Church, Shih and Yin33 (Figure 2g). Origami’s unique addressability, however, can be truly utilized by creating “calibration standards” for single-molecule and especially super-resolution microscopy, Reference Steinhauer, Jungmann, Sobey, Simmel and Tinnefeld34 which in fact led to the first commercial application of DNA origami. 35 One general issue common to all super-resolution techniques is the inability to quantitatively state an achievable spatial resolution, mainly due to the lack of a programmable “ruler” achieving high accuracy and precision for positioning fluorophores at prescribed distances, ranging from a few to hundreds of nanometers. Thanks to the exquisite control over fluorophore positions and spacing, and the high formation yield of origami structures, DNA origami has been employed for fabricating calibration standards for super-resolution microscopy in two and three dimensions Reference Steinhauer, Jungmann, Sobey, Simmel and Tinnefeld34,Reference Schmied, Forthmann, Pibiri, Lalkens, Nickels, Liedl and Tinnefeld36 (Figure 2h). Further applications of DNA origami calibration and barcoding entities include tunable brightness Reference Schmied, Gietl, Holzmeister, Forthmann, Steinhauer, Dammeyer and Tinnefeld37 and color Reference Woehrstein, Strauss, Ong, Wei, Zhang, Jungmann and Yin38 (Figure 2i), as well as molecular counting. Reference Jungmann, Avendano, Dai, Woehrstein, Agasti, Feiger, Rodal and Yin39,Reference Ta, Keller, Haltmeier, Saka, Schmied, Opazo, Tinnefeld, Munk and Hell40 Importantly, the broader super-resolution community is starting to pick up DNA origami structures as useful tools in proof-of-principle studies. Reference Sidenstein, D’Este, Bohm, Danzl, Belov and Hell41–Reference Gottfert, Pleiner, Heine, Westphal, Gorlich, Sahl and Hell43
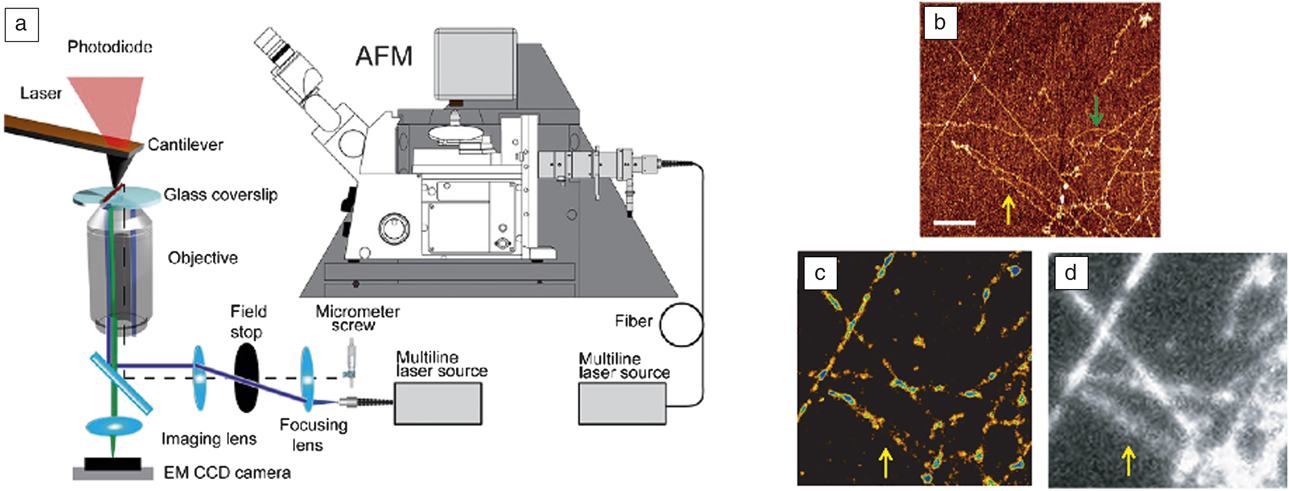
Finally, DNA origami structures should find immediate application as calibration standards for correlative microscopy techniques such as recent combinations of SPM and super resolution Reference Odermatt, Shivanandan, Deschout, Jankele, Nievergelt, Feletti, Davidson, Radenovic and Fantner44–Reference Bondia, Jurado, Casado, Dominguez-Vera, Galvez and Flors46 ( Figure 3a–d). Here, the unique ability of DNA origami to provide features that can be simultaneously imaged using two complementary modalities such as atomic force microscopy (AFM) and super resolution could provide powerful calibration tools with sub-5-nm positioning accuracy and precision, enabling high-performance correlative structure–property studies in the future.
(a) Correlative atomic force microscope and super-resolution (SRES) microscope setup. Adapted with permission from Reference Reference Odermatt, Shivanandan, Deschout, Jankele, Nievergelt, Feletti, Davidson, Radenovic and Fantner44. (b) Atomic force microscope (AFM) image of stretched lambda-DNA. (c) SRES image obtained with Yoyo-1, an intercalating stain for double-stranded DNA, of the same region as in (b). (d) Diffraction-limited micrograph of the same region as in (b). The green arrow denotes a section of DNA visible only in AFM but not in fluorescence. The yellow arrow highlights two DNA fragments close to each other that can be resolved in the AFM and SRES image, but not in the standard diffraction-limited fluorescence image. (b–d) Adapted with permission from Reference Reference Monserrate, Casado and Flors45. Scale bars = 1 µm. Note: EM, electron multiplying; CCD, charge-coupled device.

Metrology of defects in DNA nanostructures with super-resolution microscopy
As the costs for photolithography increase and the market for high volume device manufacturing changes, new approaches for fabricating integrated systems will be required. Precise metrology is the cornerstone for quality control in the semiconductor industry. Surface analysis techniques such as AFM, Reference Nagase, Namatsu, Kurihara, Iwadate and Murase47 transmission electron microscopy, Reference Strauss, Genc, Dutrow, Horspool and Dworkin48 scanning electron microscopy (SEM), Reference Frase, Buhr and Dirscherl49 and x-ray scattering Reference Bowen and Tanner50 are commonly used to identify near-atomic-level details of mask features, such as critical dimensions and roughness. However, to accelerate throughput, efficient wafer-scale metrology techniques are needed to avoid laborious and time-consuming AFM and SEM image analysis, which is not suitable for high-volume manufacturing. To accelerate adoption and integration with high-volume manufacturing, these new approaches must simultaneously create nanoscale materials and provide a means to confirm the fidelity of the process.
In an effort to innovate new approaches to patterning semiconductor devices at scales beyond extreme ultraviolet, several groups have reported sub-10-nm lithography using DNA nanostructures, Reference Green, Schutt, Morris, Zadegan, Hughes, Kuang and Graugnard51 and photolithography has been used to control placement of DNA nanostructures. Reference Kershner, Bozano, Micheel, Hung, Fornof, Cha, Rettner, Bersani, Frommer, Rothemund and Wallraff52,Reference Gopinath and Rothemund53 Rather than performing passive measurements on these self-assembled DNA masks, defects can be self-identified via fluorescence using DNA-PAINT, without affecting the properties of the mask. To enable real-time, in-line optical metrology, these DNA masks can be programmed for self-defect metrology to identify registration, alignment, and assembly errors during high-volume fabrication. As a result, defect metrology can be performed at a relatively high resolution and in real time. While this vision is beyond those of today, it is not beyond the technical capabilities of tomorrow.
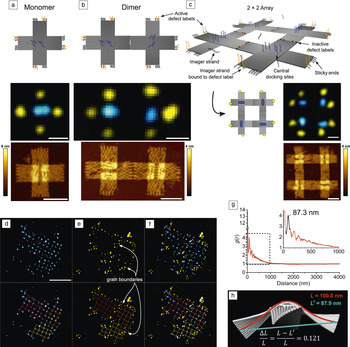
As previously described, by exploiting the molecular programmability of DNA, super-resolution imaging of DNA nanostructures using DNA-PAINT can be used for structure and process metrology in 2D assemblies. Reference Green, Schutt, Morris, Zadegan, Hughes, Kuang and Graugnard51 In addition to the super-resolution docking sites located within a DNA structure, sticky ends can be designed to perform two functions as hybrid sticky-end/docking sites. This literal and functional extension transforms the sticky ends into state-dependent defect labels and is illustrated in Figure 4a–c. In an unbound or active state, the sticky ends serve as docking sites and can be localized, indicating that the sticky end has not bound to its complement. In the bound or inactive state, the sticky end can no longer serve as a docking site, indicating that it is bound to its complement. Thus, in a well-formed DNA array, all sticky ends internal to the structure will be inactive, and those on the periphery of the structure will be active, as confirmed in the super-resolution images shown for a 2 × 2 DNA origami array in Figure 4c. The super-resolution image reveals the perimeter (i.e., grain structure) of the array, and any defects are localized at a resolution of 20 nm or better. Reference Rust, Bates and Zhuang26 Adding conventional docking sites within the individual DNA structure provides an additional structural “lattice” image that can be combined with the defect image. The result is a super-resolution image of both structure and defects within the DNA array, as shown in Figure 4d–f, revealing grain boundaries within the array. Such an image can be utilized to inform the design of the individual DNA nanostructures and to characterize the array formation process to better understand nucleation and growth, as well as characterize future DNA mask technologies.
Programmable defect and structure metrology of DNA origami arrays. (a) (top) Schematic, (middle) super-resolution (SRES) image, and (bottom) atomic force microscope (AFM) image of DNA origami cross tiles with extended hybrid sticky-end docking sites that facilitate binding to additional cross tiles as well as state-dependent SRES imaging. The state-dependent hybrid docking sites are imaged in yellow, and conventional docking sites, included in the center of the tile, are imaged in blue. The elongated nature of the central docking sites reveals the orientations of the origami tiles. (b) At the junction of a dimer, the hybrid sticky-end docking sites are deactivated to SRES imaging, which is confirmed in the SRES image below the schematic. (c) A 2 × 2 DNA origami array results in active hybrid sticky-end docking sites at the periphery of the structure and inactive sites within the structure. (a–c) Scale bars = 50 nm. (d) (top) SRES image of the central docking sites within a polycrystalline array of ∼81 origami tiles. A reconstruction of the array is shown below the image. (e) SRES image of the defect labels revealing grain boundaries between the grains of the array. (f) Combined two-color SRES image of the array. (d–f) Scale bar = 500 nm. (g) Computing radial pair-distribution functions g(r) of the central docking sites quantifies the order present within the origami arrays. (Inset) The peak identified at 87.3 nm is the average periodicity of the origami array, which is ∼13% shorter than the periodicity expected based on the origami tile width of 100 nm measured via AFM. (h) The AFM measurements are performed on origami flattened on mica, while the SRES data result from origami free to curve and twist in solution. Finite element analysis using CanDo predicts a tile curvature, and the relative change in the tile width, ΔL/L, from its full width L to its projected width L′ is ∼12%, in agreement with the experimental results. Adapted with permission from Reference Reference Green, Schutt, Morris, Zadegan, Hughes, Kuang and Graugnard51. © 2017 Royal Society of Chemistry.

Using DNA-PAINT, detailed analysis of super-resolution images of DNA nanostructures can yield information on their structure beyond the image resolution. While DNA origami are flattened when imaged on mica using SPM methods, they can exhibit three-dimensional (3D) twisting and curvature in solution. For the image shown in Figure 4d, these structural distortions were deduced by computing the radial distribution function, g(r), shown in Figure 4g, for the lattice image, which revealed a reduced lattice periodicity of 87.3 nm from the expected 100 nm. Results from finite element analysis using CanDo, Reference Castro, Kilchherr, Kim, Shiao, Wauer, Wortmann, Bathe and Dietz15,Reference Kim, Kilchherr, Dietz and Bathe54 illustrated in Figure 4h, predict curvature and twist within the origami with a projected dimension of 87.9 nm, in agreement with the experimental results. Reference Green, Schutt, Morris, Zadegan, Hughes, Kuang and Graugnard51 Thus, flexible or strained DNA nanostructures can exhibit dimensions in super resolution that differ from SPM measurements of the same structures on mica. However, using the known origami dimensions, the super-resolution data can be modeled to extract the degree of twist and curvature within the structure. While these distortions may produce only slight deviations from the designed origami structure, the statistical analysis of super-resolution images with large numbers of origami provides a straightforward approach for structural metrology with high precision.
It is intriguing to consider SPM and super-resolution metrology of the same DNA origami array structure. Defects detected by one approach are not necessarily the same as the other approach. For example, consider a missing or defective sequence in the complement of a state-dependent hybrid sticky-end docking site. The sticky-end docking site will remain active even if the origami binds properly within the array. This type of defect can be observed in super-resolution images, but it would be extremely difficult to observe in an SPM image. On the other hand, SPM images characterize an entire array in 3D and not just the portions of a structure containing a docking site for DNA-PAINT. Thus, complementary data are obtained from SPM and super-resolution metrologies.
Conclusions
Better alignment with the Materials Genome Initiative, which seeks to accelerate materials development by leveraging the advances in computational materials science, provides an opportunity for DNA nanotechnology to contribute to nanometrology. While multiple software tools exist for the design and analysis of DNA structures, there is a real need to improve computational approaches. For example, one of the most commonly used programs for DNA origami design (caDNAno) Reference Douglas, Marblestone, Teerapittayanon, Vazquez, Church and Shih55 enables curved or twisted DNA structures to be designed, but the software renders the structures on a rectilinear grid, whether or not the structures will actually be curved when synthesized. To understand the degree of curvature, caDNAno design files must be analyzed by finite element methods in wholly different software (CanDo); Reference Castro, Kilchherr, Kim, Shiao, Wauer, Wortmann, Bathe and Dietz15,Reference Kim, Kilchherr, Dietz and Bathe54 refinements to the curvature or twist have to be reasoned out with pen and paper, put back into the caDNAno design, and then reanalyzed with CanDo in an iterative process. There is no software that easily allows the automated design of specified shapes with complex curvature. Currently, computational tools available to the DNA nanotechnology community allow designed structures to be analyzed (e.g., CanDo can predict the solution shapes of an origami design), but tools for designing even more precise structures without curvature or twist are needed. One approach to simplify and accelerate the target structure design is to reduce the human input of the procedure to a minimum, such as in recently released vHelix Reference Benson, Mohammed, Gardell, Masich, Czeizler, Orponen and Högberg56 and DAEDALUS (DNA origami sequence design algorithm for user-defined structures) software. Reference Veneziano, Ratanalert, Zhang, Zhang, Yan, Chiu and Bathe57,Reference Linko and Kostiainen58 Both software programs can design DNA nanostructures based on input polyhedral shapes; the nanostructures also must be analyzed with CanDo to predict their final shape. These novel software tools are not only speeding up the usually tedious design process, but also allowing researchers outside the community to create their own customized DNA structures. Building on this progress in designing DNA nanostructures, the high structural resolution and functionality that enable SPM calibration standards and optical super-resolution imaging also help develop powerful new tools for materials science at the nanometer scale, which will lead more researchers and companies to adopt DNA nanotechnology for a plethora of applications.
Acknowledgments
E.G. and W.L.H. acknowledge the National Science Foundation Scalable NanoManufacturing Program (CMMI-1344915) and the Micron Foundation. W.L.H also acknowledges the National Institute of General Medical Sciences of the National Institutes of Health (K25GM093233). M.A.K. acknowledges the Academy of Finland (Project Number 308578). V.L. acknowledges the Academy of Finland (Project Number 286845) and the Jane and Aatos Erkko Foundation. R.J. acknowledges support by the Deutsche Forschungsgemeinschaft (DFG) through the Emmy Noether Program (DFG JU 2957/1–1), the Collaborative Research Center 1032 (Nanoagents for the spatiotemporal control of molecular and cellular reactions), the European Research Council (ERC) through an ERC Starting Grant (MolMap, Grant Agreement Number 680241), the Max Planck Society, the Max Planck Foundation, and the Center for Nanoscience.

Elton Graugnard is an assistant professor in the Micron School of Materials Science & Engineering at Boise State University. He obtained his PhD degree in physics from Purdue University in 2000. His research interests include DNA nanotechnology, scanning probe and super-resolution microscopies, and atomic layer deposition. Graugnard can be reached by phone at 208-426-4026 or by email at eltongraugnard@boisestate.edu.

William L. Hughes is an associate professor in the Micron School of Materials Science & Engineering, cofounder and associate dean of the College of Innovation + Design, and head of the Vertically Integrated Projects Program at Boise State University. He received his PhD degree in materials science and engineering from the Georgia Institute of Technology. His research interests include DNA nanotechnology, nucleic-acid memory, and synthetic biology. His awards include the National Academy of Engineering Center for the Advancement of Scholarship on Engineering Education Award, NIH Quantitative Development K25 Career Award, and the W.M. Keck Foundation Award. Hughes can be reached by phone at 208-426-4859 or by email at willhughes@boisestate.edu.

Ralf Jungmann is a professor of experimental physics at the Ludwig Maximilian University Munich and a group leader at the Max Planck Institute of Biochemistry, Germany. He obtained his Diploma in physics in 2006 from Saarland University, Germany, and the University of California, Santa Barbara, and his PhD degree from Technische Universität München, Germany, in 2010. His research focuses on DNA-based single-molecule approaches for high spatial resolution, spectrally unlimited multiplexing, and quantitative imaging. He was named the Paul Allen Distinguished Investigator for Epigenetics in 2017. Jungmann can be reached by phone at +498985783410 or by email at jungmann@biochem.mpg.de.

Mauri Kostiainen is an associate professor in the School of Chemical Engineering at Aalto University, Finland. He obtained his MSc degree in organic chemistry from the University of Helsinki, Finland, in 2005, and his PhD degree in engineering physics from the Helsinki University of Technology, Finland, in 2008. His research interests focus on the integration of biological and synthetic building blocks in a designed manner to create biohybrid materials. He has authored more than 50 articles and his awards include the TES Young Investigator Award and the World Cultural Council Special Recognition for international impact. Kostiainen can be reached by phone at +358505300027 or by email at mauri.kostiainen@aalto.fi.

Veikko Linko is a postdoctoral researcher in the School of Chemical Engineering at Aalto University, Finland. He obtained his MSc degree in 2007 and PhD degree in 2011, both in physics from the University of Jyväskylä, Finland. He completed postdoctoral research at the Technische Universität München, Germany, until 2013. In 2015, he was granted the title of Docent at the University of Jyväskylä in the field of molecular nanotechnology. His research interests include structural DNA nanotechnology, self-assembled materials, drug delivery applications, nanolithography, and molecular electronics. Linko can be reached by phone at +358456739997 or by email at veikko.linko@aalto.fi.