INTRODUCTION
Agriculture contributes significantly to the gross domestic product of Greece. It occupies 4·1 million hectares (ha), of which 2·6 million ha are arable areas (Hellenic Statistical Authority 2010). The area of oilseed crops has grown significantly over the last 4–5 years, from 12 100 ha in 2007 (Hellenic Statistical Authority 2010) to more than 65 000 ha in 2011 (personal communication, Hellenic Statistical Authority). The main crop grown is sunflower (0·9), followed by rapeseed (0·07) and soybean (0·03). Such an increased interest in oilseed crop production is the result of rapid establishment of the country's biodiesel industry (Center for Renewable Energy Sources and Saving 2007), along with relevant legislation promoting the use of oils from locally grown crops (EC 2009). This trend is expected to continue with the increasing use of diesel-powered cars. The exploitation of renewable energy sources constitutes a key factor towards environmental protection and improvement. Biodiesel is considered as one of the most important bioliquids that may replace or blend with conventional diesel. This is mainly due to its superiority over fossil diesel as far as impacts on the environment are concerned, as well as to the technical advantages deriving from the use of biodiesel such as in combustion improvement, lower emissions, biodegradability and better engine lubrication. However, some researchers are sceptical, since biodiesel production has caused food oil prices to rise and at the same time ecological damage has been incurred due to drastic land use changes in many countries where rainforests have been displaced by energy crop plantations. Furthermore, biodiesel has been associated with disadvantages such as higher viscosity, lower energy content, high freezing point and degradation under long periods of storage (Wardle Reference Wardle2003; Drapcho et al. Reference Drapcho, Nhuan and Walker2008; Sanz Requena et al. Reference Sanz Requena, Guimaraes, Quiros Alpera, Relea Gangas, Hernandez-Navarro, Navas Gracia, Martin-Gil and Fresneda Cuesta2011). Sunflower, rapeseed and soybean oils are important feedstocks for biodiesel production worldwide. France and Germany are the biggest biodiesel producers in the EU, using mainly rapeseed because its high oil content produces better biodiesel yields (Drapcho et al. Reference Drapcho, Nhuan and Walker2008).
The biodiesel industry in Greece is relatively new. Crops that are being used for biodiesel production are mainly sunflower and rapeseed, with cotton (Gossypium hirsutum L.) seed also being used by certain biodiesel plants. When no full-fat soybean meals are needed, soybean oil could also be exploited, and has actually been used in small quantities. Finally, tobacco (Nicotiana tabacum L.) and tomato (Solanum lycopersicum L.) seeds could also potentially be used (Panoutsou et al. Reference Panoutsou, Namatov, Lychnaras and Nikolaou2008).
Sunflower has been grown in Greece for several years, for both human food and livestock feed. However, during recent years, sunflower oil has been utilized primarily as a good feedstock for biodiesel production. Apart from the already existing farmers’ experience, there have been many reports on the yield potential of sunflower under the country's conditions, for both seed yield and oil content. For example, Tsatsarelis (Reference Tsatsarelis and Sakellariou-Makrantonaki2000) reported that the oil content ranged from 400 to 500 g/kg and seed yield reached 3·2 t/ha under irrigated conditions, while more recently Skoulou et al. (Reference Skoulou, Mariolis, Zanakis and Zabaniotou2011) reported 425 g/kg oil content and 2·5 t/ha of grain yield. These data, compared with the average sunflower yield in Europe in 2011 (1·7 t/ha) (FAO 2011), indicate the crop's suitability for biodiesel feedstock in Greece. Rapeseed constitutes a crop that was introduced into Greece quite recently. Interest in the crop has increased because of the high oil content (exceeding 500 g/kg under favourable conditions) reported in many countries of northern and central Europe. The first field trials were established during 1997–2000 by the Greek Centre for Renewable Energy Sources (CRES), demonstrating promising yields that reached 3 t/ha (Anon 1999–2002). Yields were similar (3 t/ha and 450 g/kg oil content) to those achieved in field trials planted by the laboratory of Plant Breeding and Biometry of the Agricultural University of Athens in two locations of southern Greece in 2007 (present authors’ unpublished data). Other studies conducted under Greek conditions indicated 2·0 t/ha of grain yield and 426 g/kg oil content (Skoulou et al. Reference Skoulou, Mariolis, Zanakis and Zabaniotou2011). All of these studies have demonstrated rapeseed's good performance under Greek conditions, since the results were comparable with those achieved in other European countries or regions, where rapeseed is well established (Pouzet Reference Pouzet, Kimber and McGregor1995). More specifically, Mielke (Reference Mielke2002) reported that rapeseed's higher yields were achieved in EU-15 and Central Europe, with 3 and 2 t/ha, respectively. However, in contrast to the initial expectations, the acreage of the crop has not increased in Greece, mainly due to insect problems and frost damage.
Although soybean has been experimentally proven for its high productivity, reaching up to 5·4 t of seed/ha and 209 g/kg oil content (Papakosta & Veresoglou Reference Papakosta and Veresoglou1989; Skoulou et al. Reference Skoulou, Mariolis, Zanakis and Zabaniotou2011), it has never become established as a major crop in Greece due to its high production costs (mainly those of irrigation) and inexpensive soybean seed imports. Recently, however, in response to the demand for non-GM soybean meal for feed, there has been an interest in the crop that might well lead to an expansion in area grown and use for both animal feed and biodiesel.
The need for sustainable and environmentally friendly biofuel production has triggered the development of relevant legislation. To this end, the European Parliament and the Council has published the 28/2009/EC renewable energy directive (RED) (EC 2009). According to this directive, Greece is obliged to reach a target of 0·18 regarding the share of energy from renewable sources in gross final consumption of energy by 2020. Furthermore, the minimum greenhouse gas (GHG) emission savings obtained by substituting a biofuel for fossil fuel must be equal to or greater than 35% until 2017, 50% for the 2017/18 period and 60% after 2018. As for biodiesel production from sunflower, rapeseed and soybean, the default GHG emission savings should be at least 51, 38 and 31%, respectively, if produced with no net carbon emissions from land use change (EC 2009).
The aims of the present study were: (a) to estimate the GHG emissions from sunflower, rapeseed and soybean production during the cultivation phase, (b) to estimate the typical GHG emission and the respective emission saving from the use of the produced biodiesel, when replacing conventional diesel and (c) to study each operation's emission contribution to total GHG emissions.
MATERIALS AND METHODS
Geographical regions of the study
Sunflower, rapeseed and soybean are grown mainly in the northern part of continental Greece and more specifically at the prefectures (regions) of Serres, Xanthi, Thessaloniki, Kilkis, Kozani, Drama-Kavala and Evros. Sunflower is grown in all prefectures and rapeseed in all except Kozani, whereas soybean is restricted to Serres, Drama-Kavala and Evros. Serres, Thessaloniki and Kilkis belong to the Central Macedonia periphery, Kozani belongs to the Western Macedonia periphery and Evros, Drama-Kavala and Xanthi prefectures belong to the Western Macedonia and Thrace periphery. These three peripheries constitute the main cultivation zone of sunflower and rapeseed in Greece (National Statistical Service of Greece 2004).
Data collection
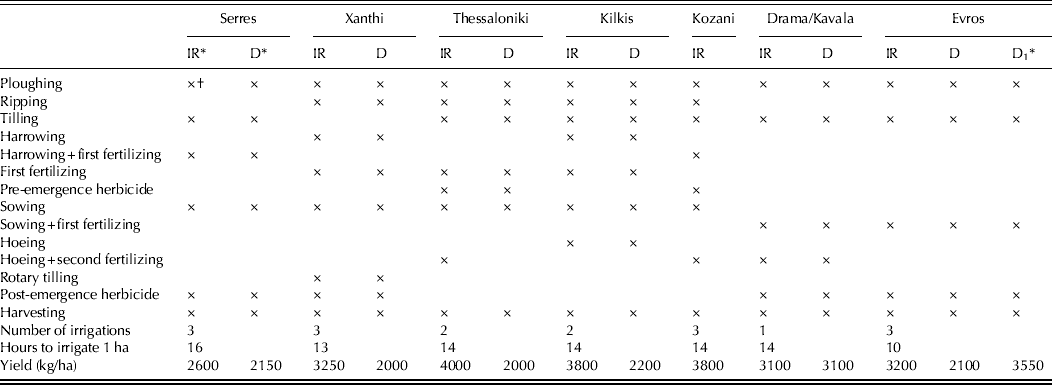
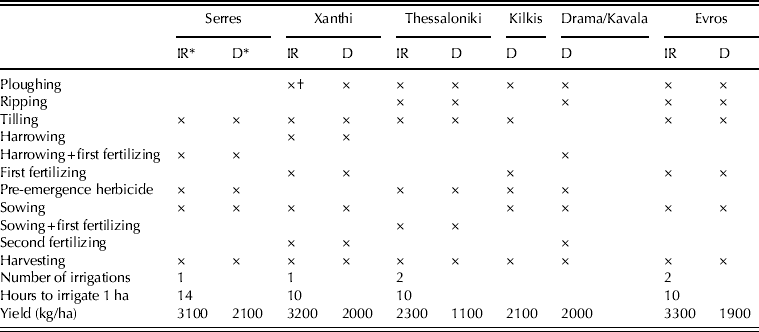
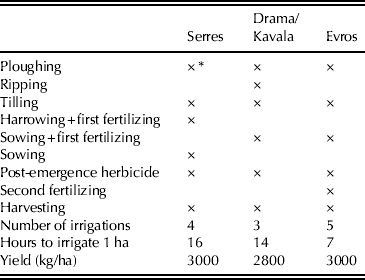
Detailed information regarding the whole life-cycle of each crop was derived from questionnaires completed by local operators at each prefecture during the 2010/11 growing season. More specifically, the dataset created included: (a) field operations; (b) quantities of seed, herbicide, insecticide and fertilizer used; (c) irrigation; and (d) final seed yields (Tables 1 to 3).
Field operations, yield, number of irrigations and hours needed to irrigate 1 ha for all regions during sunflower production in the 2010/11 growing season

* IR, D and D1 stand for irrigated, non-irrigated and areas with fertile soils and high precipitation, respectively.
† × indicates field operations that have been applied.
Field operations, yield, number of irrigations and hours needed to irrigate 1 ha for all regions during rapeseed production in the 2010/11 growing season
* IR and D stand for irrigated and non-irrigated areas, respectively.
† × indicates field operations that have been applied.
Field operations, yield, number of irrigations and hours needed to irrigate 1 ha for all regions during soybean production in the 2010/11 growing season
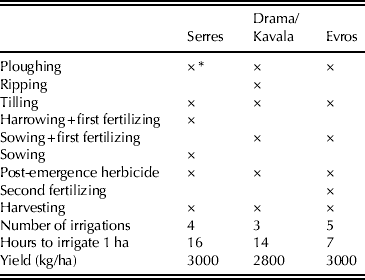
* × indicates field operations that have been applied.
Estimation of GHG emissions during the cultivation phase
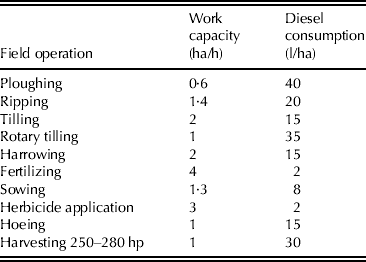
The consumed energy and the subsequent GHG emissions were calculated using the survey data. Diesel consumption (litres/ha) for field operations was estimated based on the work capacity (h/ha) for each operation (Table 4). A tractor's consumption, as estimated by local tractor sellers, was based on the type of field operation, the horsepower of the tractor and the soil type. The majority of tractors in the study regions were of medium horsepower (90–130 hp) and the soils in these regions were of a medium texture. To calculate the consumed energy, all diesel consumptions (litres/ha) per operation were aggregated and then converted to kg/ha based on diesel density (832 kg/m3). The total energy (E total) consumed (MJ/ha) was estimated as follows:
 $$E_{{\rm total}} = {\rm Diesel}\;{\rm consumption}\;({\rm litres}/{\rm ha}) \times {\rm Diesel}\;{\rm lower}\;{\rm heating}\;{\rm value}\;({\rm LHV})\;({\rm MJ}/{\rm l})$$
The GHG emissions derived from diesel consumption were calculated by multiplying the consumed energy (MJ/ha) by the diesel emission factor [87·64 grams of carbon dioxide equivalents per megajoule (g CO2e/MJ)], taken from the BioGrace European Union project (BioGrace 2012). The project is funded by the Intelligent Energy Europe Programme and deals with the harmonization of calculations of GHG emission for the production of biofuels throughout the European Union. All the calculations included in the BioGrace project meet the requirements of the 2009/28/EC Directive of The European Parliament and of The Council (EC 2009).
Work capacity and diesel consumed per field operation

Sunflower, rapeseed and soybean received sprinkler irrigation. Energy consumed for irrigation (E ir) was estimated as follows:
 $$E_{{\rm ir}} = (\,fee \times Pe \times Ud \times D)/Ai$$
where fee is the enclosed electrical energy (3·6 MJ/kWh), Pe the power (kW) of the motor driving the pumping system, while Ud, ND and Ai are the average daily use (h/day), days of irrigation and irrigated area (ha), respectively. Greenhouse gas emissions during irrigation were estimated using the emission factor (128·25 g CO2e/MJ) for medium voltage (MV) electricity (BioGrace 2012).
Greenhouse gas emissions from seed, fertilizer and pesticide applications were estimated by multiplying the applied quantity (kg/ha) by the respective emission factor. Nitrogen (N), phosphorus (P), potassium (K) and pesticide emission factors were 5917·2, 1013·5, 579·2 and 11 025 g CO2e/kg, respectively. The emission factor for seed was 733·7 g CO2e/kg for both sunflower and rapeseed. The aforementioned emission factors (default values) were taken from the BioGrace GHG calculation tool (version 4b) (BioGrace 2012). Given that the soybean seed emission factor was not provided by BioGrace, its calculation was based on the land area required to produce the seed quantity needed to plant 1 ha. Finally, the estimated factor was multiplied by the overall emissions.
Direct and indirect (i.e. volatilization of N as ammonia (NH3) and leaching to groundwater) nitrous oxide (N2O) emission estimates from the use of N fertilizers were based on the BioGrace GHG calculation tool (version 4b). This takes into account the quantities of N fertilizers applied, grain yield and the seed moisture content (BioGrace 2012). All estimations made in the context of the aforementioned tool were according to the IPCC methodology Tier 1, on the estimation of N2O emissions from managed soils (IPCC Reference Eggleston, Buendia, Miwa, Ngara and Tanabe2006). The resulting N2O emissions were converted to CO2 equivalents (CO2e) by multiplying them by the 298 (g CO2e/kg) emission factor. Finally, the emissions were multiplied by the applied N fertilizer (kg/ha).
Overall GHG emissions during the cultivation phase were estimated by summing the emissions from fuel consumption, irrigation, inputs and N2O emissions. The final step of the analysis included the typical cultivation emission estimation per MJ of biodiesel produced (g CO2e/MJbiodiesel). This was accomplished by taking into account the seed yield (kg/ha) adjusted for seed moisture (%) and the oil content (g/kg) in order to estimate oil yield, which was afterwards converted to biodiesel yield according to the conversion efficiency of plant oil to biodiesel of 0·98 (Janaun & Ellis Reference Janaun and Ellis2010):
 $$\eqalign{ & {\rm Oil}\ {\rm yield}\ {\rm (kg}/{\rm ha)} = {\rm Seed}\ {\rm yield}\ ({\rm kg}/{\rm ha}) \cr& \qquad \qquad \qquad \qquad \times {\rm oil}\ {\rm content}/{\rm 1}000 \cr& {\rm Biodiesel}\;{\rm yield}\ ({\rm kg}/{\rm ha}){\rm} = {\rm Oil}\ {\rm yield}\ ({\rm kg}/{\rm ha}) \times 0 \times {\rm 98}} $$
Oil contents used in the above equation were 425, 426 and 209 g/kg for sunflower, rapeseed and soybean, respectively, while sunflower oil content under dry conditions was 355 g/kg (Skoulou et al. Reference Skoulou, Mariolis, Zanakis and Zabaniotou2011).
The energy of biodiesel (E biodiesel) produced and the typical emissions calculations are shown below:
 $$\eqalign{E_{{\rm biodiesel}} {\rm (MJ}/{\rm ha)} = \ & {\rm biodiesel}\ {\rm yield}\ ({\rm kg}/{\rm ha}) \cr & \times {\rm biodiesel ' s} \; {\rm LHV}\;({\rm 37} \times {\rm 2}\ {\rm MJ}/{\rm kg})} $$
followed by the typical emission estimation:
 $$\eqalign{ & {\rm Typical} \ {\rm emissions}\ ({\rm g} \; {\rm CO}_{\rm 2} {\rm e}/{\rm MJ}_{{\rm biodiesel}} ) \cr & \quad = {\rm Total}\ {\rm emissions}\ ({\rm g} \; {\rm CO}_{\rm 2} {\rm e}/{\rm ha})/E_{{\rm biodiesel}} \ ({\rm MJ}/{\rm ha})} $$
Finally, the energy allocation factor (AF) expressed in g CO2e/MJbiodiesel for each crop (0·63 for sunflower, 0·59 for rapeseed and 0·33 for soybean) during the cultivation phase was used in order to allocate the emissions to possible co-products (BioGrace 2012). The AF deals with the distribution of emissions (or environmental burdens in general) between the biofuel and its co-products. The emissions are being allocated to the generated co-products and due to this the environmental impact of the produced biofuel is reduced.
 $$\eqalign{ & {\rm Allocated} \ {\rm typical}\ {\rm emissions}\ ({\rm g} \; {\rm CO}_{\rm 2} {\rm e}/{\rm MJ}_{{\rm biodiesel}} ) \cr & \quad = {\rm Typical} \ {\rm emissions}\ ({\rm g} \; {\rm CO}_{\rm 2} {\rm e}/{\rm MJ}_{{\rm biodiesel}} ) \times {\rm AF}} $$
Estimation of GHG beyond the cultivation phase
Greenhouse gas emissions for feedstock transport to the processing plant, biodiesel production and its final distribution were also estimated on the basis of the GHG calculation tool provided by BioGrace. Seed transportation to the biodiesel plant and distribution of the biodiesel were estimated using average distances of 50 and 300 km, respectively. Finally, the typical emissions beyond and during the cultivation phase were aggregated in order to estimate the total typical emissions during biodiesel production.
Emission savings
Following the estimation of total typical GHG emissions (during and beyond the cultivation phase) from biodiesel production, a comparison of equal amounts of conventional diesel and biodiesel produced was conducted. The aim of this comparison was to present the emission reduction (%) derived from the biodiesel production of each crop in each region. To this end, the energy contents of diesel (36 MJ/l) and biodiesel (33 MJ/l), were multiplied by the diesel's emission factor (83·8 g CO2e) and the total typical emissions, respectively (EC 2009).
RESULTS
Questionnaire results
Yields and field operations for all regions during sunflower, rapeseed and soybean production, based on the questionnaires of the survey, are presented in Tables 1–3. Seeding rate for each crop was the same for all regions, i.e. 5 kg/ha for sunflower, 5 kg/ha for rapeseed and 35 kg/ha for soybean.
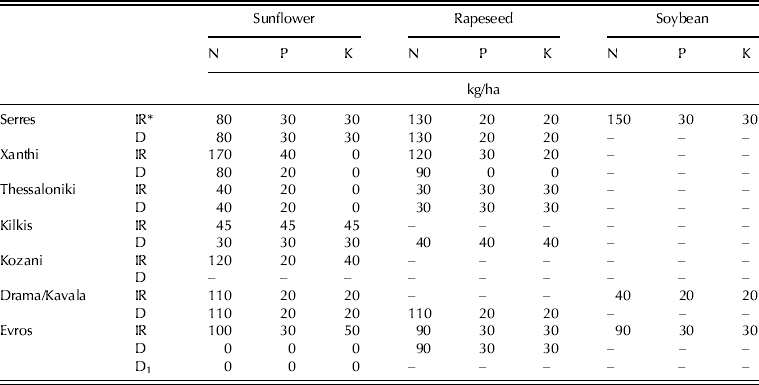
All three crops yielded satisfactorily. Average yields were 2919, 2310 and 2933 kg/ha for sunflower, rapeseed and soybean, respectively. Field operations applied also included the number of irrigations (Tables 1–3). The average number of field operations was estimated at 7·9 for sunflower, 6·7 for rapeseed and 10·0 for soybean. Rapeseed demanded fewer field operations as compared with the other crops, due mainly to the lower number of irrigations (only winter types of rapeseed are grown in Greece). Fertilization was another important factor towards estimating the final GHG emission levels. The applied quantities of N, P and K fertilizers are presented in Table 5.
Applied fertilizer rates
* IR, D and D1 stand for irrigated, non-irrigated and areas with prolific soils and high precipitation, respectively.
GHG emission estimates at cultivation
The GHG emission differences among crops due to diesel consumption were small. Average emissions for sunflower, rapeseed and soybean were 393·3, 372·7 and 393·9 kg CO2e/ha, respectively. As expected, the fewer field operations for rapeseed production were accompanied by lower emissions. The average diesel emissions for sunflower were 410·8 and 375·8 kg CO2e/ha for irrigated and non-irrigated areas, respectively, whereas the emissions for rapeseed were 371·6 kg CO2e/ha for irrigated and 373·5 kg CO2e/ha for non-irrigated areas. Soybean is grown only under irrigated conditions. The emission difference between irrigated and non-irrigated sunflower regions resulted from the farmers’ efforts to reduce moisture losses when cultivating under dry conditions by minimizing soil cultivation operations. The lowest emissions estimated for sunflower were 298·6 kg CO2e/ha for both irrigated and non-irrigated fields in the Evros prefecture, where only five field operations were applied during the cultivation period. The respective highest emissions were 496·5 kg CO2e/ha for irrigated areas in the Kozani prefecture. The lowest emissions in the case of rapeseed were estimated at 308·0 kg CO2e/ha for the Serres prefecture (five field operations applied), whereas the highest emissions were estimated at 424·3 kg CO2e/ha for the Evros prefecture. Rapeseed demonstrated almost equal diesel emissions between irrigated and non-irrigated areas, due to the fact that it constitutes a winter crop with more or less fixed farming practices. Farmers are not so concerned about minimizing field operations since the rainy period is expected to come shortly after the preparation of the seedbed. Finally, the lowest and highest emissions for soybean were 345·7 kg CO2e/ha in the Evros and 449·4 kg CO2e/ha in the Drama-Kavala prefectures, respectively.
The average emissions derived from irrigations were estimated at 664·6, 325·0 and 954·8 kg CO2e/ha for sunflower, rapeseed and soybean, respectively. Soybean comprised the most demanding crop in terms of energy requirements for irrigation, since its production under Greek conditions requires large quantities of water (at least three irrigations during the cultivation period). Rapeseed was the least demanding crop, since the precipitation during its cultivation period is high and irrigations are applied in only a few regions. Greenhouse gases emitted due to seed quantities applied were also included in the overall estimation of emissions. The seed rates were the same for rapeseed and sunflower (5 kg/ha), resulting in 3·7 kg CO2e/ha for all regions, while the estimated seed factors for soybean were 1·013, 1·010 and 1·012 for Drama-Kavala, Evros and Serres, respectively.
Emissions from the pesticides applied were estimated at 27·6 kg CO2e/ha for rapeseed and 22 kg CO2e/ha for soybean, based on the recommended application regimes that suggest 2·5 and 2 kg/ha of herbicides, respectively. The emissions for sunflower were 55 kg CO2e/ha for pre-emergence applications (5 kg/ha) and 11 kg CO2e/ha for post-emergence applications (1 kg/ha). A major factor contributing to the total GHG emitted were emissions from fertilizer applications. Nitrogen fertilizers affected total fertilizer emissions the most, since their application corresponded to a significantly higher emission factor (BioGrace 2012). The highest emission quantity due to fertilizer application was 1046·5 kg CO2e/ha for sunflower production in irrigated fields of the Xanthi prefecture, where the highest amount of N fertilizers were used.
Nitrous oxide emissions ranged from 214·6 to 1379·7 kg CO2e/ha for sunflower, 327·8 to 1200·9 kg CO2e/ha for rapeseed and 467·9 to 1162·2 kg CO2e/ha for soybean. The highest N2O emissions (1379·7 kg CO2e/ha) for all crops, as expected, were estimated for sunflower under irrigated conditions in the Xanthi prefecture where 170 kg/ha of N fertilizer were applied. The lowest emissions (214·6 kg CO2e/ha) were estimated for sunflower under dry conditions, mainly due to the absence of fertilizer use in the Evros prefecture. The above results were expected, since fertilizer use is higher in crops grown under irrigated conditions, owing to higher N leaching.
Typical emissions
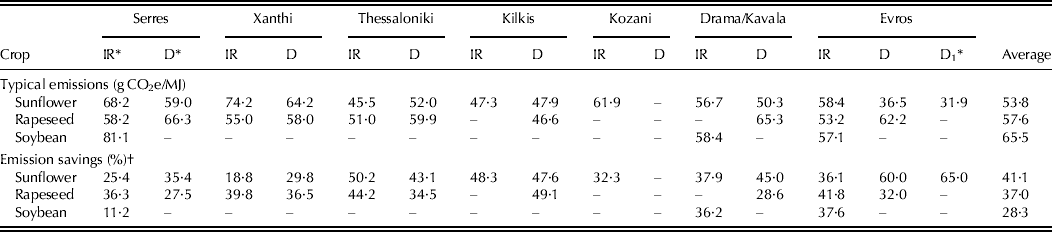
Typical emissions for all crops and irrigation practices are presented in Table 6. The average typical emissions were 53·8, 57·6 and 65·5 g CO2e/MJbiodiesel for sunflower, rapeseed and soybean, respectively (Table 6). Soybean grown in the Serres prefecture and sunflower grown in the Xanthi prefecture demonstrated the highest typical emissions, due mainly to the number of irrigations and the large quantities of N fertilizers applied. The lowest typical emissions were observed for sunflower grown under dry conditions (D1) (Table 1) in the Evros prefecture. In this case, the absence of fertilizer application and irrigation did not significantly affect the final yields, due to the region's fertile soils with high organic content and the high precipitation that usually occurs. Sunflower grown in the Thessaloniki prefecture was also characterized by low typical emissions (46 g CO2e/MJbiodiesel), requiring only two irrigations to achieve high yields (i.e. 4000 kg/ha) even at moderate fertilizer regimes.
Typical emissions during the cultivation phase, and the respective emission savings derived from the substitution of fossil diesel by biodiesel
* IR, D and D1 stand for irrigated, non-irrigated and areas with prolific soils and high precipitation, respectively.
† Corresponds to the per cent GHG reduction by replacing diesel with biodiesel.
Greenhouse gas estimations for biodiesel production
Greenhouse gas emissions for the transport of sunflower, rapeseed and soybean seeds to the processing plant were estimated at 0·18, 0·18 and 0·21 g CO2e/MJbiodiesel, respectively. The processing stage included the oil extraction where emissions were estimated at 3·8 g CO2e/MJbiodiesel for sunflower and rapeseed and 7·6 g CO2e/MJbiodiesel for soybean, whereas emissions during oil refining and transesterification were estimated at 1·01 and 16·8 g CO2e/MJbiodiesel, respectively, for all crops. Emissions from biodiesel transport to the filling station (300 km) and energy consumed were estimated at 0·8 and 0·4 g CO2e/MJbiodiesel, respectively, for all the three crops. The overall emissions during this phase were 23·4 g CO2e/MJbiodiesel for sunflower biodiesel production, whereas the emissions were 23·4 g CO2e/MJbiodiesel for rapeseed biodiesel and 26·8 g CO2e/MJbiodiesel for soybean biodiesel.
Emission savings
Emission savings (%) derived from substituting conventional diesel with biodiesel are presented in Table 6. The results indicated that most of the farming practices and crops examined comply with the 35% (until 2017) target set by the European Parliament and the Council. Considering the default GHG emission saving limits for each crop, sunflower was successful in reaching the target (51%) in the Evros prefecture under dry and semi-dry conditions. In the Thessaloniki prefecture, the emission saving limit was almost achieved under irrigated conditions and the percentages were also very close to the legislated targets in many other regions. Lechon et al. (Reference Lechon, Cabal, De La Rua, Caldes, Santamaria and Saez2009) have also demonstrated sunflower as an efficient option for biodiesel production in Spain, thanks to the estimated high emission savings. Rapeseed and soybean default GHG emission saving limits (38 and 31%, respectively) were more easily achieved, as presented in Table 6.
Operation emission contributions
Nitrogen fertilization, followed by irrigation and diesel consumption during agronomic operations, was the highest contributor to total GHG emissions. The application of N fertilizers and the subsequent N2O emissions ranged from 39 to 1% for sunflower, 42 to 83% for rapeseed and 34 to 54% for soybean, with averages of 57, 68 and 47%, respectively. The contribution of emissions from irrigation ranged from 12 to 37% for sunflower, 8 to 26% for rapeseed and 28 to 41% for soybean, while the respective averages were estimated at 25, 16 and 34%. The emissions from diesel consumed were influenced by the lack of irrigations and so they appeared to be higher when estimated for dry lands. The averages were 26% for sunflower (16% for irrigated areas and 36% for dry areas), 22% for rapeseed (17% for irrigated areas and 25% for dry areas) and 15% for soybean.
DISCUSSION
Sustainability constitutes the key issue in contemporary agriculture. Sustainability criteria are of crucial importance, especially for bioenergy crops, since the comparison between the produced biofuel and the substituted fossil fuel has to be environmentally affordable. Several studies have been conducted in order to estimate the energy consumption, the respective GHG emissions linked to crop production and the emission savings. In that context, Korres et al. (Reference Korres, Singh, Nizami and Murphy2010) studied the sustainability of biomethane produced from grasses. The parameters studied were the consumed energy in total, the respective emissions and the final emission savings achieved. In another study Panoutsou et al. (Reference Panoutsou, Namatov, Lychnaras and Nikolaou2008) compared diesel with biodiesel and found that the replacement of conventional diesel resulted in important GHG emission savings (144 g CO2e/MJ), proving biodiesel's sustainability. The energy balance of biodiesel production from sunflower has also been studied under Greek conditions. Energy inputs were estimated as direct energy, which corresponded to the consumed energy during the cultivation of the crop and as indirect energy that refers to the consumed energy during the production of inputs, such as seeds, fertilizers, herbicides, etc. (Kallivroussis et al. Reference Kallivroussis, Natsis and Papadakis2002).
The aims of the present study were to estimate the emissions during the cultivation phase of each crop, the typical emissions and the emission savings from substituting fossil diesel with biodiesel and finally the contribution of each operation to the total emissions.
In terms of typical GHG emissions, the averages for all regions were estimated at 53·8, 57·6 and 65·5 g CO2e/MJ for sunflower, rapeseed and soybean, respectively. A relevant study conducted by Cotana et al. (Reference Cotana, Barbanera and Fantozzi2010) reported that the respective emissions were estimated at 67 g CO2e/MJ for rapeseed and 50 g CO2e/MJ for sunflower. A comparison of these findings showed that the GHG emitted from sunflower biodiesel production were similar to those estimated in the present study, while the emissions from rapeseed biodiesel production were significantly higher, mainly due to low yields achieved (1·9 t/ha). As expected, the typical emissions derived from soybean biodiesel production were higher, mainly affected by the excessive water demands of the crop.
In terms of emission reduction (%), biodiesel from rapeseed reached the default GHG emission saving limit of 38% set by the EU in many regions (EC 2009). Comparison of the currently applied farming practices showed significant differences among regions, mainly attributed to applied N fertilizer rates and the subsequent N2O emissions. Thus, the emission savings in Thessaloniki's irrigated and Kilkis’ rainfed areas were very satisfactory. As expected, another factor that significantly influenced emission savings was the high yield achieved in regions such as Evros and Xanthi (irrigated conditions). Sunflower is a well-established crop in many regions of the country and could be exploited widely for biodiesel production, with modifications to farming practice as required. The present results showed that biodiesel produced from sunflower demonstrated high emission savings in regions with low or no N fertilizer input. Sunflower can be grown without the application of fertilizers in regions such as Evros due to the fact that specific areas of this prefecture are characterized by rich soils with high organic content. Furthermore, the Evros prefecture is located in the northern part of the country where the precipitation is higher than in other regions. Finally, soybean succeeded in complying with the EU targets (31%) due to the high-energy content of its co-product (i.e. cake), even though it constitutes a high-input crop (BioGrace 2012). The average emission saving for the three regions studied were 28·3%, mainly affected by the extremely low emission reduction (11·2%) of the Serres region. High emission savings from soybean biodiesel production have also been reported by Hill et al. (Reference Hill, Nelson, Tilman, Polasky and Tiffany2006), at 41%. In this sense, soybean could be viably used as a biodiesel feedstock in the framework of an integrated production, which includes the use of the residue for livestock feed.
The emission contribution of each field operation constitutes an important guide to improving farming practices so as to minimize overall emissions. It was found that field operations related to diesel consumption did not contribute to overall emissions significantly. However, irrigation, N fertilizer application and the subsequent N2O emissions could be the decisive factors in rendering a biofuel as sustainable. These results agree with those of Maraseni et al. (Reference Maraseni, Mushtaq and Maroulis2009), who estimated the GHG emissions from rice (Oryza sativa L.) farming in eight countries, taking into account the different practices, and concluded that irrigation methods affected the emissions significantly during the cultivation phase. A similar study was conducted for cotton and revealed considerable differences between GHG emissions from irrigated and non-irrigated fields (due to electricity use for irrigation) and higher N fertilizer applications in irrigated fields (Maraseni et al. Reference Maraseni, Cockfield and Maroulis2010).
In general, growing techniques play a major role when estimating inputs since they vary widely from region to region. The results indicated that, for the time being and with the farming practices currently applied, rapeseed is the best crop choice for biodiesel production due its lower input requirement and the high oil content. However, sunflower could also constitute an important feedstock for the Greek biodiesel industry. Further effort should be made to improve sunflower cultivation techniques: lower applied inputs were possible in some regions. Finally, soybean could be placed in this context only by exploiting its co-products, which are of high importance as feed. In this context, biodiesel production in Greece and in the Mediterranean basin in general could be sustainable when applying the appropriate farming practices so as to maximize the input∶output ratio.