Introduction
Polynyas are ice-free or thin-ice areas that appear within a vast ice cover in the polar oceans. They are of interest to polar oceanography, because they greatly change the nature of air-sea interaction in the ice-covered regions. Heat and vapor transport from the open-water surface can lead to local climatologic modifications, and the ice-free area can be an oasis for biological activity.
Cosmonaut Polynya has been frequently observed around 66° S, 45° E off Enderby Land from satellites since 1973 (Reference Comiso and GordonComiso and Gordon, 1987). However, there are only very few oceanographic observations in this area. The cruise track of the Japanese Antarctic research vessel Shirase has crossed the polynya area since 1987, which gives an accumulation of oceanographic data.
As a part of the Japanese Antarctic Climate Research program, we conducted an air-sea interaction study in 1990–92. One of the major objects of this program was to clarify the formation and maintenance mechanisms for Cosmonaut Polynya. The greater part of available oceanographic data in this area is the water temperature with XBT in austral summers. In this paper, on the basis 298 of the water-temperature data obtained by the japanese Antarctic Research Expedition (JARE) with XBT for the 1987–92 austral summers and the SSM/I images during 1987–91, we describe the results of the thermal structure of the Cosmonaut Polynya region and some features appearing on the SSM/I images. We could not avoid inferring the winter sea conditions from summer data. However, it is reasonable that the intermediate and deep waters retain winter characteristics, because the summer heating is most likely limited to the surface layer.
Thermal structure
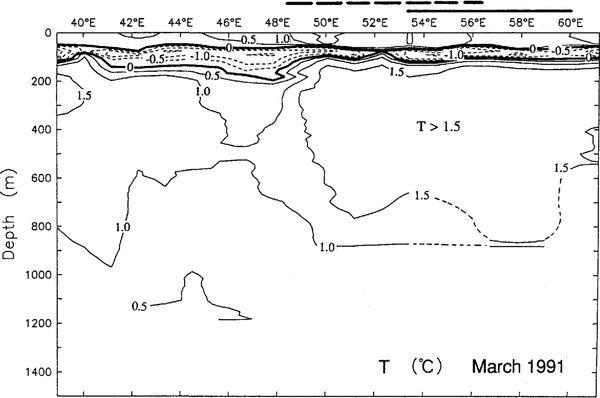
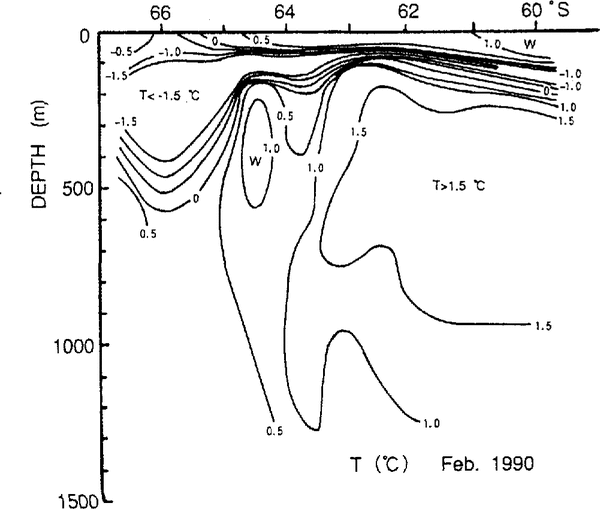
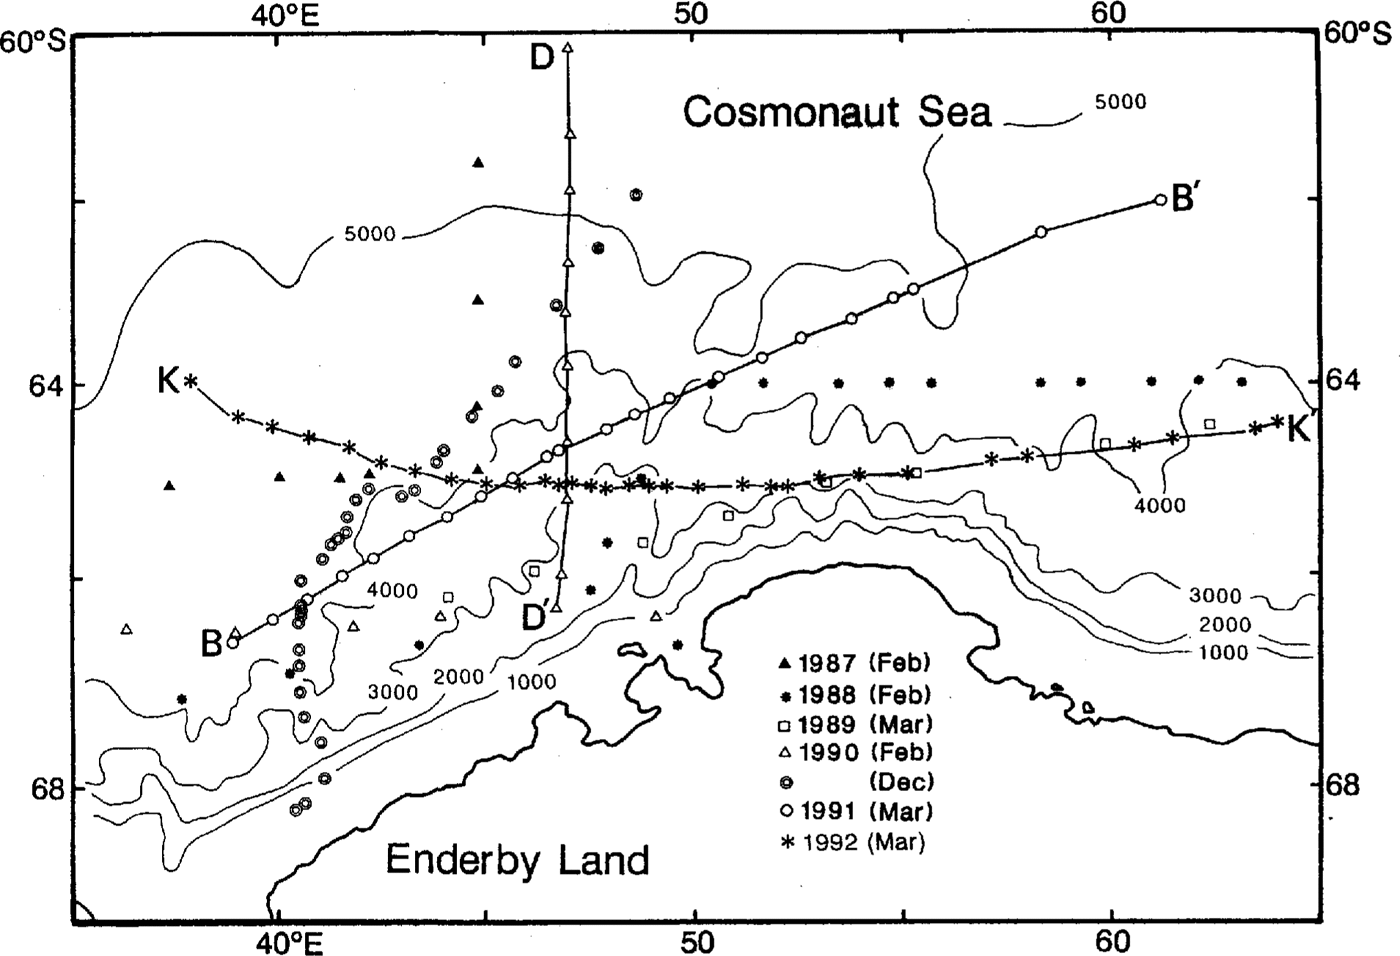
Figure 1 indicates locations of XBT stations during 1987–92 used in this study. The XBT observations were restricted to one transect each year, but two transects were obtained in 1990. Three sections D-Dʹ, in 1990, B-B' in 1991 and K-K' in 1992 in the figure were taken for the purpose of traversing the Cosmonaut Polynya area. The XBT observations along these sections were carried out at short intervals, so that we could see the detailed temperature structure. The cast-west temperature sections in March 1991 (B-B') and 1992 (K-K') arc illustrated in Figures 2 and 3, respectively. The Circumpolar Deep Water (CDW) with a temperature higher than l.0°C is found between about 150 and 1000m depth except at 45-50° E. The north-south temperature section in February 1990 is shown in Figure 4. The CDW is seen in the north of the Section, and cold water with a temperature below –1.5°C is located at a depth of about 100–400 m around 66° S. This cold water is the Winter Water (WW) formed by cooling during winter. The shallowing of the 1.0°C isopleth at about 63° S suggests the upwelling of CDW. Figures 2–4 show typical examples and the other sections which are not presented here indicate a similar structure.
Locations of XBT stations. The depth contour interval is 1000m.The sections D-D', B-B' and K-K' were obtained in 1990, 1991 and 1992, respectively.
Temperature section along line B-B' in Figure 1. March 1991. Heavy, solid and dashed lines above the abscissa indicate the locations of Cosmonaut Polynya appearing in Figures 9c and 10b, respectively.

Temperature section along line K-K in Figure 1. March 1992. Heavy, solid and dashed lines above the abscissa indicate the locations of Cosmonaut Polynya.appearing in Figures 9c and lOb, respectively.

Temperature section along line D-D' in Figure 1. February 1990

Temperature distribution on the 200m sUrface which was composed of the data during 1987–92.
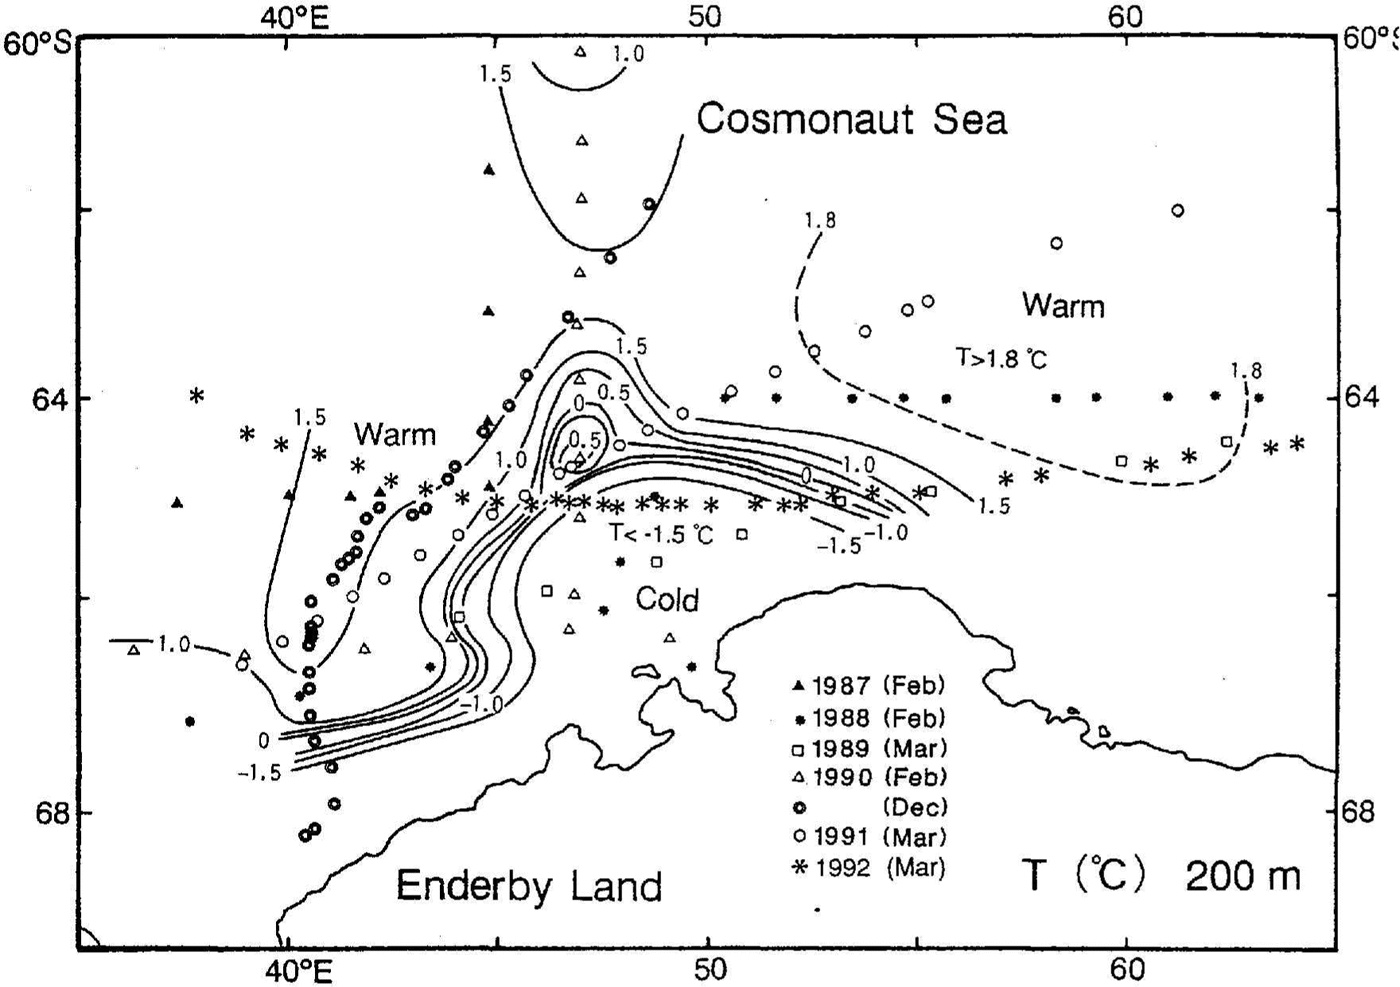
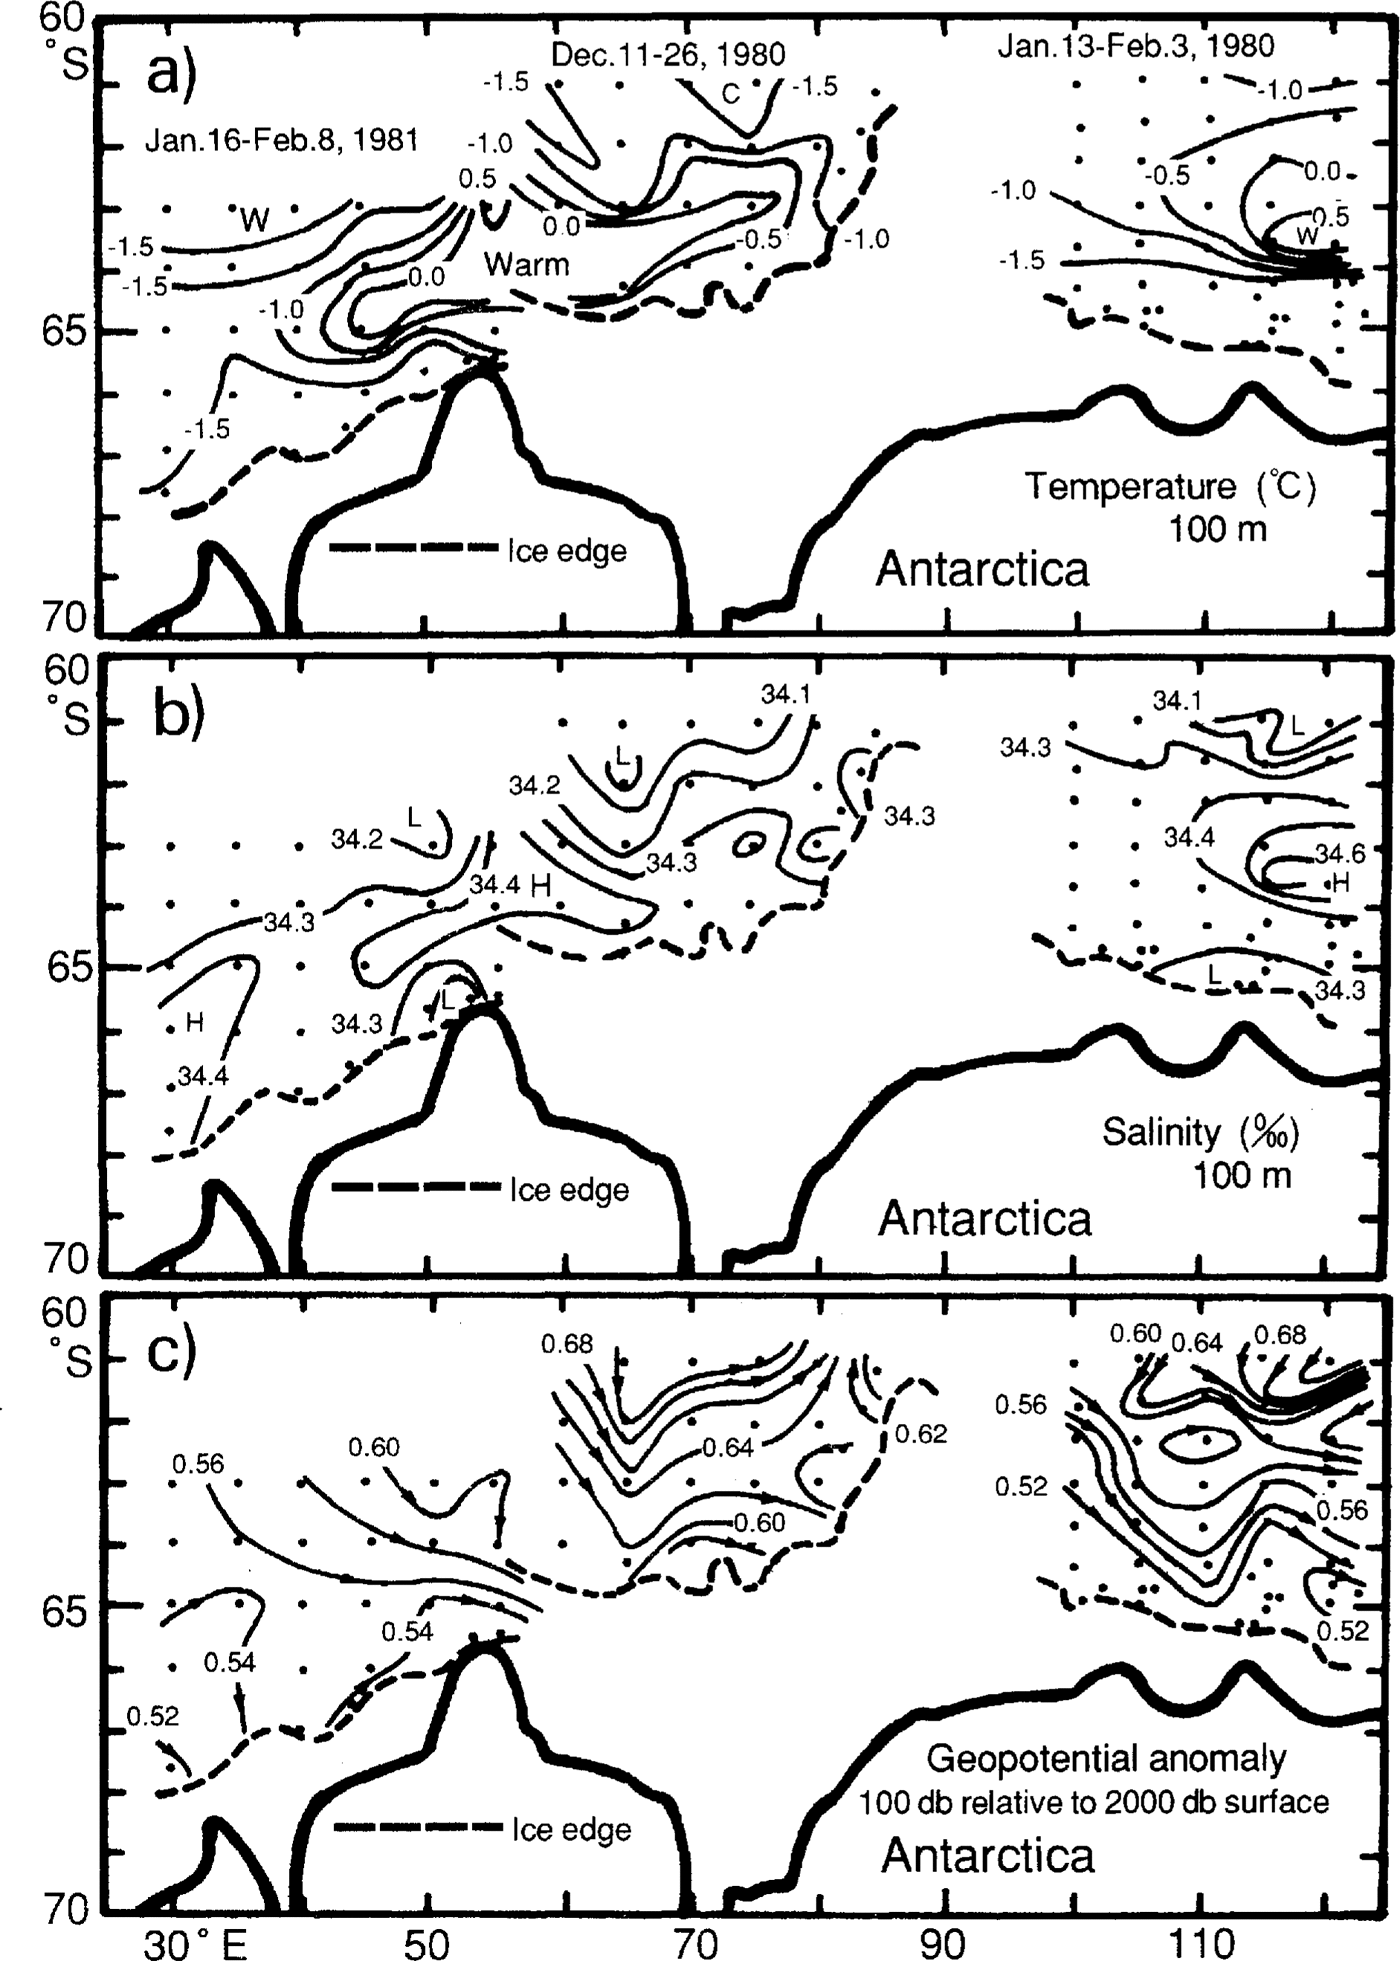
illustrates the horizontal temperature distribution on the 200 m surface which was composed of all the data during 1987–92. The cold WW with a temperature below –1.5°C spreads over the continental shelf region and it extends offshore along the bottom topography at 45-50°E (see Fig. 1). On the offshore side of it, CDW is present. Reference KhimitsaKhimitsa (1976) showed the geostrophic circulation over 30–95° E in the Cosmonaut Sea in the austral summer and winter of 1972–73. A strong meandering eastward flow was demonstrated at 60–68° S. He pointed out that the bottom topography was responsible for the meandering. Although no temperature distribution was given in his paper, it is inferred that CDW intruded southward about 45° and 60°Reference NaganobuE. Naganobu (1991) showed a similar flow pattern in the austral summer of 1980–81 (Fig. 7c). Hence, it is reasonably concluded that the warm area in Figure 5 is a manifestation of the flow of CDW. As described later, this indicates that the warm area is a pre-conditioned area for polynya generation.
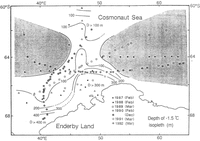
Horizontal distribution of depth of the –1.5°C isopleth which was composed of the data during 1987–91. Shaded areas are the regions where the 1.5°C isopleth was not found.
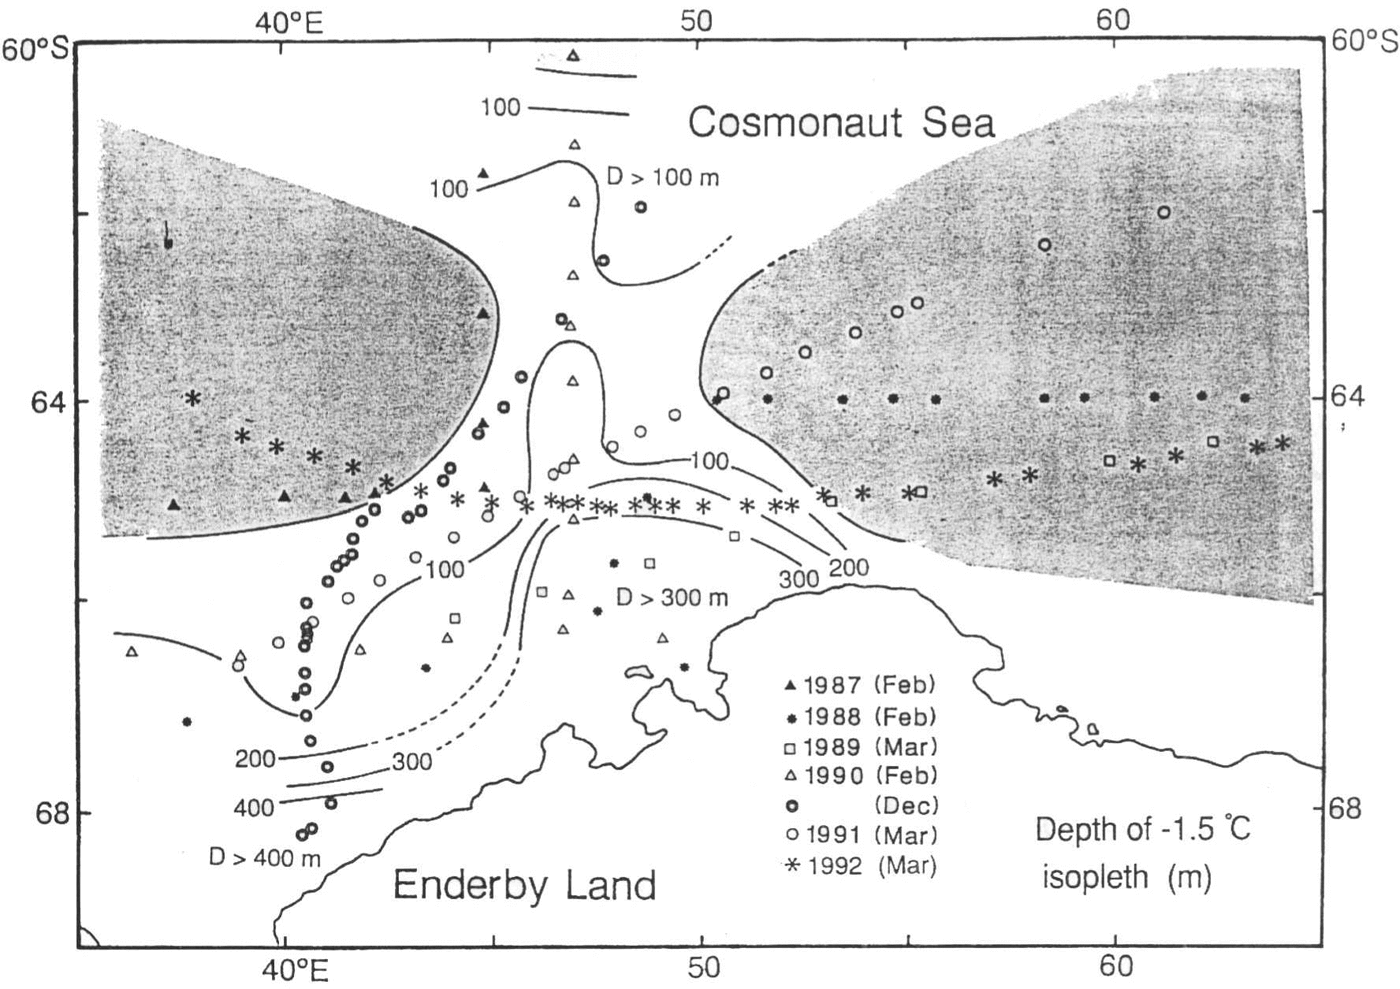
shows the horizontal distribution of depth of the –1.5°C isopleth which was composed of all the data during 1987–92. When there were two depths at the same station, the deeper one was adopted. This figure represents the thickness of WW. An area deeper than 300 m is found along the coast. The thick WW is attributable to the pile-up of WW by Ekman transport due to the predominant easterly wind in the coastal region and/or to active winter cooling there. At present, however, we cannot evaluate which is more substantial, because of insufficient data. To the north of 65° S, there are two areas where the –1.5°C isopleth was not observed (shaded areas in Figure 6).
Cosmonaut Polynya is believed to be a typical sensible-heat polynya. Reference Comiso and GordonComiso and Gordon (1987) elucidated the existence of localized doming of the pycnocline in the Cosmonaut Sea. This brings warmer and saltier CDW closer to the sea surface, which is an effective pre-conditioner for deep convection. The pycnocline shallowing pre-conditions the water there for polynya generation. The detailed pycnocline structure in the Cosmonaut Sea has not been investigated, because of the scarcity of temperature and salinity data. Reference Comiso and GordonNaganobu (1991) demonstrated that the warmer and saltier CDW spread zonally on the 100m surface over 30–120° E in the austral summer of 1980–81 (Fig. 7). He concluded that the shallower pycnocline zone was induced by the upwelling of CDW in the Antarctic Divergence Region (ADR). The elevated l.0°C isopleth at 63°S in Figure 4 should be traced to the shallower pycnocline. Furthermore, it is considered that the warm areas in Figure 5 were related to the upwelling of CDW at ADR.
Temperature (a) salinity (b) and geopotential anomaly (c) distributions on the 100 m surface at 30–120° E of the Southern Ocean in the austral summer 1980–81. (Naganobu, 1991).
Characteristics of the polynyas appearing on the ssm/i image
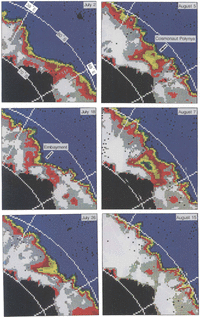
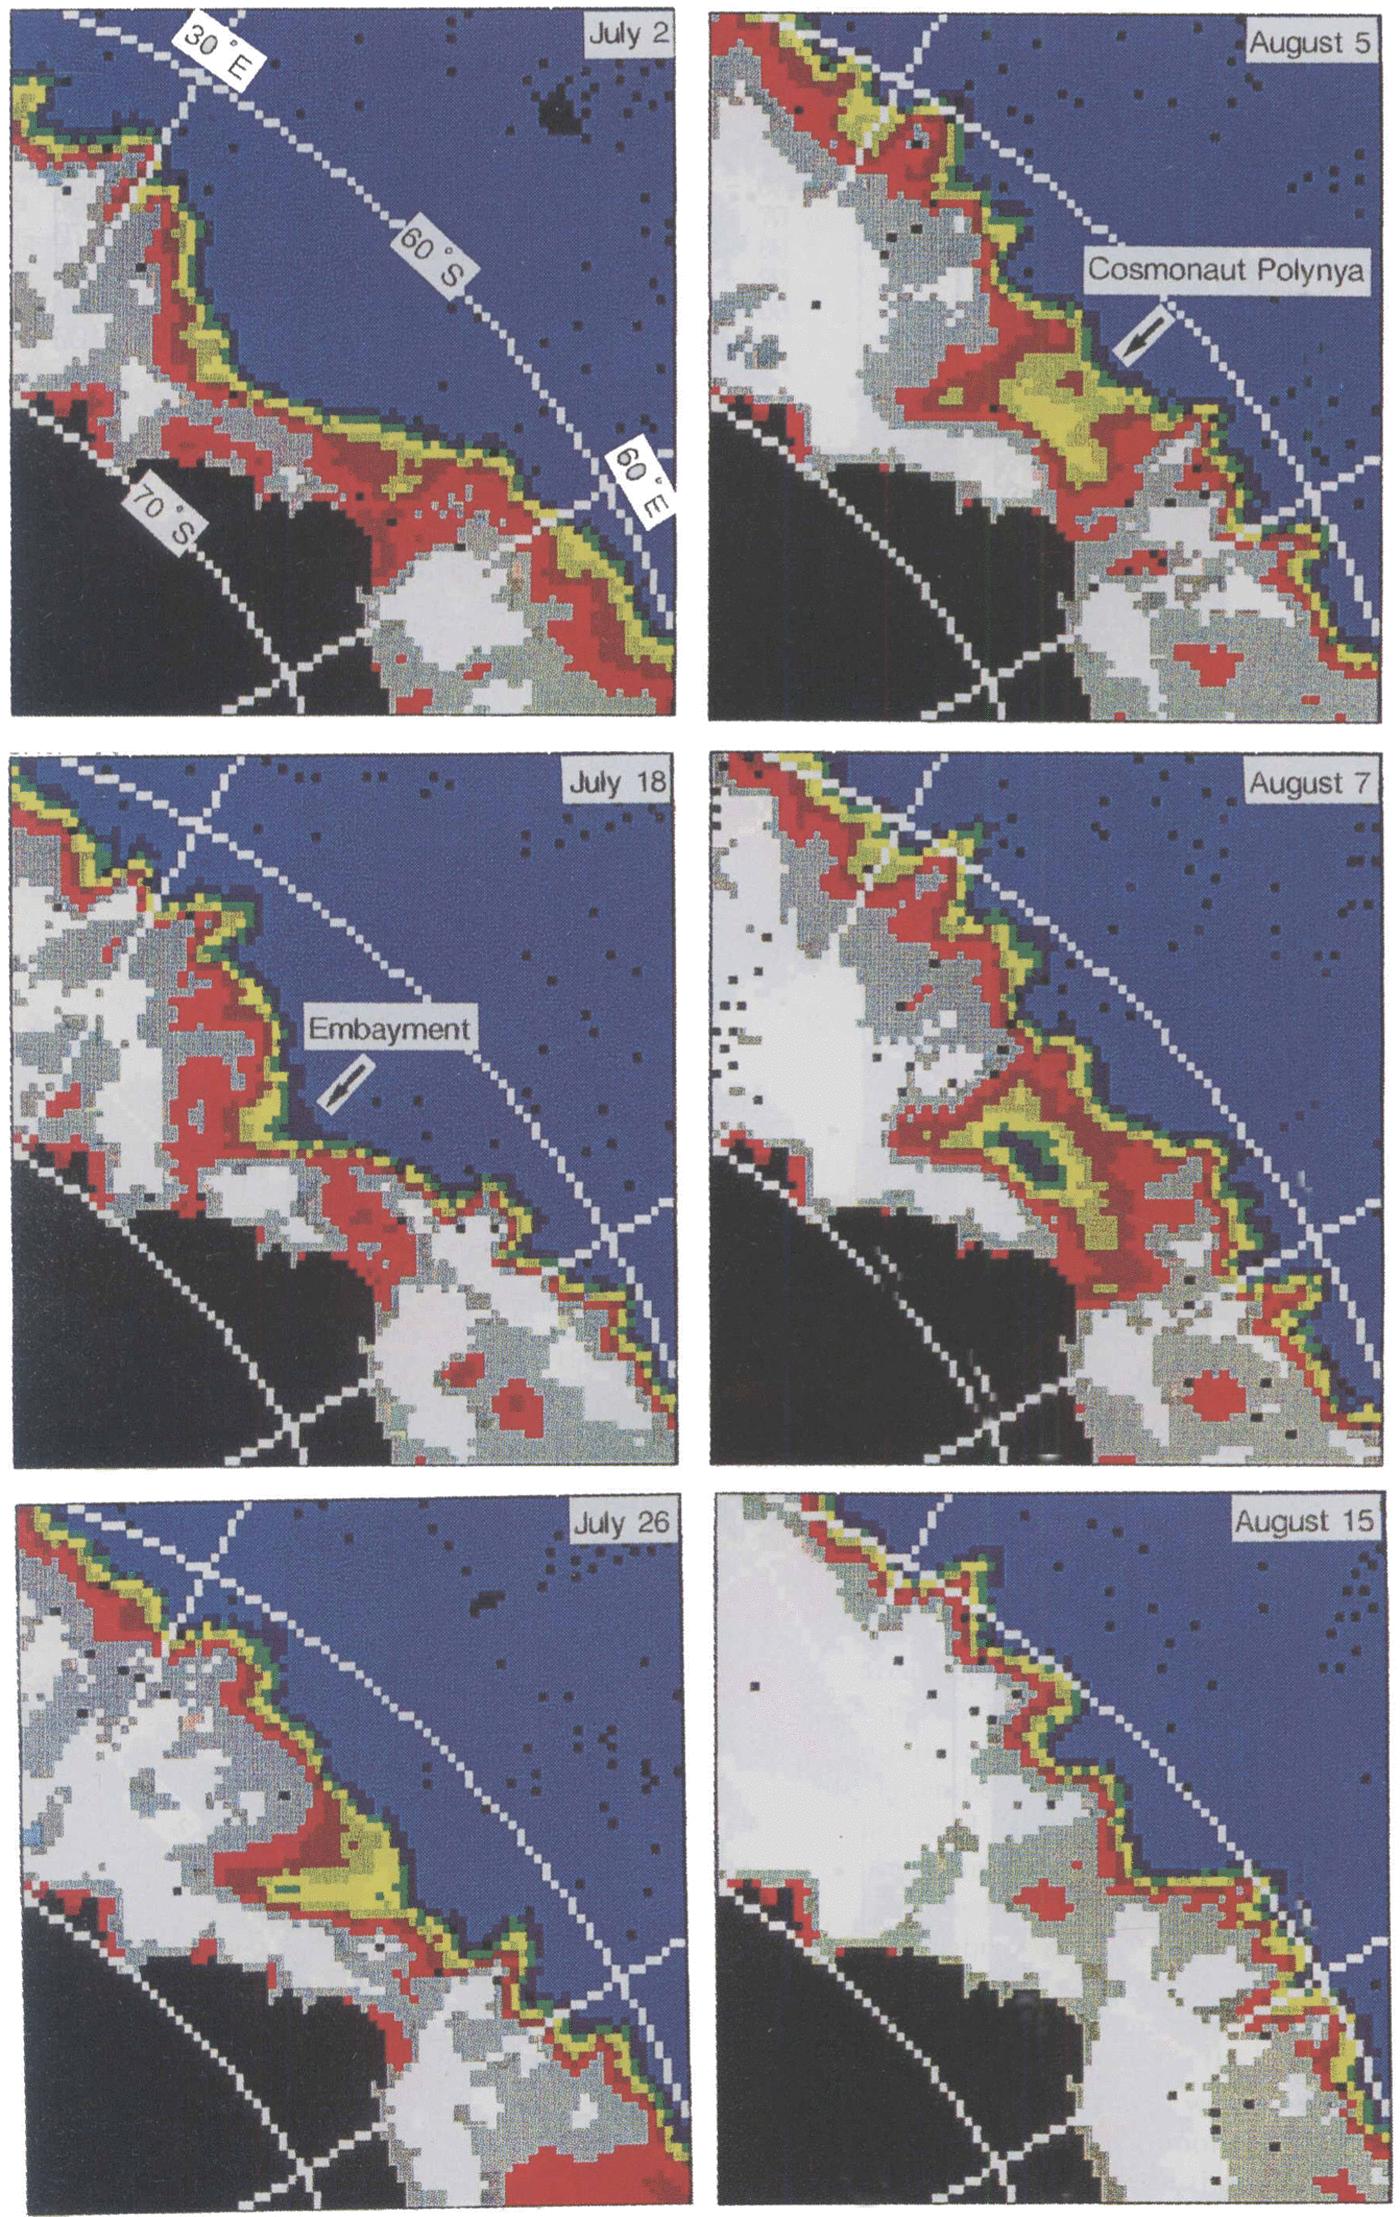
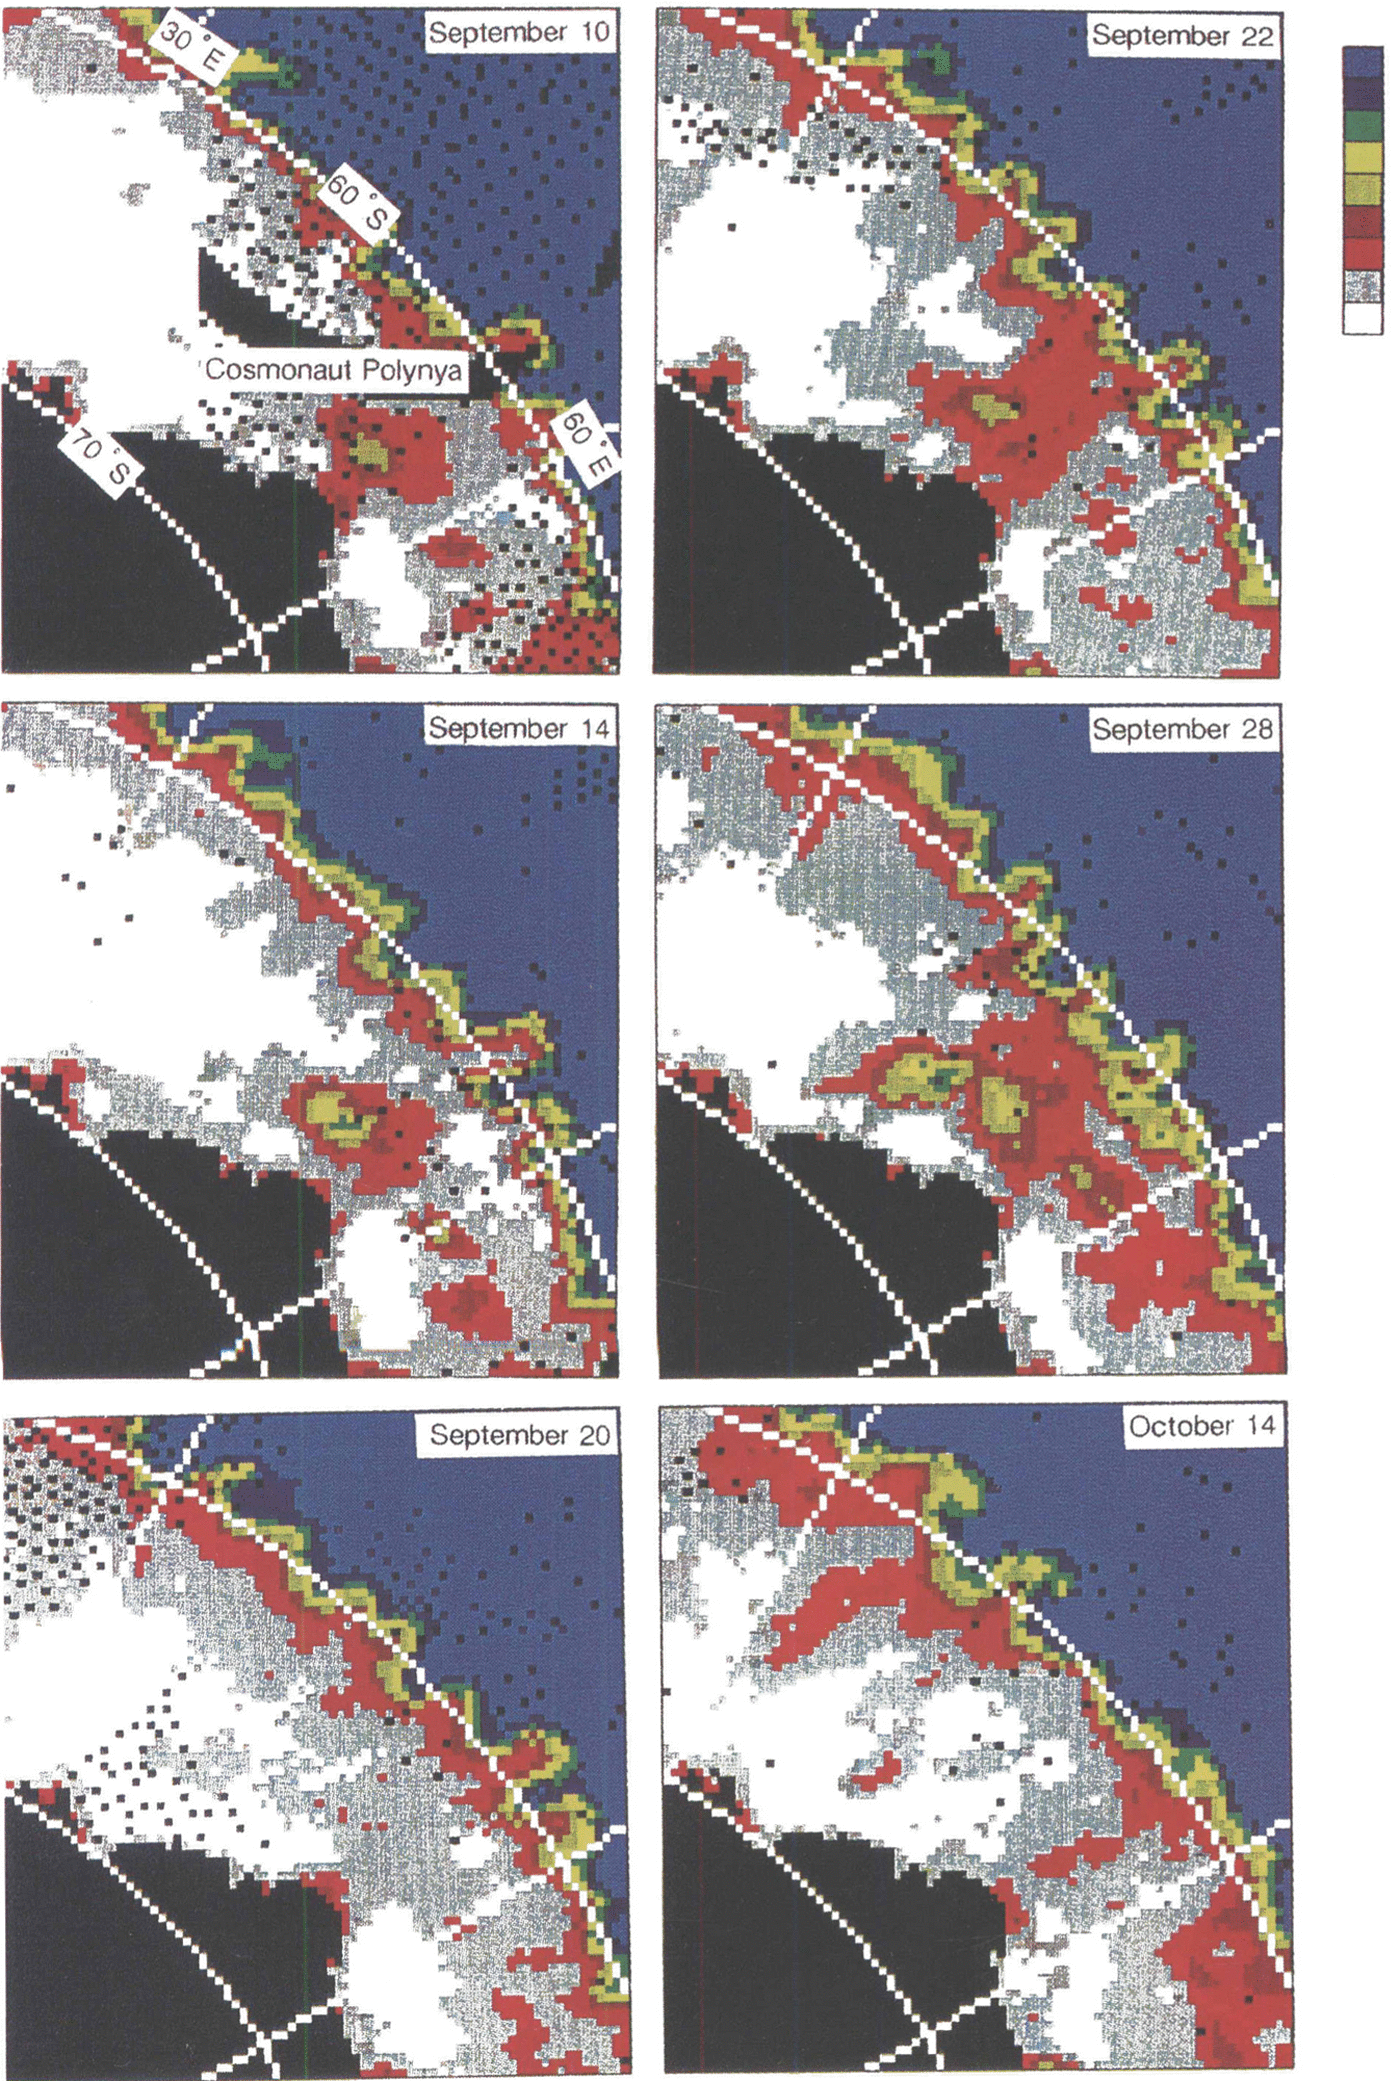
The SSM/I data used in this study were the DMSP SSM/I sea-ice concentration grids generated using the NASA Team algorithm provided by the National Snow and Ice Data Center, University of Colorado, Boulder, Colorado. We prepared a data set of ice-concentration maps during 1987 to 1991 of the sector 0–90° E in the Southern Ocean using image-processing software SSMIICE. The series of images reveals the occurrence of Cosmonaut Polynya. Figure 8 shows a sequence of images for 2 Ju1y-14 October 1988. A low ice-concentration embayment started to form at about 65° S, 45° E on 18 July. The pack-ice with a concentration of 61–80% enclosed it and Cosmonaut Polynya was completed on 7 August. After that, the polynya rapidly shrank and it became indeterminate on 15 August. This evolution is similar to that in 1980 demonstrated by Reference Comiso and GordonComiso and Gordon (1987). In 1980, Cosmonaut Polynya did not recur during the rest of the winter. In 1988, however, a large low ice-concentration area appeared on 10 September, but its location shifted somewhat to the east from the previous observation. It disappeared on 20 September hut appeared again on 22 September. The second stage of Cosmonaut Polynya persisted for a month until about 10 October. The minimum ice concentration for the totally enclosed polynya for the year was 15–30% on 7 August and 28 September.
Daily SSM/I images from 2 July to 14 October 1988.
As described above, in 1988 Cosmonaut Polynya began with the formation of an embayment of low ice-concentration area near the ice edge. On the other hand, no distinct embayment was found in 1987, 1989, 1990 and 1991. The small Cosmonaut Polynya formed suddenly within the ice cover in those years (Fig. 9) and repeated its appearance and disappearance. Thus, we can make the following statement. Polynya activities were intensive in 1988, and the typical Cosmonaut Polynya was observed; due to weaker activities, the small and sporadic Cosmonaut Polynya formed in 1987, 1989, 1990 and 1991. However, we cannot draw any clear relations between the locations of Cosmonaut Polynya and the temperature structure of previous and/or following summers.
SSM/I images showing a coastal polynya and Cosmonaut Polynya. a. 20 July 1987; b. 19 August 1989; c. 25 September 1990.
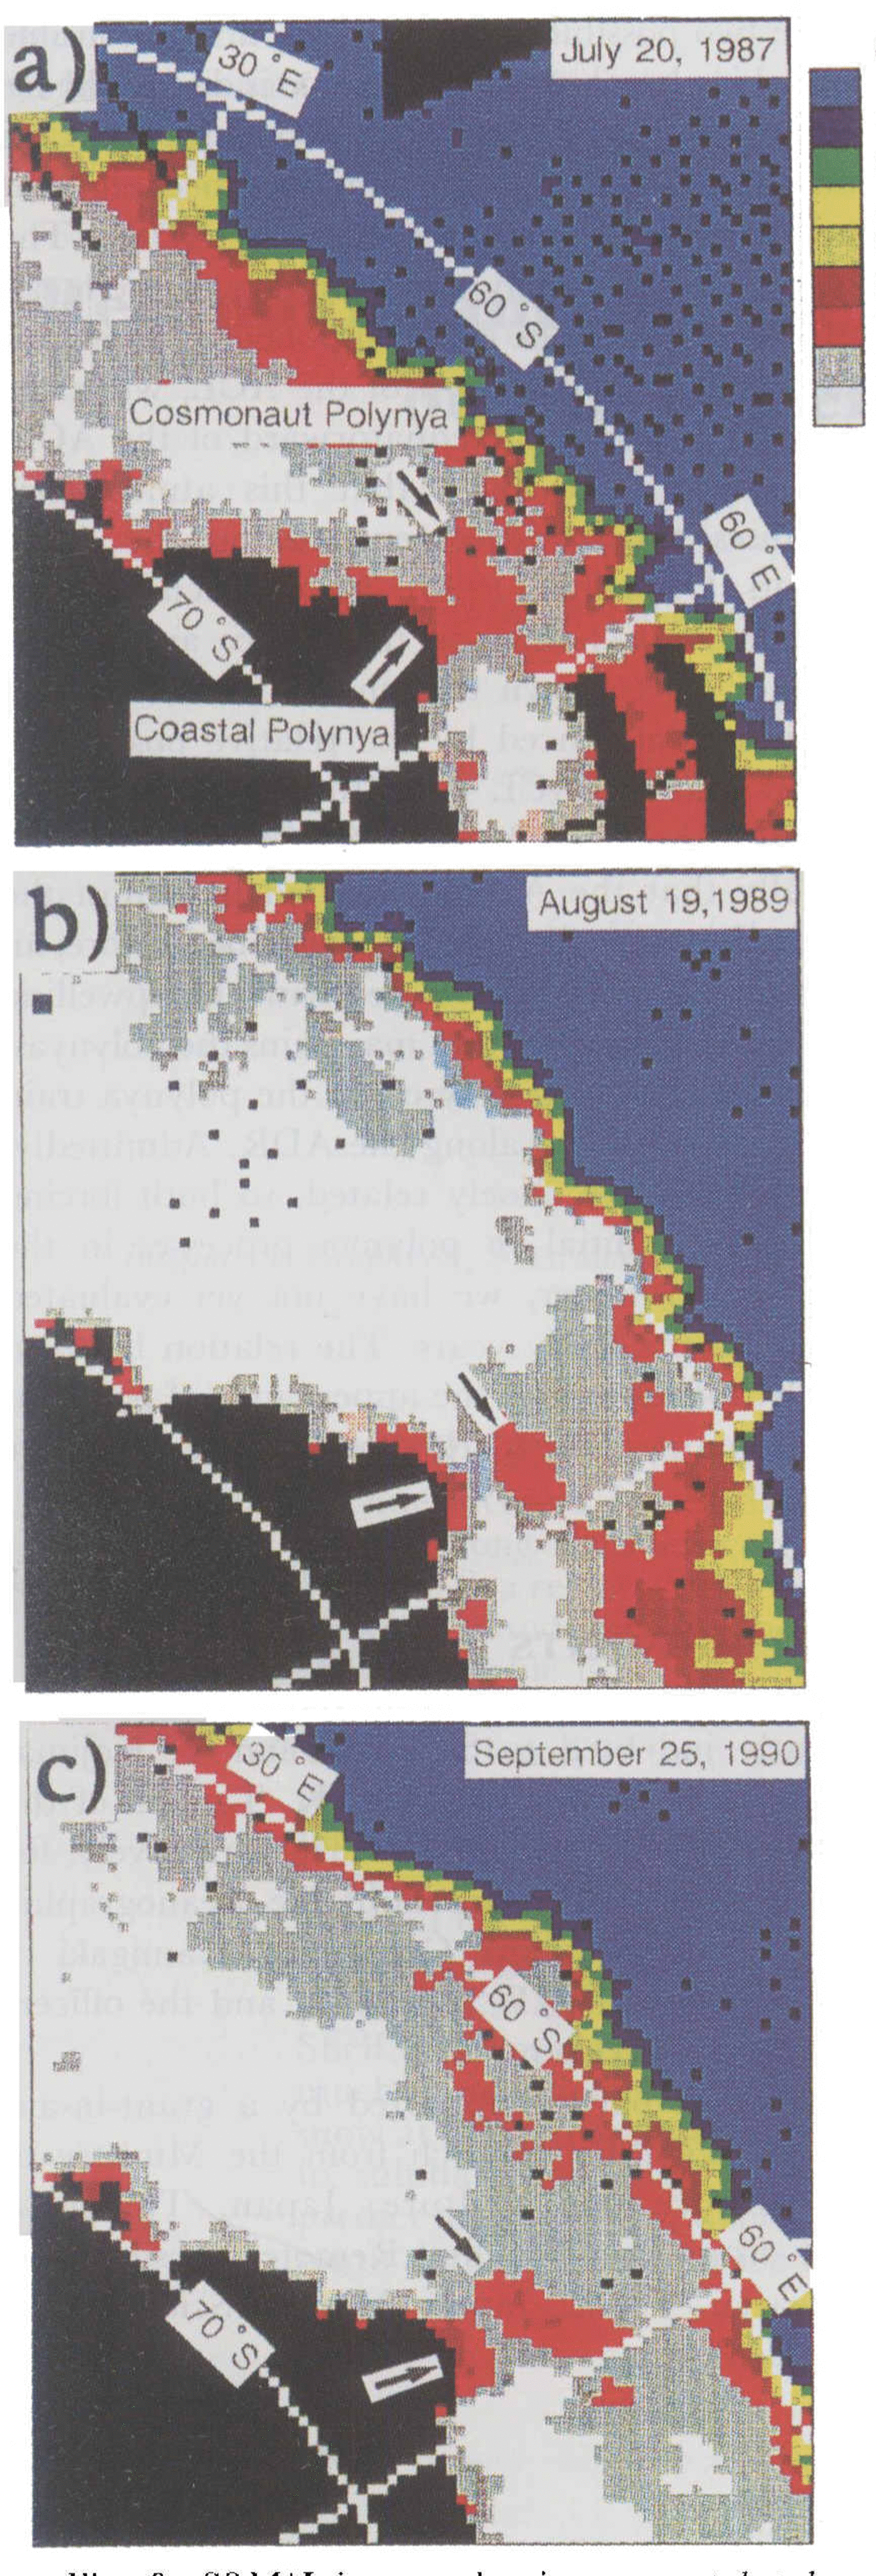
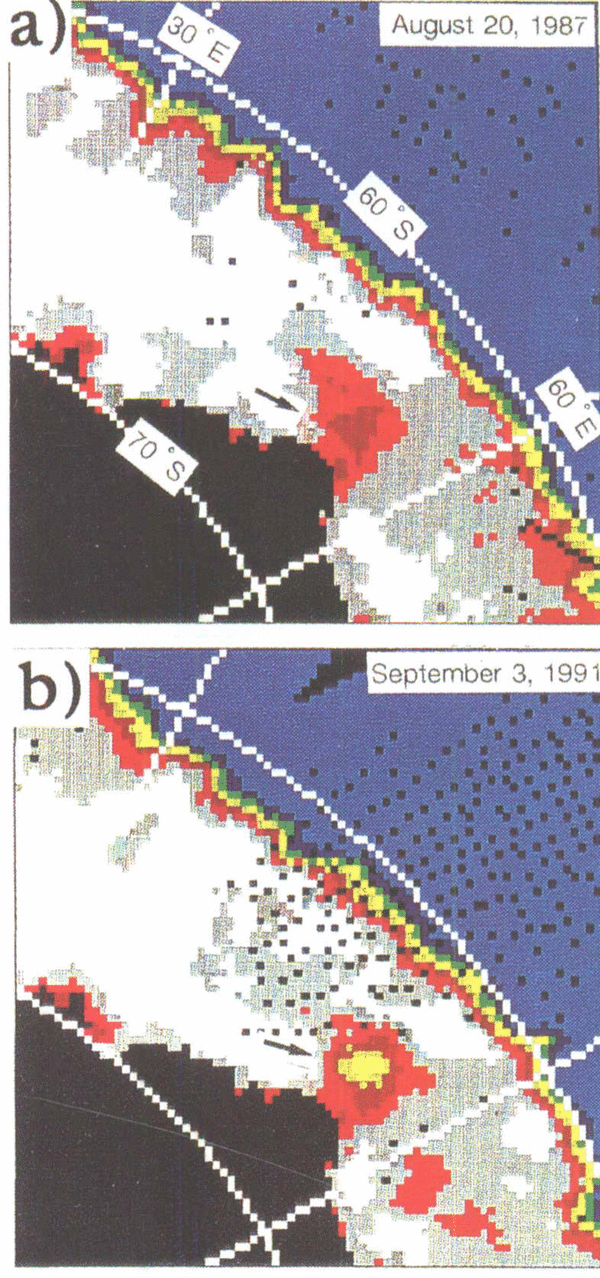
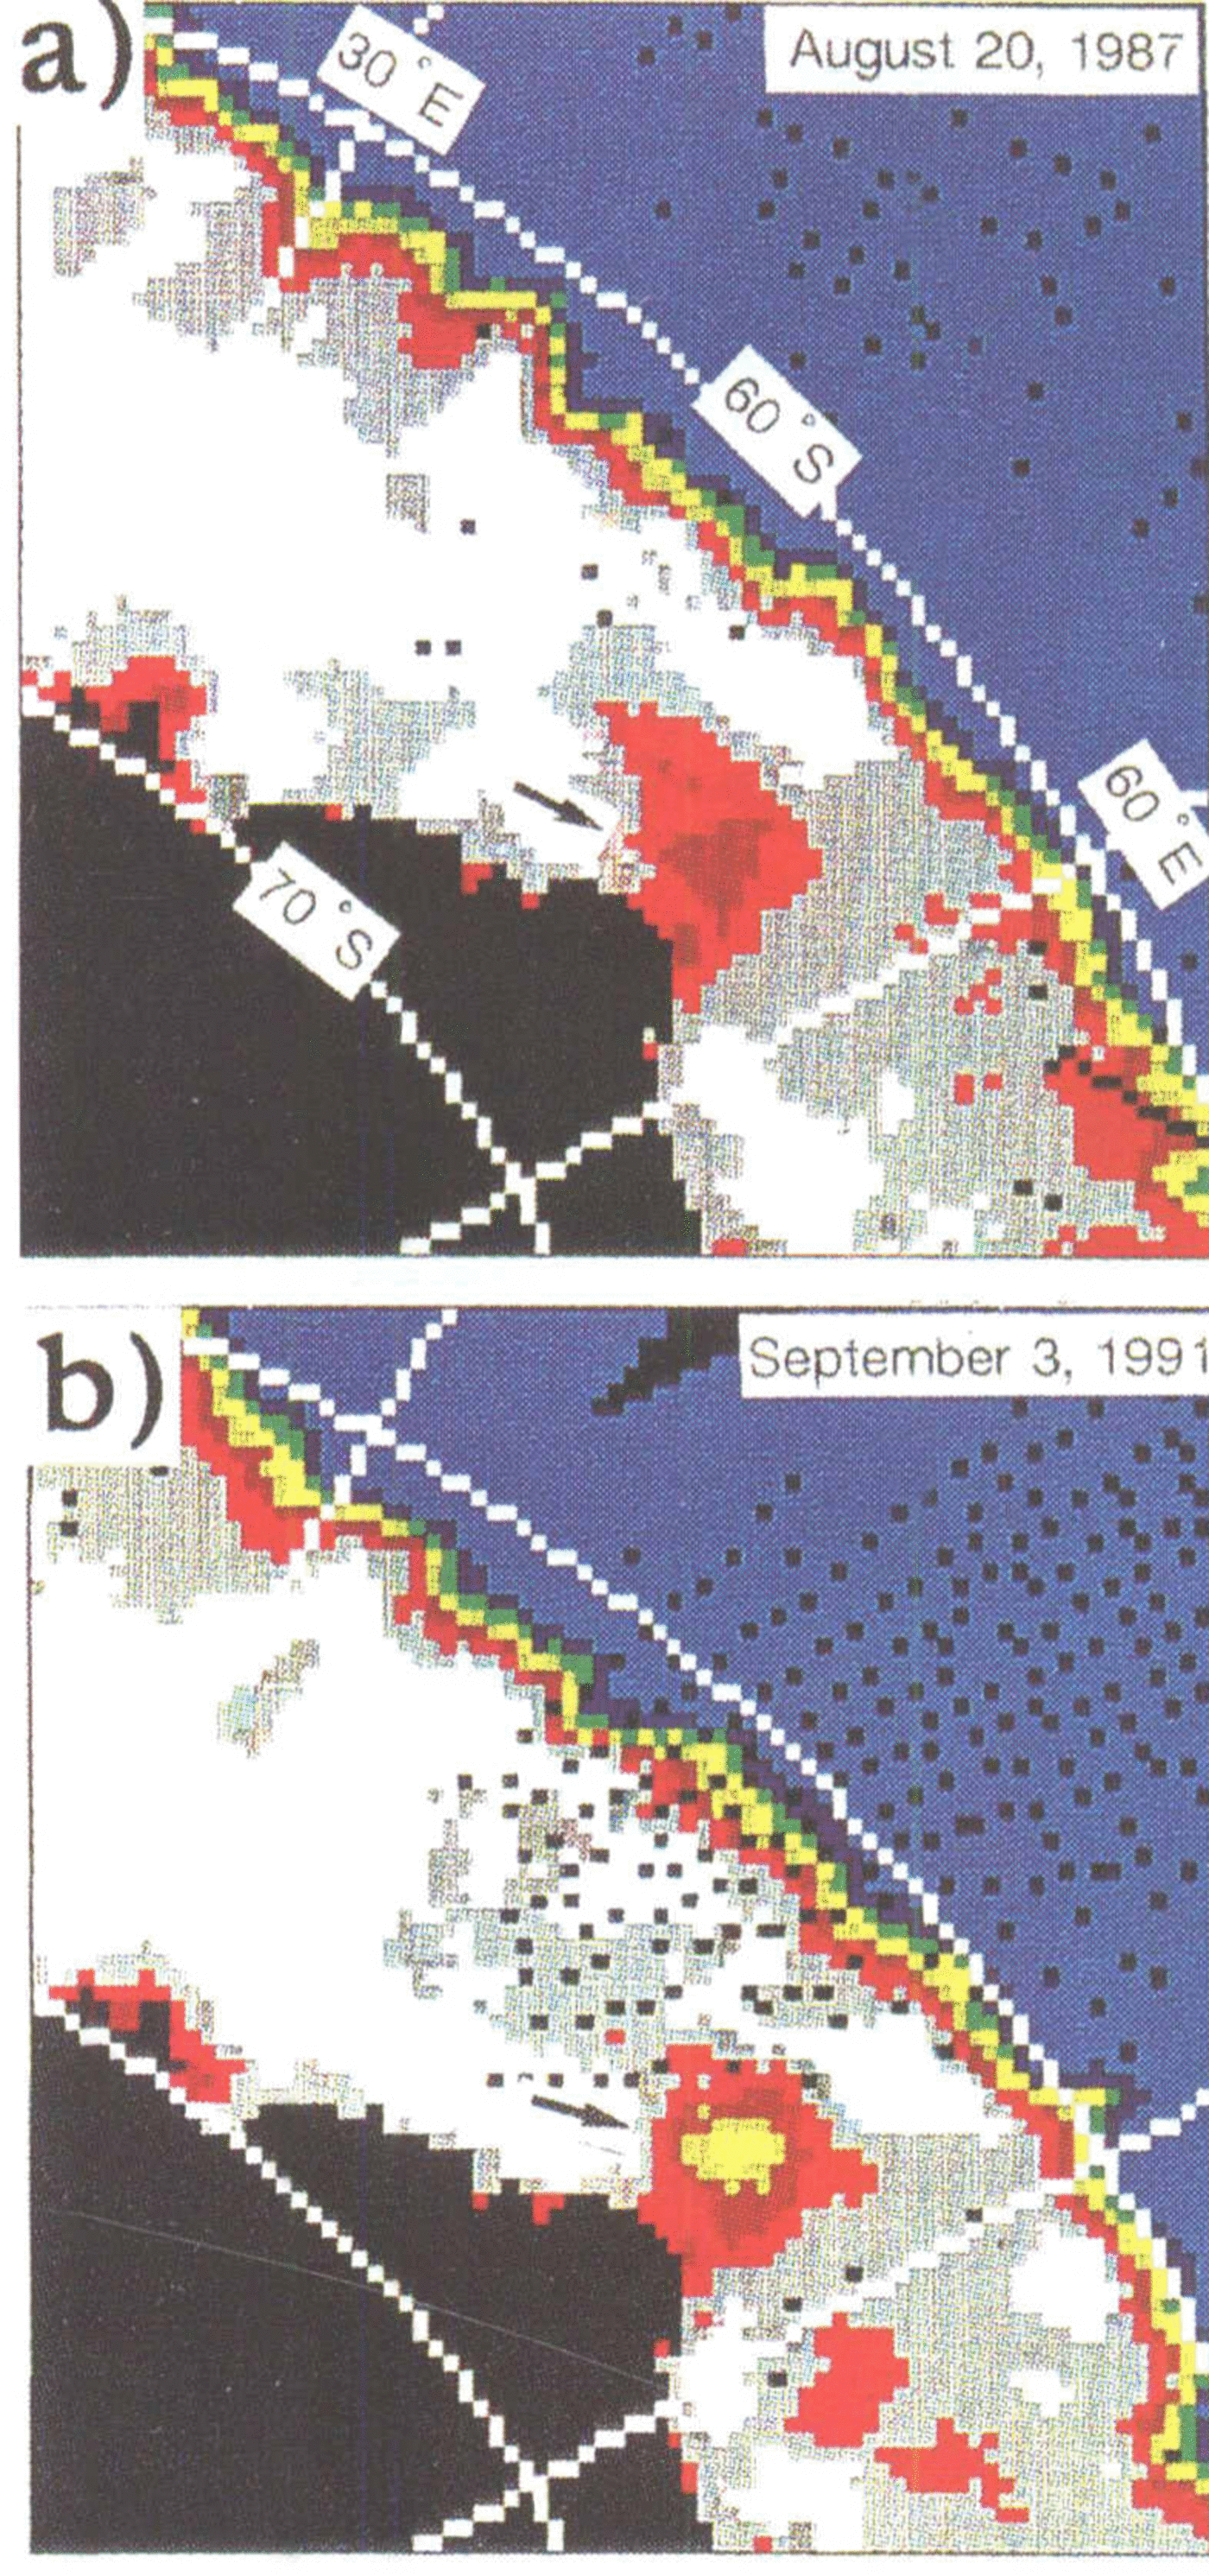
A coastal polynya forms frequently every year at about 66° S, 50 60° E (Fig. 9). It does not persist throughout the winter but it repeats its appearance and disappearance. Its size, shape and duration time are subject to wide variations. It is probable that this polynya is maintained by strong offshore winds from Antarctica and is a typical latent-heat polynya. Tentatively, we have named it the coastal Cosmonaut Polynya. Cosmonaut Polynya and coastal Cosmonaut Polynya frequently appear at the same time (Fig. 9). In addition, two polynyas occasionally join in forming a large polynya (
SSM/I images showing the incorporation of the coastal polynya and Cosmonaut Polynya. a. 20 August 1987; b. 3 September 1991.
)
Polynya train
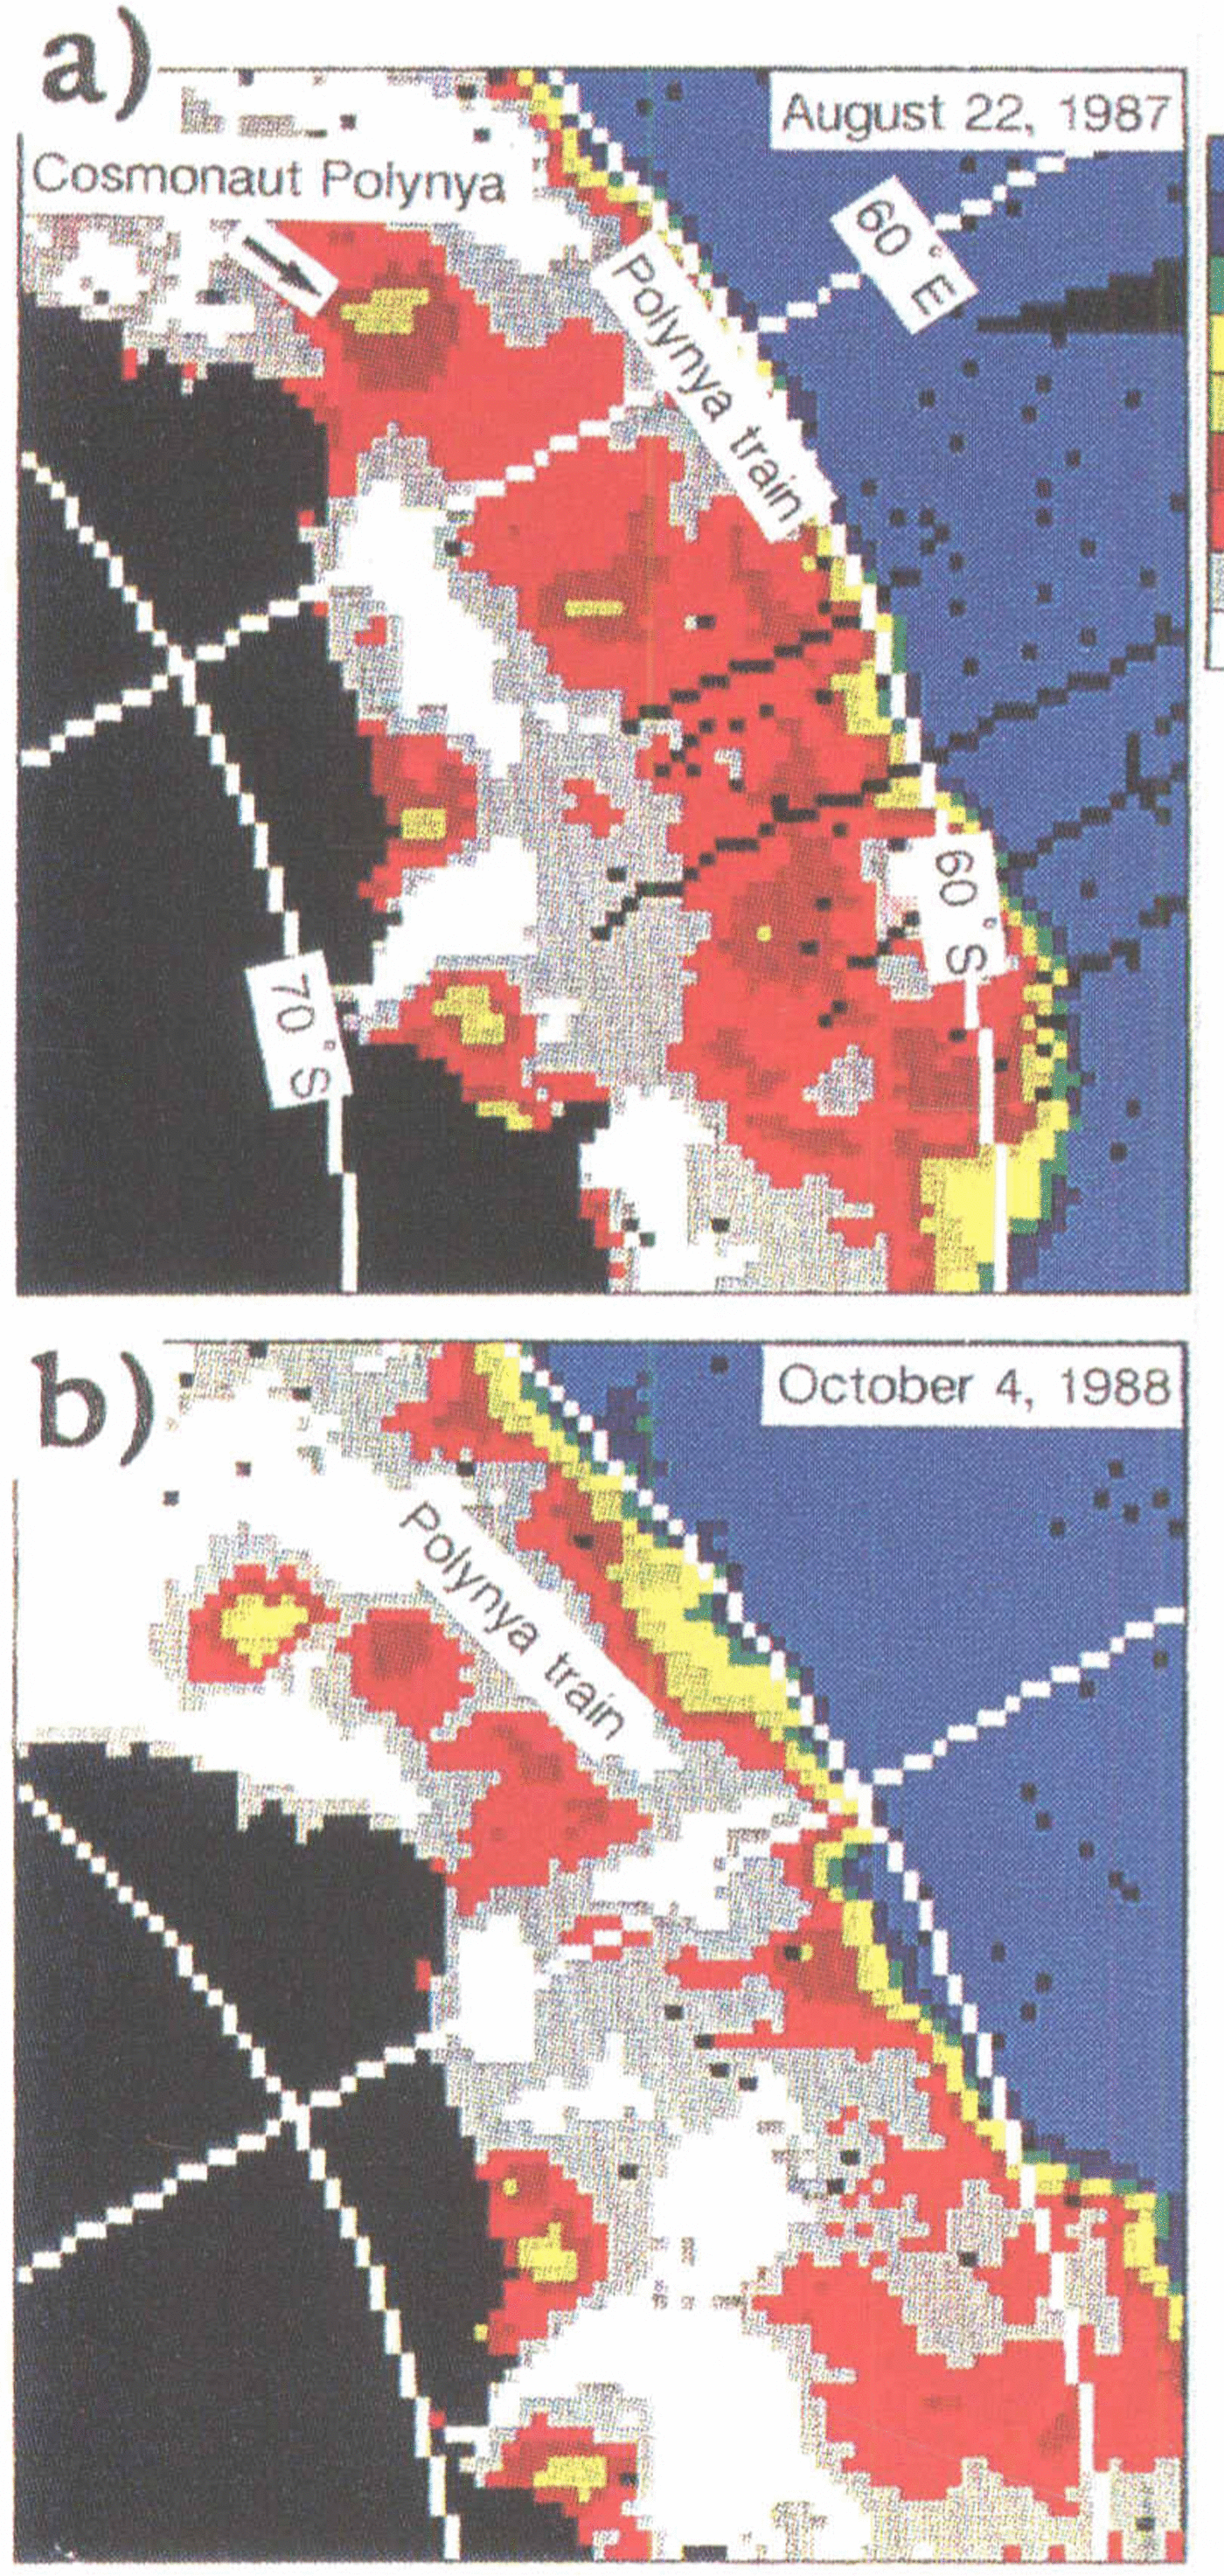
A train of polynyas has appeared from about 40° to 90° E every year (Fig. 11). Cosmonaut Polynya is situated at the west end of the train. Reduction in ice concentration along the train is noticeable in spring. It is probable that the ice break-up in spring starts at specific locations along the zone where the polynya train forms. We can expect that there are two possible forcings which are responsible for preferential ice break-up: namely, one is due to the ice divergence around the Atmospheric Convergence Line (ACL) and the other due to an enhanced oceanic heat flux at the Antarctic Divergence Region (ADR). The ACL indicates approximately the boundary of the mean zonal geostrophic wind. The east component is dominant in the mean wind field poleward of the ACL, while the west component is dominant equatorward of the ACL. Accordingly, it is most likely that this atmospheric condition causes the ice divergence along the ACL. Reference Enomoto and OhmuraEnomoto and Ohmura (1990) have discussed the temporal and spatial changes in the sea-ice area in the Antarctic. They have shown that the ice extent and ice concentration are influenced by the relative position of the ACL, and that the ACL was situated at about 66- 68° S during March-November in 1982–84. It is expected climatologically that the ADR is located in almost the same latitudinal zone as the ACL. As described before, an enhanced oceanic heat flux associated with the upwelling of CDW at the ADR triggers and maintains the polynyas. Hence, this oceanic forcing may cause the polynya train and the early ice break-up along the ADR. Admittedly, the ACL and ADR are closely related, so both forcing effects can be substantial in polynya processes in the Cosmonaut Sea. However, we have not yet evaluated their locations in the study years. The relation between the ACL/ADR locations and the appearance of polynyas in the Cosmonaut Sea is the subject of a future investigation.
Polynya train. a. 22 August 1987; b. 4 October 1988.
Acknowledgements
We are greatly indebted to S. Ikeda and T. Kojima, H. Nakamura and K. Noguchi, and K. Tanaka of the summer parties of JARE-31, 32 and 33, respectively, for their helpful support and for providing the oceanographic data. We also wish to thank Captain T. Kamigaki of JARE-31, K. Saito of JARE-32 and 33, and the officers and crew of the ice-breaker Shirase.
This study was partly supported by a grant-in-aid (04640406) tor scientific research from the Ministry of Education, Science and Culture, Japan. This is a contribution from the Satellite Remote Sensing and Ocean Research Team, Japan Marine Science and Technology Center.