Introduction
Anorexia nervosa (AN) is an eating disorder characterized by an intense fear of weight gain despite severe emaciation caused by self-starvation. Affected individuals typically deny the severity of the disorder, which often leads to protracted course and high mortality (Steinhausen, Reference Steinhausen2002). Although the underlying mechanisms are unknown, biological underpinnings including genetic heritability are widely recognized (Kaye et al., Reference Kaye, Wierenga, Bailer, Simmons and Bischoff-Grethe2013). Previous studies investigating cortical gray matter reported sizeable and relatively global atrophic changes during acute illness (King et al., Reference King, Frank, Thompson and Ehrlich2018). However, along with a number of endocrine changes (Merle et al., Reference Merle, Haas, Burghardt, Döhler, Schneider, Lehmkuhl and Ehrlich2011; Schorr and Miller, Reference Schorr and Miller2017), this (pseudo)atrophy has been found to be largely reversible after successful nutritional therapy (King et al., Reference King, Geisler, Ritschel, Boehm, Seidel, Roschinski, Soltwedel, Zwipp, Pfuhl, Marxen, Roessner and Ehrlich2015; Bernardoni et al., Reference Bernardoni, King, Geisler, Stein, Jaite, Nätsch, Tam, Boehm, Seidel, Roessner and Ehrlich2016).
Studies using task-based functional magnetic resonance imaging (fMRI) in AN have employed a broad range of psychological paradigms, but most have focused on eating disorder-related stimuli (e.g. food and body images). Results suggest alterations in brain regions related to reward processing (Fladung et al., Reference Fladung, Grön, Grammer, Herrnberger, Schilly, Grasteit, Wolf, Walter and von Wietersheim2010; Cowdrey et al., Reference Cowdrey, Park, Harmer and McCabe2011; Holsen et al., Reference Holsen, Lawson, Blum, Ko, Makris, Fazeli, Klibanski and Goldstein2012; Decker et al., Reference Decker, Figner and Steinglass2015; Wierenga et al., Reference Wierenga, Bischoff-Grethe, Melrose, Irvine, Torres, Bailer, Simmons, Fudge, McClure, Ely and Kaye2015) and cognitive control (Foerde et al., Reference Foerde, Steinglass, Shohamy and Walsh2015). However, findings are inconsistent with regard to the direction and precise localization of functional anomalies due to varying-task designs, performance levels, and statistical modeling.
A valuable approach to circumvent some of these inconsistencies may be resting state functional connectivity (RSFC) analysis. Since RSFC data are obtained while the participant is not engaged in a task, some of the aforementioned challenges are eliminated. Hence, RSFC provides a reliable means to study clinical populations with a large variance in compliance. Studies employing this approach have typically used independent component analysis (ICA) or seed-based connectivity analyses to examine known networks such as the default-mode network (Greicius et al., Reference Greicius, Krasnow, Reiss and Menon2003), the cognitive-control network (Cole and Schneider, Reference Cole and Schneider2007) or the salience network (Seeley et al., Reference Seeley, Menon, Schatzberg, Keller, Glover, Kenna, Reiss and Greicius2007).
Previous work has demonstrated widespread cortical (Cowdrey et al., Reference Cowdrey, Filippini, Park, Smith and McCabe2014), limbic (Favaro et al., Reference Favaro, Tenconi, Degortes, Manara and Santonastaso2014) as well as cortico-limbic (Biezonski et al., Reference Biezonski, Cha, Steinglass and Posner2016) dysconnectivities in acute AN. Studies employing ICA found hyper- and hypo-connectivity in the fronto-parietal ‘control’ network (Gaudio et al., Reference Gaudio, Wiemerslage, Brooks and Schiöth2016), default-mode (Cowdrey et al., Reference Cowdrey, Park, Harmer and McCabe2011; Boehm et al., Reference Boehm, Geisler, King, Ritschel, Seidel, Deza Araujo, Petermann, Lohmeier, Weiss, Walter, Roessner and Ehrlich2014), and the somato-sensory and visual networks (Favaro et al., Reference Favaro, Santonastaso, Manara, Bosello, Bommarito, Tenconi and Di Salle2012). Recent studies using a seed-based approach identified alterations in thalamo-prefrontal (Biezonski et al., Reference Biezonski, Cha, Steinglass and Posner2016) and ventral fronto-parietal connectivity (Collantoni et al., Reference Collantoni, Michelon, Tenconi, Degortes, Titton, Manara, Clementi, Pinato, Forzan, Cassina, Santonastaso and Favaro2016). However, despite an increase of RSFC studies in AN (Gaudio et al., Reference Gaudio, Wiemerslage, Brooks and Schiöth2016), the number of studies is still small in comparison with other psychiatric disorders. Furthermore, most studies have focused on acutely underweight patients and thus may have merely measured unspecific effects of starvation (Gaudio et al., Reference Gaudio, Wiemerslage, Brooks and Schiöth2016).
Going beyond simple focus on synchronous activity of specific brain regions or components of interest, graph–theoretical techniques model the brain's architecture as a complex network (Bullmore and Sporns, Reference Bullmore and Sporns2009; Fornito et al., Reference Fornito, Bullmore and Zalesky2017). Graph theory describes the brain as a set of nodes (representing brain areas or voxels across the whole brain) connected by edges (interregional functional connections) (Bullmore and Bassett, Reference Bullmore and Bassett2011; Fornito et al., Reference Fornito, Bullmore and Zalesky2017). In contrast to conventional RSFC approaches, a representation as a graph provides insight into both regional and whole-brain scales by means of metrics including efficiency of information transfer, small-world topology, and modularity (Rubinov and Sporns, Reference Rubinov and Sporns2010).
We previously applied this data-driven approach in a relatively large sample of acutely ill patients with AN (Ehrlich et al., Reference Ehrlich, Lord, Geisler, Borchardt, Boehm, Seidel, Ritschel, Schulze, King, Weidner, Roessner and Walter2015; Geisler et al., Reference Geisler, Borchardt, Lord, Boehm, Ritschel, Zwipp, Clas, King, Wolff-Stephan, Roessner, Walter and Ehrlich2016), focusing on global, intermediate, and local brain network properties and using well-established graph metrics as well as Network Based Statistics (NBS, Zalesky et al., Reference Zalesky, Fornito and Bullmore2010). We found that the network structure in acute AN is characterized by increases in both, characteristic path length and global assortativity and by changes in intermediate brain architecture driven by locally decreased connectivity strength and increased path length in posterior insula and thalamus. Our findings obtained in underweight AN patients within the first days of treatment, are suggestive of wide-scale disturbances in information flow across brain networks. It is currently unclear, however, whether these aberrant network properties are a state marker related to undernutrition (such as endocrine changes) or whether they reflect a predisposition which could serve as a biomarker.
Studying patients recovered from AN (recAN) can help to resolve this ambiguity (state v. trait marker) since effects would be unrelated to acute undernutrition. Given prior evidence that the assessment of global network properties are reliable, these parameters should be sensitive to uncover either no differences in brain network topology between recAN and matched healthy controls (HC) (indicative of a state-related phenomenon) or differences that resemble our previous findings in acute AN (suggestive of a trait marker).
Materials and methods
Participants
Two independent groups of female volunteers were investigated: 55 recovered former AN patients and pairwise matched 55 female HC (15.5–29.5 years old).
To be considered ‘recovered’, recAN subjects had to (i) have previously met AN criteria [based on Diagnostic and Statistical Manual of Mental Disorders (DSM)-IV], (ii) maintain a body mass index (BMI) >10th BMI percentile (if <18 years) or a BMI > 18.5 kg/m2 (if ⩾18 years) for at least 6 months prior to the study, (iii) menstruate, and (iv) have not binged, purged, or engaged in significant restrictive eating patterns. To be included in the HC group, participants had to be of normal weight and eumenorrheic. This study was approved by the local Institutional Review Board, and all participants (or their legal guardians) gave written informed consent. Case–control age-matching was carried out resulting in a maximum difference of 0.6 years between the individuals within one pair (online Supplementary material 1.1).
Exclusion criteria and possible confounding variables, e.g. the use of psychotropic medications other than selective serotonin reuptake inhibitor (SSRI) (two recAN) and medical comorbidities, were obtained using the expert version of the structured interview for anorexia and bulimia nervosa for DSM-IV (SIAB-EX) and our own semi-structured research interview. HC participants did not have any history of psychiatric illness or a lifetime BMI below the 10th age percentile (if <18 years)/BMI below 18.5 kg/m2 (if ⩾18 years) (online Supplementary material 1.1).
Clinical measures
Eating disorder-specific psychopathology was assessed with the Eating Disorders Inventory (EDI-2). Depressive symptoms were explored using the Beck Depression Inventory (BDI-2). General psychopathology was gaged using the revised Symptom Checklist 90 (SCL-90-R). See online Supplementary material 1.1 for further details. Additionally, plasma leptin was sampled (online Supplementary material 1.2).
MRI data acquisition
Images were acquired between 8 and 9 am after an overnight fast using standard sequences with a 3T MRI scanner (TRIO; Siemens, Erlangen, Germany) using a 12-channel head coil.
Functional images were acquired at rest with eyes closed using a gradient-echo T2*-weighted echo planar imaging (EPI) sequence: tilted 17° toward coronal from the AC–PC line (to reduce signal dropout in orbitofrontal regions); number of volumes = 190; number of slices = 40; TR = 2200 ms; TE = 30 ms; flip angle = 75°; 3.4 mm in-plane resolution; slice thickness = 2.4 mm (1 mm gap resulting in a voxel size of 3.4 × 3.4 × 3.4 mm3); FoV = 220 × 220 mm2; bandwidth = 2004 Hz/pixel, length = 6:58 min (online Supplementary material 1.3).
MRI data preprocessing
MRI images were processed using SPM8 (http://www.fil.ion.ucl.ac.uk/spm/) within the Nipype framework (Gorgolewski et al., Reference Gorgolewski, Burns, Madison, Clark, Halchenko, Waskom and Ghosh2011). A sample-specific template was created using structural images from all participants. The slice time corrected functional data were realigned and registered to their mean. The realigned files were coregistered to the participant's structural brain image. The EPI volumes were then normalized to MNI space using the sample-specific template and corresponding flow field. Using DPARSFA toolbox, temporal filtering (0.01–0.08 Hz) was applied. Then, regression of 5 CompCorr nuisance components from white matter and cerebrospinal fluid, and of 24 motion parameters was performed. Subsequently, scrubbing was applied to eliminate timepoints with a framewise displacement of >0.5 mm (Power et al., Reference Power, Barnes, Snyder, Schlaggar and Petersen2012). The resulting volumes were parcellated into 160 spherical regions of interest (ROIs) as defined by Dosenbach et al. (Reference Dosenbach, Nardos, Cohen, Fair, Power, Church, Nelson, Wig, Vogel, Lessov-Schlaggar, Barnes, Dubis, Feczko, Coalson, Pruett, Barch, Petersen and Schlaggar2010). Time courses of these ROIs were extracted and symmetric correlation matrices with pair-wise Pearson correlation coefficients were created. See online Supplementary material 1.4 for further details.
Computation of graph metrics
Based on correlation matrices, weighted, undirected graph networks with 160 nodes were constructed on individual subject level. The distributions of all Pearson correlation coefficients from correlation matrices [which have been shown to drive differences in higher level graph theoretical measures in other neuropsychiatric disorders (van den Heuvel et al., Reference van den Heuvel, de Lange, Zalesky, Seguin, Yeo and Schmidt2017)] were not different across groups (online Supplementary material Fig. S1). Graphs were thresholded with 21 sparsity levels (10–30%, online Supplementary material 1.4). Network metrics were derived using functions from the open-source python library networkx (https://networkx.github.io). Global graph metrics describe the whole network in a single measure, while local graph metrics characterize each node individually.
The five global metrics clustering coefficient (CC glob), characteristic pathlength (CPL glob), small-worldness index (σ), assortativity (α), and global efficiency (E glob), as well as eight local graph metrics degree, strength, local characteristic pathlength (CPL loc), betweenness centrality (BCI), participation index (PI), local efficiency (E loc), local clustering coefficient (CC loc), and normalized local efficiency (LEGE) were computed for each sparsity level. For a detailed description of local and global graph metrics, see online Supplementary material 1.5 and 1.6.
Statistical analysis
In all statistical analyses we used age-adjusted BMI standard deviation scores (BMI-SDS; online Supplementary material 1.7). A Shapiro–Wilk test revealed that all graph metrics were not normally distributed. Therefore, non-parametric independent two-group Mann–Whitney U tests were performed for between-group comparisons using the R toolbox (online Supplementary material 1.7).
If our previous findings of group differences in global assortativity and pathlength in acAN (Geisler et al., Reference Geisler, Borchardt, Lord, Boehm, Ritschel, Zwipp, Clas, King, Wolff-Stephan, Roessner, Walter and Ehrlich2016) constitute trait characteristics of the disorder, we expected to find a similar pattern of results in recAN. For the remaining global metrics test results were corrected for multiple comparisons using false discovery rate (FDR, p = 0.05).
For local metrics, we hypothesized group differences (Geisler et al., Reference Geisler, Borchardt, Lord, Boehm, Ritschel, Zwipp, Clas, King, Wolff-Stephan, Roessner, Walter and Ehrlich2016) in characteristic pathlength (CPL loc) in the left mid-insula, left post-insula, bilateral thalamus, and in strength in the left thalamus, left mid-insula, and left post-insula. For the remaining variables, test statistics were corrected for multiple comparisons across all regions and local metrics (FDR, p < 0.05). FDR correction was not applied when comparing the results of networks constructed with different sparsity threshold levels, as they are deemed to be highly interdependent.
To transform the sparsity threshold dependent values of the global metrics into threshold-independent values, we calculated the area-under-the-curve (AUC) of the threshold levels (10–30%) and the corresponding values of the global and local metrics.
Correlative relationships of metrics showing significant group differences with clinical and demographic parameters were assessed using AUC metrics. We focused on overall eating disorder symptoms (EDI-2 total score), depression (BDI-2 total score), BMI-SDS, plasma leptin level, duration of illness, and age. To account for possibly confounding effects of age and BMI-SDS, additional partial correlation analyses were carried out. Results of the correlation analyses were Bonferroni-corrected for 18 comparisons.
Network-based statistics
NBS is a validated method for identifying a statistically significant cluster of connections indicating differences between two groups on intermediate network scales (Zalesky et al., Reference Zalesky, Fornito and Bullmore2010).
NBS are computed using the following steps: (i) identify all connections (pairs of nodes) that are different between groups beyond a particular t-value (called primary threshold), (ii) select the largest contiguous cluster of these connections, and (iii) validate the cluster's significance by permutation testing. In permutation testing an empirical null distribution of the largest cluster size is generated by conducting the first two NBS steps on resampled group membership data 5000 times. The returned subnetwork is statistically significant at a family wise error (FWE) corrected value of p < 0.05. Although the network needs to be considered as a whole, the extent of the returned network can be varied using a different primary threshold. As described previously, we used a primary threshold of t = 2.0 (Geisler et al., Reference Geisler, Borchardt, Lord, Boehm, Ritschel, Zwipp, Clas, King, Wolff-Stephan, Roessner, Walter and Ehrlich2016). This adjusts the extremity of deviation in a connection between groups required, before it is considered for inclusion in the NBS result. NBS returns a single p-value, which represents the likelihood that the subnetwork is due to a true effect in the data. This approach measures the entire cluster of returned connections, but does not identify the contribution of each connection independently. The NBS procedure was carried out twice with one-sided t tests for the contrasts recAN < HC and recAN > HC.
Machine learning approach
To discriminate between recAN and HC, a linear support vector classifier (SVC) was applied to the AUC-values of the all eight local metrics (degree, strength, CPL loc, BCI, PI, E loc, CC loc, LEGE) of all 160 regions.
Based on a set of training data, an SVC computes a hyper-plane that separates the data optimally according to a particular cost function in an attempt to find a decision boundary that generalizes the classification for unseen participants (Gunn, Reference Gunn1998). In detail, a classifier is derived by providing examples of the form 〈x,c〉 to find a hyperplane that best separates the input space, where x represents the input data (e.g. AUC values of eight local metrics for the 160 brain regions) and c is the class label (in this case diagnostic group, recAN = −1, HC = 1). Computation of the SVC was carried out using the open-source python library scikit-learn (Pedregosa et al., Reference Pedregosa, Varoquaux, Gramfort, Michel, Thirion, Grisel, Blondel, Prettenhofer, Weiss and Dubourg2011). A standard linear SVC kernel, L2 regularization, and a regularization strength parameter C = 1 were employed.
We used a stratified k-fold cross-validation strategy to estimate the generalization ability of our classifier, i.e. the classification accuracy in independent test data. We used k = 10, corresponding to 11 subjects per fold. In stratified k-fold cross-validation, the data is randomly split into k folds of equally distributed patient and control cases. A model is trained using k − 1 of the folds and its generalization performance was validated on the remaining fold. This process is repeated k times, each time withholding a different validation subset. The average classification accuracy over all k models represents the overall generalizability.
We used permutation tests to non-parametrically evaluate the null hypothesis that the classifiers might have obtained good classification accuracies just by chance (Ojala and Garriga, Reference Ojala and Garriga2010). This involved repeating the classification procedure 3000 times with a different random permutation of the training group labels.
Results
Sample characteristics
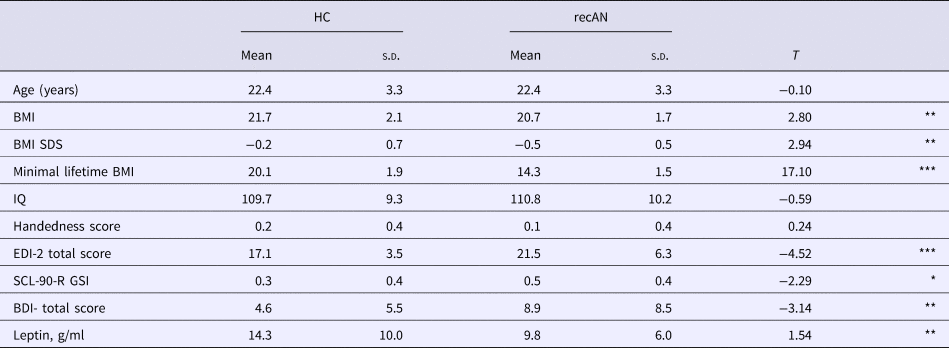
There were no differences in age, intelligence quotient (IQ), or handedness score between the groups. RecAN had as expected lower minimal lifetime BMI, slightly lower current BMI and plasma leptin levels, as well as residual eating disorder symptom and depression scores (Table 1).
Basic demographic and clinical variables

BMI, body mass index; BMI SDS, age-adjusted BMI standard deviation scores; EDI-2, eating disorder inventory, version 2; BDI-2, Beck depression inventory, version 2; SCL-90-R GSI, revised symptom checklist 90 global symptom score, s.d., standard deviation.
Handedness score ranges from 0 (right) to 2 (left). For details on the assessment of IQ and handedness see online Supplementary material 1.1 and 1.2. Group differences were tested using Student's t tests.
80% of the recAN participants were predominately of the restrictive subtype and 20% were predominately of the binge/purge subtype during acute illness as ascertained with the SIAB-EX interview.
*p < 0.05, **p < 0.01, ***p < 0.001.
Topological properties (global metrics)
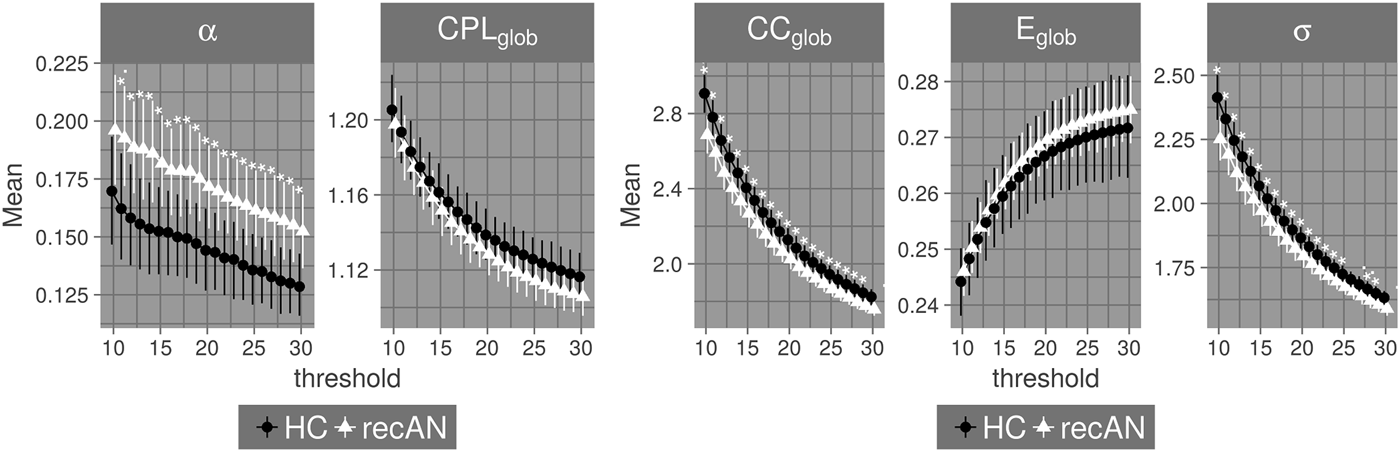
We first tested differences between recAN and HC in assortativity (α) and characteristic pathlength (CPL glob). The groups did not differ in pathlength, but recAN had a higher assortativity for 19 of 21 tested sparsity thresholds with p-values between 0.02 and 0.05 (Fig. 1).
Group comparisons of global metrics. Results of group comparison of the global metrics characteristic pathlength (CPL glob), assortativity (α), clustering-coefficient (CC glob), global efficiency (E glob) and small-worldness index (σ) for all tested sparsity thresholds between 10 and 30. Comparisons were performed using Mann–Whitney U tests (**p < 0.01; *p < 0.5; ·p < 0.1). According to our a priori hypothesis, p-values for CPL glob and α were uncorrected, whereas p-values for CC glob, E glob, and σ were FDR-corrected for multiple comparisons. HC and recovered AN patients (recAN) are depicted by black circles and white triangles, respectively. Group comparisons using AUC values and FDR over all five measures confirmed significant differences for assortativity, small-worldness index, and clustering-coefficient.

Next, we tested for group differences in the remaining global graph measures small-worldness index (σ), clustering-coefficient (CC glob), and global efficiency (E glob). After correcting for multiple comparisons, both small-worldness index and clustering-coefficient were reduced in recAN (Fig. 1). In all tested sparsity thresholds, group comparisons yielded p-values (FDR corrected) between 0.008 and 0.044.
Group comparisons using AUC values and FDR over all five measures confirmed significant differences for assortativity, small-worldness index, and clustering-coefficient (W = 1131, p FDR = 0.031; W = 1950, p FDR = 0.031; W = 1992, p FDR < 0.025), but no differences for the remaining metrics. All group differences remained significant after excluding the two recAN taking SSRI (W = 1050, p FDR = 0.029; W = 1814, p FDR = 0.029; W = 1857, p FDR < 0.029).
Neither assortativity, small-worldness index nor clustering-coefficient were associated with age, BMI, or plasma leptin in either group (all |r| < 0.23 and p FDR > 0.64). There were also no correlations between these metrics and eating disorder (EDI-2 total score) or depressive symptoms (BDI-2 total score; all |r| < 0.35 and p FDR > 0.26). The absence of significant correlations was confirmed when controlling for age or BMI (all |r| < 0.35 and p FDR > 0.26).
Network-based statistics
No differences in subnetworks were found between recAN and HC.
Nodal characteristics (local metrics)
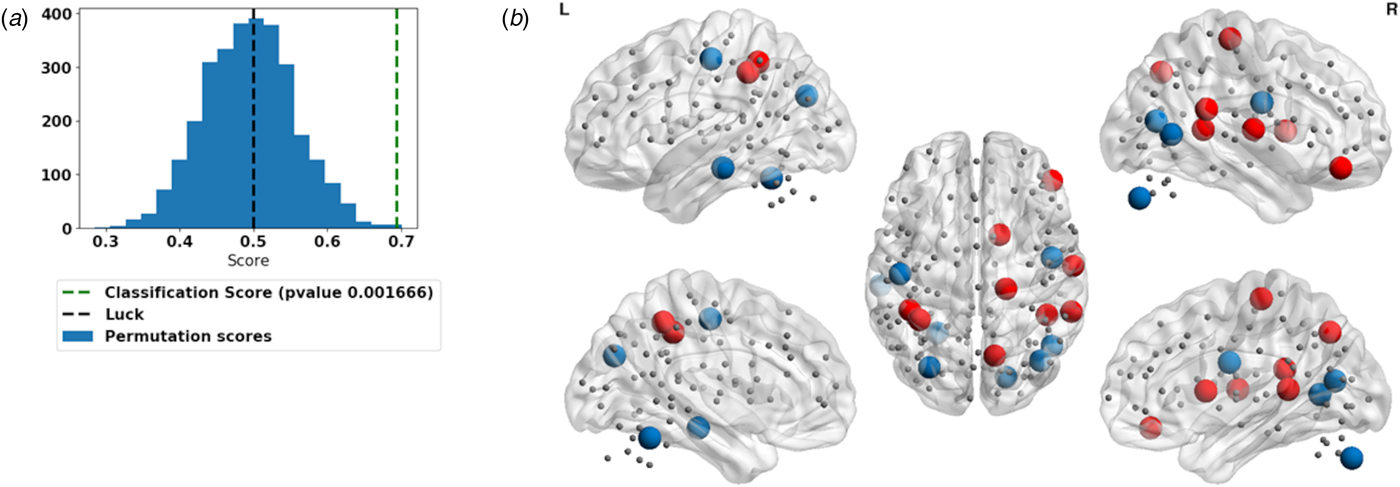
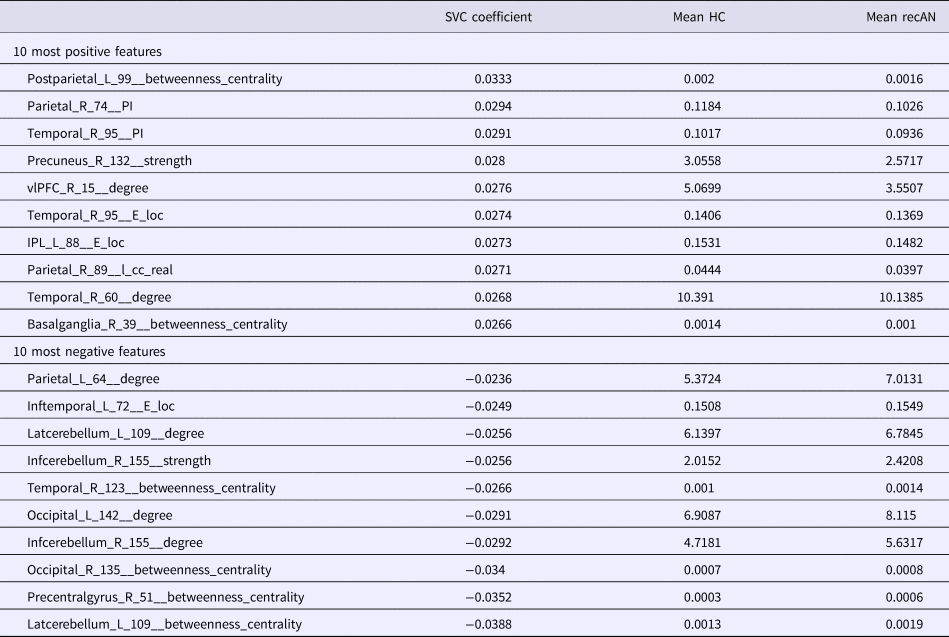
For the nodal characteristics tested within our hypothesis-driven approach [characteristic pathlength (CPL loc) and strength], we did not find any group differences (online Supplementary material Fig. S2). Group comparisons of the remaining local graph metrics were also not significant after correction for multiple comparisons (eight metrics). Visual inspection of the uncorrected findings (online Supplementary material Figs. S3–S13) revealed a pattern of relatively consistent trends toward group differences predominantly in fronto-parietal brain regions for the measures degree, strength, local efficiency (E loc), and normalized local efficiency (LEGE). Therefore, a SVC was trained on the nodal characteristics to discriminate between recAN and HC as an exploratory analysis. The SVC reached a classification score of 70.4%, which is significantly above chance with p = 0.0003 (Fig. 2a). Classification appeared to be driven by differences in several local graph metrics in temporo-parietal brain regions (Table 2 and Fig. 2b).
Machine learning approach. (a) Results of the support vector classifier (SVC) using all local graph metrics to determine group membership: histogram of classification scores based on the permutated (blue bars) and actual (green) samples using SVCs. Classification score represents the accuracy of the classifier and are estimated as the ratio of correct classified test labels to the total number of test labels. (b) Localization of SVC features: only the regions of features with the highest positive and lowest negative weights are shown (according to Table 2). Red and blue colors indicate positive and negative weights, respectively.

Features of support vector classifier (SVC)

Only the features with the highest positive and lowest negative weights are listed. For the sake of completeness the group means of the raw feature values are provided as well. In the SVC the groups recAN and HC were coded by −1 and 1, respectively. The name of the features consists of the ROI identifier (anatomical name, hemisphere, and unique index number) and the name of the local metric. For more details regarding the ROIs, please refer to online Supplementary material Table S2
Discussion
The current study demonstrates changes in the configuration of large-scale functional brain networks of recovered AN patients for the first time using graph–theoretical metrics of RSFC. We found that the global functional network structure of recovered patients is characterized by an increased assortativity representing an affinity for nodes of a similar degree to connect directly with each other – a result that mirrors changes in acutely underweight AN patients (Geisler et al., Reference Geisler, Borchardt, Lord, Boehm, Ritschel, Zwipp, Clas, King, Wolff-Stephan, Roessner, Walter and Ehrlich2016). This finding suggests increased assortativity as a trait and possible biomarker for AN. Furthermore, recAN were characterized by a reduced CC glob, reflecting diffuse reduced local connectedness, and a decreased small-worldness index. The latter findings can be interpreted as a tendency toward a more ‘random’ network structure.
In contrast to acute AN, we did not find significant changes in the CPL glob, or in graph metrics at the intermediate (NBS, Ehrlich et al., Reference Ehrlich, Lord, Geisler, Borchardt, Boehm, Seidel, Ritschel, Schulze, King, Weidner, Roessner and Walter2015) or local level (Geisler et al., Reference Geisler, Borchardt, Lord, Boehm, Ritschel, Zwipp, Clas, King, Wolff-Stephan, Roessner, Walter and Ehrlich2016). However, beyond group-level differences, a SVC was able to distinguish recAN from HC individuals based on local graph metrics with a classification accuracy of 70.4%, driven by degree and BCI in predominantly parietal and temporal brain regions.
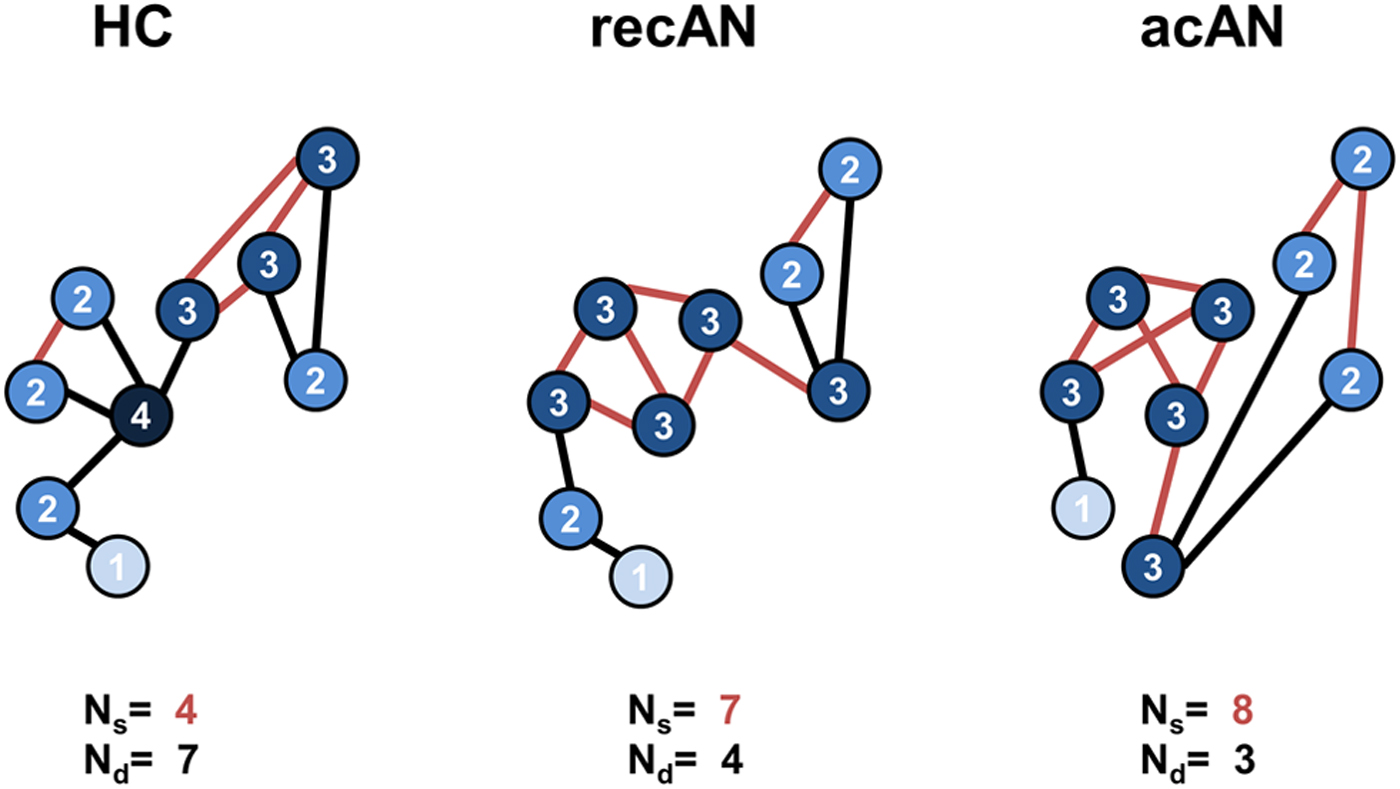
At the global level, the pattern of functional brain network connectivity observed previously in acAN (Geisler et al., Reference Geisler, Borchardt, Lord, Boehm, Ritschel, Zwipp, Clas, King, Wolff-Stephan, Roessner, Walter and Ehrlich2016) and here in recAN seems to be characterized by high-degree nodes that preferentially connect to other high-degree nodes (Newman, Reference Newman2002). At the same time, this increased assortativity in AN reflects propensity of low degree nodes to preferentially connect to other low degree nodes (Fig. 3). Conjointly, this configuration of highly interconnected hub nodes as well as specialized clusters of low-degree nodes is suggestive of a trait reflecting altered global network topology in the disorder. Such a configuration has been described as ‘cost-efficient’ (Achard and Bullmore, Reference Achard and Bullmore2007). However, after approximating the distance (Euclidean distance) between nodes and comparing the mean lengths of connections between the groups, there were no significant differences (W = 1686, p = 0.23) indicating that the network configurations of recAN participants and HC have comparable costs. Increased assortativity may also pose a risk since network efficiency can be reduced greatly by degradation of high-degree nodes. Hence, networks characterized by high assortativity may be less robust (van den Heuvel and Sporns, Reference van den Heuvel and Sporns2011).
Schematic representation of assortativity in brain network topology of HC and patients with anorexia nervosa. Nodes are labeled by their degree. If an edge connects nodes of the same degree, it is colored red; otherwise it is colored black. N S (same degree) and N d (different degree) denote the numbers of red and black edges of the whole graph, respectively. Positive assortativity: high-degree nodes primarily connect to other high-degree nodes and low-degree nodes connect to other low-degree nodes. All three topological architectures presented above showed positive assortativity. However, assortativity increases from healthy participants to recAN to acutely ill AN (acAN). We found this pattern of increase in the actual data. An exploratory analysis on the AUC assortativity values confirmed significantly higher values in recAN (meanAUC = 3.45, s.d.AUC = 1.39) if compared with the acute patients (meanAUC = 4.23, s.d.AUC = 1.84; n = 35; W = 1278, p = 0.01) included in our previous study (Geisler et al., Reference Geisler, Borchardt, Lord, Boehm, Ritschel, Zwipp, Clas, King, Wolff-Stephan, Roessner, Walter and Ehrlich2016). HC showed the lowest assortativity (meanAUC = 2.90, s.d.AUC = 1.27) that was significantly different from recAN (W = 1131, p FDR = 0.031, see results section). See online Supplementary material 1.8 for more details.

Furthermore, compared with the HC, the global brain network architecture in recAN seems to have a subtle randomization of the small-world pattern with a reduced connectivity between node neighbors. This pattern has been previously reported in schizophrenia (Lynall et al., Reference Lynall, Bassett, Kerwin, McKenna, Kitzbichler, Muller and Bullmore2010) and obsessive compulsive disorder (Armstrong et al., Reference Armstrong, Moody, Feusner, McCracken, Chang, Levitt, Piacentini and O'Neill2016). Cabral et al. (Reference Cabral, Hugues, Kringelbach and Deco2012) modeled the influence of an aberrant structural connectivity on the functional connectivity. They discovered that structural dysconnection may result in a network reorganization characterized by a decrease in both small-worldness and clustering. Gray matter volume reductions are pronounced in acute AN, but largely reversible with weight restoration – suggestive of a state-effect (Wagner et al., Reference Wagner, Greer, Bailer, Frank, Henry, Putnam, Meltzer, Ziolko, Hoge, McConaha and Kaye2006; King et al., Reference King, Geisler, Ritschel, Boehm, Seidel, Roschinski, Soltwedel, Zwipp, Pfuhl, Marxen, Roessner and Ehrlich2015; Bernardoni et al., Reference Bernardoni, King, Geisler, Stein, Jaite, Nätsch, Tam, Boehm, Seidel, Roessner and Ehrlich2016). However, findings on white matter microstructure are more heterogeneous (Pfuhl et al., Reference Pfuhl, King, Geisler, Roschinski, Ritschel, Seidel, Bernardoni, Müller, White, Roessner and Ehrlich2016; Vogel et al., Reference Vogel, Timmers, Kumar, Nickl-Jockschat, Bastiani, Roebroek, Herpertz-Dahlmann, Konrad, Goebel and Seitz2016; King et al., Reference King, Frank, Thompson and Ehrlich2018). Remnants of structural dysconnectivity in recAN, which may not be detectable using standard DTI sequences, could potentially also explain differences in global functional network structure.
Changes in assortativity were also found in acutely underweight AN patients (Geisler et al., Reference Geisler, Borchardt, Lord, Boehm, Ritschel, Zwipp, Clas, King, Wolff-Stephan, Roessner, Walter and Ehrlich2016). An exploratory comparison (Fig. 3) of recAN and acute AN patients included in our previous study (Geisler et al., Reference Geisler, Borchardt, Lord, Boehm, Ritschel, Zwipp, Clas, King, Wolff-Stephan, Roessner, Walter and Ehrlich2016) indicates that recovering from AN is accompanied by a moderate decrease in assortativity – but assortativity is still higher than in HC. An (exploratory) follow-up analysis attempting to unravel the type of brain regions which drive the increase in assortativity revealed subtle group differences in local assortativity (which did not withstand our rigorous control for multiple testing) in nine predominantly occipital and parietal brain regions (see online Supplementary material Table S3). These additional findings suggest a global effect based on small changes in distributed brain areas. Since none of the group differences found in the current sample were related to age, BMI, depressive symptoms, eating disorder symptoms or leptin levels, also when controlling for age and BMI, it seems possible that hyper-assortativity represents a trait effect rather than a state effect of AN. Trait effects are assumed to be relatively independent of undernutrition (and other variables closely related to acute illness) and may function as predisposing factors. If confirmed, e.g. in subclinical samples, increased assortativity could potentially also serve as a biomarker which could help to identify at-risk individuals or tailor early interventions and treatment intensity.
In contrast, for the reductions in small-worldness index and CC, which were not (yet) observed in young (and mostly first-episode) underweight AN patients, an explanation that is centered on ‘scar’ effects from e.g. a prolonged phase of acute illness (and chronic undernutrition) seems equally plausible.
Unlike our previous studies in acutely ill patients where we showed reduced synchronization (Ehrlich et al., Reference Ehrlich, Lord, Geisler, Borchardt, Boehm, Seidel, Ritschel, Schulze, King, Weidner, Roessner and Walter2015) and network efficiency (Geisler et al., Reference Geisler, Borchardt, Lord, Boehm, Ritschel, Zwipp, Clas, King, Wolff-Stephan, Roessner, Walter and Ehrlich2016) in a thalamo-insular network, the current analyses of intermediate and local network characteristics in recAN showed no group differences after correcting for multiple comparisons. When considering the results before correction for multiple comparisons, however, nominally significant group differences seemed to follow a fronto-parietal pattern. However, a recent methodological study in AN (Lord et al., Reference Lord, Ehrlich, Borchardt, Geisler, Seidel, Huber, Murr and Walter2016) suggested that global graph metrics can be interpreted relatively confidently, while local findings may be more dependent on brain parcellation methods and need to be considered more carefully.
While potential biomarkers for a disorder are usually statistically significant at the group level, the discriminative ability of findings on an individual level are typically not evaluated (Arbabshirani et al., Reference Arbabshirani, Plis, Sui and Calhoun2017). Here, we appraised the diagnostic relevance of local graph metrics by predicting group membership using an SVC. The successful classification was driven by degree and BCI in parietal and temporal brain regions. The found discrimination accuracies of 70.4% is comparable with average accuracy levels in RSFC studies predicting group membership in other neuropsychiatric disorders (Arbabshirani et al., Reference Arbabshirani, Plis, Sui and Calhoun2017).
Our findings of altered global network topology extend previous results of more traditional RSFC studies in AN which focused on circumscribed networks or a few seed regions. However, a recent integrated review of RSFC studies in AN demonstrates that alterations of functional connectivity cannot be restricted to a few brain regions or networks (Gaudio et al., Reference Gaudio, Wiemerslage, Brooks and Schiöth2016). In detail, previous studies in acutely ill patients have shown altered RSFC in widely distributed regions of the brain, such as between the dorsal anterior cingulate cortex and the precuneus, the inferior frontal gyrus, parts of the ventral attention network, and within the somato-sensory network. Moreover, alterations do not seem to be limited to the neocortex, but also occur between subcortical and cortical regions, namely between the thalamus and the dlPFC (Biezonski et al., Reference Biezonski, Cha, Steinglass and Posner2016) as well as between insula and ventral striatum (Frank et al., Reference Frank, Shott, Riederer and Pryor2016). Apart from our previous studies, only two other known reports in AN using somewhat comparable local metrics exists (Kullmann et al., Reference Kullmann, Giel, Teufel, Thiel, Zipfel and Preissl2014; Gaudio et al., Reference Gaudio, Olivo, Beomonte Zobel and Schiöth2018). Results of these studies (conducted in acutely underweight AN) suggested reduced degree centrality (the sum of weights of significant connections for a voxel) in the inferior frontal gyrus and reduced connectivity in a subnetwork involved in somatosensory and interoceptive information processing.
Only a small number of studies have examined RSFC in weight-recovered AN patients. Results suggest that some alterations in functional connectivity in the fronto-parietal (Boehm et al., Reference Boehm, Geisler, Tam, King, Ritschel, Seidel, Bernardoni, Murr, Goschke, Calhoun, Roessner and Ehrlich2016), the default mode (Cowdrey et al., Reference Cowdrey, Filippini, Park, Smith and McCabe2014), and the somato-sensory network (Favaro et al., Reference Favaro, Santonastaso, Manara, Bosello, Bommarito, Tenconi and Di Salle2012) may persist after recovery. One previous study applied a graph–theoretical analysis approach to white matter tractography data (Zhang et al., Reference Zhang, Leow, Zhan, GadElkarim, Moody, Khalsa, Strober and Feusner2016) and found abnormal modular structural organization in the form of shifted frontostriatal and fronto-cingulate coupling in weight-restored patients. Although these findings may be seen as complementary, future studies including AN patients at different stages of their illness as well as longitudinal studies are warranted.
Limitations
When considering our work, some important limitations have to be taken into account. First, as properties of graph networks also depend on the chosen brain parcellation and preprocessing algorithm (Fornito et al., Reference Fornito, Bullmore and Zalesky2017), the current results are not independent from the chosen processing pipeline – even though we followed the current standards in the field. This standard analysis also neglects to capture dynamic changes in network configurations and only takes positive edge weights into account. There is increasing evidence suggesting the importance of negative correlations within brain networks of individuals with psychological symptoms (Castellanos et al., Reference Castellanos, Margulies, Kelly, Uddin, Ghaffari, Kirsch, Shaw, Shehzad, Di Martino, Biswal, Sonuga-Barke, Rotrosen, Adler and Milham2008; Fox et al., Reference Fox, Zhang, Snyder and Raichle2009; Whitfield-Gabrieli and Ford, Reference Whitfield-Gabrieli and Ford2012). Second, the cross-sectional nature of the study does not allow differentiation between a true trait marker or a possible scar effect of the disorder regarding the observed differences in brain network architecture in recAN. To clarify whether those neural substrates are a consequence or a potential precursor of pathologic eating behavior, future longitudinal studies are needed. Third, the results of the study are limited to the brain function at rest and the specific metrics investigated. Further investigations of trait-level reconfiguration during task performance and using other metrics such as modularity could provide a deeper understanding of the neurobiological processes (Vatansever et al., Reference Vatansever, Menon, Manktelow, Sahakian and Stamatakis2015). Fourth, although our samples were meticulously age-matched, effects of age on network configurations cannot be ruled out entirely. However, the large and homogeneous sample consisting of relatively young and almost exclusively unmedicated recAN may be viewed as a strength of our study.
Conclusion
The current study, which is the largest RSFC study in recAN to date, provides evidence for altered global brain network architecture in recovered AN patients, indicating a wide-scale disturbance in information flow across brain networks. Of note, a configuration in which high degree nodes are preferentially connected with similar high degree nodes and vice versa seems to characterize patients with acute as well as recovered AN, suggestive of a trait that may predispose to the illness or an early effect of undernutrition that does not normalize with recovery. Our findings provide new insights into the neurobiology underlying this disorder by providing support for an ‘altered global network architecture’ perspective. Furthermore, this study is a large step toward better predictive ability to classify patients at an individual level using brain-based biomarkers which potentially could help diagnosing AN early and may guide the selection and timing of treatments.
Supplementary material
The supplementary material for this article can be found at https://doi.org/10.1017/S0033291718004002.
Author ORCIDs
Daniel Geisler 0000-0003-2076-5329; Viola Borchardt 0000-0003-4928-051X; Ilka Boehm 0000-0003-0194-7557; Joseph A. King 0000-0002-2864-5578; Friederike I. Tam 0000-0001-8333-867X; Michael Marxen 0000-0001-8870-0041; Ronald Biemann 0000-0002-0820-8231; Veit Roessner 0000-0002-1873-7081; Stefan Ehrlich 0000-0003-2132-4445
Acknowledgements
The authors would like to express their gratitude to all associated research assistants for their help with participant recruitment and data collection and thank all participants for their time and cooperation. We thank the Center for Information Services and High Performance Computing (ZIH) at TU Dresden for generous allocations of computer time.
Financial support
This work was supported by the Deutsche Forschungsgemeinschaft (EH 367/5-1, EH 367/7-1, SFB 940/1, SM 80/5-2, SM 80/7-1, SM 80/7-2) and the Swiss Anorexia Nervosa Foundation.
Conflict of interest
Outside the submitted work in the last 3 years, Dr Roessner has received payment for consulting and writing activities from Lilly, Novartis, and Shire Pharmaceuticals, lecture honoraria from Lilly, Novartis, Shire Pharmaceuticals, and Medice Pharma, and support for research from Shire and Novartis. He has carried out (and is currently carrying out) clinical trials in cooperation with the Novartis, Shire, and Otsuka companies. All other authors report no biomedical financial interests or potential conflicts of interest.