Introduction
Plebiscites are government-initiated popular voting processes on government-formulated questions. Why do autocracies celebrate plebiscites? Over one in four (27%) of the 578 individual dictators listed by Cheibub et al. (Reference Cheibub, Gandhi and Vreeland2010) called for at least one plebiscite during their tenure and often more than one (an average of 1.7 per plebiscitarian dictator). Most plebiscites were won by overwhelming majorities; they were likely to be manufactured and unlikely to be taken at face value. We argue that the major role of dictator-initiated popular consultations is not to feign democracy; they are best seen as an intimidating mechanism aimed to discourage or to overcome opposition, both outside and inside the regime. They do so by facilitating the coordination of supporters and hindering the coordination of opponents, by sending the signal that almost anyone could be a supporter. A successful plebiscite also raises the status of the dictator inside the regime and can potentially overcome whatever division of power that may exist within the regime. In contrast to authoritarian elections, we contend that they are part of the repressive rather than the inclusive repertoire of the dictator’s bag of tricks.
On 6 July 1947, a plebiscite was celebrated in Spain to approve General Franco as a dictator tenured for life and proclaim the youngest heir of the monarchy as his successor. Voting was hardly autonomous: voters without ID, the majority, had to use their ration cards, work permits, or other specially issued documents signed for the purpose of identification. Only the official campaign was allowed. News of a resounding victory was already in the press the morning after; later and officially, 80% of electors were reported to have voted and 93% of these were reported to have voted yes. It is difficult to believe that anyone believed in it. What did General Franco stand to gain from this after having won a civil war (1936–1939) and survived World War II, having control over the army and the support of the Church, and having had this law already passed by his own legislative chamber? He was not collecting information, instead the information travelled rather the other way; he was not fooling the Allied Powers any more than the illegal opposition, unless they wanted to be fooled. A militant Francoist historian later pointed to a simple key to understanding this: ‘The referendum was convoked to show that […] very little was possible in the way of resistance, and that goal was achieved’ (Luis Suárez, Reference Suárez2001, cited in Romero-Pérez Reference Romero-Pérez2009, p. 145). We believe he was right.
Plebiscites have been used by modern dictators since Napoleon (Penadés, Reference Penadés, Albertos, Damiani and González2017), and contemporary case studies from every continent indicate that, in the hands of authoritarian leaders, plebiscites may contribute to pre-empt democratization or to facilitate authoritarian involution (Bratton and Lambright, Reference Bratton and Lambright2001; Silitski, Reference Silitski2005; Kalaycıoğlu, Reference Kalaycıoğlu2012; Dominioni, Reference Dominioni2017; Penfold, Reference Penfold2010). Yet the large-n comparative and analytical literature on authoritarian institutions has not paid any attention to them.Footnote 1 The comparative study of referendums has paid limited attention to authoritarian plebiscites, with at least two important exceptions. Altman’s comprehensive book (Reference Altman2010) contains a chapter on the topic with important qualitative comparative insights, but his hypothesis (that plebiscites may serve to create the illusion of democracy, or to show strength inside the country and abroad, or to establish emotional bonds) are not tested empirically with his data. Instead, in his quantitative analysis, Altman combines democracies and dictatorships for the 1985–2009 period, under the leading hypothesis that the more democratic the regime and the more dispersed the power, the more likely that plebiscites occur. However, it seems to us that it is an open question whether the same mechanisms that explain plebiscites in democracies should explain them in dictatorships, and the specific qualitative analysis of dictatorships offered by the author does not sustain an affirmative answer. We shall argue that we expect to find plebiscites where power is more dispersed within an authoritarian regime, but not because they are a democratic reflex, but because they are a show of strength.
Again, Qvortrup et al. (Reference Qvortrup, O’Leary and Wintrobe2020a) specifically aim to explain the question of direct voting under dictatorships and present useful hypotheses, but they restrain their analysis to positive cases and attempt to sort out the most rigged voting processes among them. In their empirical analysis, their dependent variable is not the celebration of plebiscites, but whether they reach 99% of the votes once they are celebrated. This does not seem the most adequate test for general hypotheses about the rationale of direct voting mechanisms, including their own.
Research on authoritarian regimes stresses the role of elections and nominally representative institutions as power-sharing mechanisms, as instruments for policy concessions, or as attempts to co-opt dissenters (Wintrobe, Reference Wintrobe1998; Gandhi and Przeworski, Reference Gandhi and Przeworski2007; Gandhi and Lust-Okar, Reference Gandhi and Lust-Okar2009; Svolik, Reference Svolik2012; Boix and Svolik, Reference Boix and Svolik2013; Geddes et al., Reference Geddes, Wright and Frantz2018). Similar explanations cannot be extended to plebiscites. As a matter of empirical fact, we shall show that the circumstances that favour the celebration of plebiscites are different from those that make authoritarian elections more likely or more competitive. Plebiscites do not generally betray a willingness to accept constraints, but to overcome them; not the willingness to give a limited voice to opponents, but to silence them.
We aim to add to the comparative research on authoritarianism by taking a stance that diverges from the view, very influential in the study of direct democracy (Altman, Reference Altman2010, p. 76) that the celebration of plebiscites constitutes an instrument for democratization or liberalization.
We make two assumptions and derive four main empirical consequences that are consistent with the evidence collected for dictatorships in the years 1946–2008. First, plebiscites reinforce the dictator over other actors in the regime. This is akin to the strategic advantage of the executive in a democracy when it controls the agenda of a referendum (Hug and Tsebelis, Reference Hug and Tsebelis2002). As a result, they are expected to be more frequent where the potential sources of internal opposition are more institutionalized and the power more dispersed, as is the case in relatively competitive dictatorships. They are an illiberal tool to counteract some of the effects of liberalization. Again, they are also expected when personal rule is more unstable. Unlike in the case of elections (Gandhi and Przeworski, Reference Gandhi and Przeworski2007; Geddes et al., Reference Geddes, Wright and Frantz2018), the military is more prone than civilian dictators to convoke plebiscites.
Second, plebiscites help create the expectation of extensive support, giving the true supporters the opportunity to organize, to enlist the non-committed and to silence the opponents. Unlike liberalization measures, they are expected to be frequent at an early stage. Plebiscites, like authoritarian elections, are also less likely to occur in divided societies. But while the standard argument holds that social polarization tends to decrease the tolerance to pluralism (Gandhi and Przeworski, Reference Gandhi and Przeworski2007), we would like to argue differently: in divided societies, it is harder to give credence to the illusion of universal support across groupings, hence the result of plebiscites may either be less successful or less credible, and consequently they are less potentially useful for the dictator.
Other authors have pointed out that plebiscites may have, in some circumstances, a repressive potential (Qvortrup et al., Reference Qvortrup, Morris, Kobori and Qvortrup2018 and Qvortrup, Reference Qvortrup2020b). We wish to argue that this is the general case under authoritarianism: despite the unusual role that some plebiscites may have played in a few democratization processes, their statistical occurrence is better understood by considering their distinct value in supporting the creation and perpetuation of autocratic regimes. Our contribution reinforces the view that there is nothing intrinsically ‘democratic’ or ‘direct democratic’ about popular vote processes such as plebiscites but that their qualities depend on the democratic and representative framework in which they are embedded (Caramani Reference Caramani2017; Chevenal and el-Walik, Reference Cheneval and el-Walik2018a and Reference Cheneval and el-Walik2018b; Trueblood, Reference Trueblood2020).
The role of plebiscites in authoritarianism
What is the nature of authoritarian plebiscites? For the purpose of this research, we define plebiscites procedurally and include all authoritarian referendums. Their defining features are that both the timing and the question are controlled by the ruler, not their results. The word referendum in political science is usually meant to cover all the diverse mechanisms of direct voting by the electorate on all sorts of political decisions. We follow Altman (Reference Altman2010) in making a basic differentiation between top-down and bottom-up mechanisms and identifying authoritarian referendums as members of the former class. Not surprisingly, we do not observe bottom-up referendums in a dictatorship, namely, those where non-government actors may initiate a process to introduce or to veto a piece of legislation by means of the popular vote. About two-thirds (62%) of the referendums convoked by authoritarian rulers between 1946 and 2008 are classified as top-down plebiscites in the Centre for Research on Direct Democracy (C2D),Footnote 2 while the rest – save for a few cases – are classified as constitutional (34.4%). In a democratic context, it makes sense to distinguish a third category of referendums, the mandatory constitutional ones. Yet, we assume that the initiative on a constitutional process under a dictatorship lies on the hands of the dictator and that the eventual consultation is considerably closer to a discretionary plebiscite than to a truly mandatory referendum in a democracy. However, see the section on data and methods for an alternative operationalization.
Few would dispute that the Franco 1947 Constitutional Referendum for perpetuating his dictatorship was an authoritarian plebiscite pure and simple, although he was ostensibly meeting the requirements of his own Fundamental Laws; but some might doubt that extreme cases like Pinochet’s 1988 plebiscite, which he lost and obeyed, could be so considered. However, we cannot infer from the final result that the dictator had no other option than to convoke it in the moment and in the way he did, as a democratic leader would. Pinochet was given other choices besides celebrating a referendum with pessimistic forecasts, which he decided to reject, overestimating his popularity and fearing the consequences of losing face (Walker, Reference Walker2003). Yet, some constitutional plebiscites defy our conceptualization as genuine authoritarian tools, particularly those that actually ushered in democracy, as a more or less willing ‘institutional suicide’, like the cases of Spain in 1976 (Sánchez-Cuenca, Reference Sánchez-Cuenca2014), Uruguay in 1980 (Rilla, Reference Rilla1997; Gillespie, Reference Gillespie1985), and Chile in 1988 (Barros, Reference Barros2002). To different degrees, those dictatorships became entrapped in their own institutional rules, an argument forcefully made by Barros (Reference Barros2002), and the plebiscites signed the transition to democracy. But we shall not adapt our procedural definition to tailor out cases that might contradict the hypothesis we derive from our conceptualization.
How do plebiscites differ from authoritarian elections? Plebiscites are a form of popular voting but, unlike elections, they do not constitute prima facie evidence of liberalization. Authoritarian plebiscites have some obvious differences with authoritarian elections that invite a different application: the control of the process is tighter and the scope for power sharing or the incorporation of opponents is far more limited, when not irrelevant. First, plebiscites are discretionary and not expected to be regular: the timing is in the hands of the executive without that constraint. Second, the control of the agenda is complete, for the choices on the ballot are written by the autocrat. This happens without any ostensible use of force: while candidates to an election must be either allowed or banned, issuing a question is a direct executive act. Third, even if the policy voted for may bring in some potential dissenters – as Franco did with some of the Monarchists in the example we started with – those are not co-opted by means of a corporate representation and their support is not measured, truthfully or otherwise. Fourth authoritarian plebiscites can be won by the most outstanding of margins and still keep a semblance of credibility, for huge margins are not unknown to some democratic consultations (e.g., the French Constitution was approved in 1958 by 82.6% of the voters, and the participation of 80.6% of those entitled to vote, figures not too different from Franco’s alleged result a decade earlier).
Authoritarian elections need to leave some room to the opposition, whereas virtual unanimity is not ruled out in plebiscites. In the 876 questions made by dictators and recorded in the Centre for Research on Direct Democracy (C2D)Footnote 3 at Aarau (Switzerland) between 1945 and 2005, the average victory margin is an outstanding 70 percentage points, and the average participation (only recorded for 366 questions) is 77.3%.
What do plebiscites do? Authoritarian plebiscites have at least two complementary roles. One is to consolidate the dictator vis a vis their potential challengers inside the regime. The other is intimidating society enough to prevent the coordination of dissenters. They may sometimes entail concessions to opponents or constraints to the government, but we argue that their major function is to discourage opposition rather than to bring it in.
We assume that plebiscites have a potential role in reinforcing the dictator against potential rivals within the regime analogous to their reinforcing of the executive in the democratic case. In the context of a democracy, plebiscites are the most common species of the category that Hug and Tsebelis (Reference Hug and Tsebelis2002) call ‘Veto Player Referendums’, that is, consultations in which the agenda (both the timing and the wording of the question) is controlled by an institutional veto player. In our definition of plebiscites, this player is the chief of the executive. Their theoretical expectation is that whereas other types of referendum, like ‘Popular Vetoes’ or ‘Popular Initiatives’, may redistribute power by introducing a new player in the political game, ‘Veto Player Referendums’ can only help override existing players and reinforce the agenda setter. A rational and informed player will only use the discretionary power to convoke a plebiscite when he can pick the timing and the specific policy position to improve on the status quo.
We expect to observe plebiscites more often where dictators may need to override the potential opposition of other actors within the regime. Paradoxically, in some cases, the frequency of plebiscites will be associated with the relative pluralism of the regime, but for what we might call the wrong reasons: not because plebiscites are a species of the genus, however, democratically corrupted, of the authoritarian elections, but because they may help to counteract some of the effects of internal contestation that may come with elections. We suggest that the correlation is grounded neither in some generally expected link between democratic practices and ‘direct democracy’ nor in the specific need to overcome stalemates in consensual decision making (Altman, Reference Altman2010, p. 76). An almost pure example of the kind of situation we have in mind was the 1953 Iranian parliamentary dissolution referendum, where the executive successfully overruled the opposition of another institutional actor within the authoritarian regime, until the chief executive was in turn deposed, this time by military action (Efimenco, Reference Efimenco1955; Randjbar-Daemi, Reference Randjbar-Daemi2017).
Hypothesis 1: Plebiscites are more likely when the level of institutionalized competition within the regime is higher.
To reinforce our hypothesis plebiscites should also be associated with other forms of vulnerability that have little relation to democracy. The median tenure in power of the dictators listed by Cheibub et al. (Reference Cheibub, Gandhi and Vreeland2010) is 4 years for the military, 6 years for civilians, and 14.5 years for kings. Since military rulers are the most threatened kind of dictators, we expect them to be the most likely to call for plebiscites. A typical case may be Pinochet’s 1978 so-called ‘national consultation’, aimed in part to establish his pre-eminence over the military Junta (Barros, Reference Barros2002, p. 111). Since monarchs have the best-established rules for succession in power and have longer expected mandates, they should be the least likely to call for plebiscites.
Hypothesis 2: Military dictators are more likely to call for plebiscites than civilian dictators, and monarchs are the least likely to do it.
Even authoritarian rule depends on a measure of consent. We pose that a second major role of plebiscites is to prevent the coordination of dissenters. Coordination depends on common knowledge: even if opposition is substantial, collective action may be prevented by want of such knowledge about the readiness to oppose the regime by others (Chwe, Reference Chwe2001; Reference Chwe1999; Thomas et al, Reference Thomas, DeScioli, Haque and Pinker2014). A plebiscite achieves that purpose by obtaining a huge, even incredible, level of support. From the point of view of the individual actors, the overwhelming result of the plebiscite sends the message that every other person could potentially be a regime supporter, or at least be ready to pass as one. Hence, communication about political beliefs is risky, and as a result coordination is less likely and so is collective action against the regime.
Simpser (Reference Simpser2013) finds that inflated election results under authoritarianism have a similar impact on the potential opposition, but his mechanism is not the same as ours. In short, Simpser argues convincingly that the manipulation of elections is a costly signal of power and that it discourages the opposition, whereas we do not consider manipulation necessary, just a large victory. Manipulation is compatible with our mechanism, but whereas for Simpser blatant manipulation can work as an effective signal, for us the most effective manipulation is the less blatant one. When a dictator tinkers with the size of the ‘yes’ and ‘no’ words printed on the ballot – to take a usual case of mild manipulation – the message to dissenters is not primarily that the dictator is powerful but that a small incentive is often enough to elicit support for the regime.
Kuran (Reference Kuran1997) discussed the phenomenon of falsification of preferences as responsible for the stability of some collective lies, including the consent to authoritarian regimes. Macy and his co-authors (Centola et al, Reference Centola, Willer and Macy2005; Willer et al, Reference Willer, Kuwabara and Macy2009) show that social conformity may lead non-believers not just to comply but also to punish other non-believers for not complying. That implies that potential dissenters may find a reason not to disclose their attitudes even if they believe others are only fake supporters. As Chwe (Reference Chwe1999) pointed out by commenting on the absurdly oversized network of secret informants in the German Democratic Republic, that their role was not to collect information but to block the diffusion of information, preventing coordination among dissenters. Mutatis mutandis, an absurdly successful plebiscite, may have, even for a brief period, a similar effect. Private communication of dissent is likely to be resumed in the form of a ‘hidden transcript’ (Scott, Reference Scott1990) and no dictatorship can do without police, but such public display of support makes its job easier.
Plebiscites can be considered acts of legitimation, if by legitimation we understand the conspicuous absence of organized opposition (Przeworski, Reference Przeworski, O’Donnell, Schmitter and Whitehead1986). Behaviour precedes belief; legitimacy must be unquestioned before it becomes unquestionable (if it ever does). Qvortrup et al. (Reference Qvortrup, O’Leary and Wintrobe2020a) use the expression ‘concessio imperii’ to refer to this feature of plebiscites. We do not need to assume that private beliefs change, although they may well do. As acts of legitimation, establishing consent for the regime as the only game in town, they should happen early, when information is scarce, and the opposition has not had the opportunity to organize.
Hypothesis 3. Plebiscites are expected to be more frequent at an early time in the dictator’s tenure.
A potentially relevant change in beliefs induced by a plebiscite may not be about the mean but the variance of the probability that an individual may be, or behaves as, a supporter of the regime. The information role of elections under authoritarianism has normally been considered as a means to collect information on the level of support for the dictator (Gandhi and Lust-Okar, Reference Gandhi and Lust-Okar2009), but others have changed the source: Rozenas (Reference Rozenas2012) poses that the problem is about how the autocrat can communicate a high enough level of support when there is no free speech; for Simpser (Reference Simpser2013) the inflated results communicate the dictator’s control over non-transparent institutions. We agree that the receptor of the information is the public, not the autocrat, but we suggest that the information content is not only, or primarily, the aggregate support but its spread. An observable consequence of this should be that culturally divided societies are less prone to successful authoritarian plebiscites than homogenous ones, for in divided societies the regime is likely to be more popular among one group rather than others and this is likely to be common knowledge. Authoritarian elections are also supposed to be less common in divided societies (Gandhi and Przeworski, Reference Gandhi and Przeworski2007), but whereas it is assumed that the reason for this is a resistance to pluralism in heterogeneous societies, we suggest that the reason for the less frequent occurrence of plebiscites is a more limited ability to introduce uncertainty on the social distribution of the regime’s support in that context.
Hypothesis 4. Plebiscites are more likely in homogeneous societies.
In sum, we have four expectations derived from the two main roles we attribute to plebiscites under authoritarian rule. They are expected to be relatively more frequent in more competitive regimes, in military regimes, early in the dictator’s tenure, and in homogeneous societies. We do not claim that they do not play other roles too, beyond discouraging the internal and external opposition, but we show that these two leave clear marks in the structure of the evidence. Now, we will address the empirical side of our research.
Data and variables
To test our hypotheses, we need two fundamental sources of information: one for autocracies and another for plebiscites. First, we will refer to the catalogue of autocracies. We used Cheibub et al. (Reference Cheibub, Gandhi and Vreeland2010) ‘Democracy and Dictatorship Revisited’ Database, which classifies the different regimes between democratic or authoritarian, while also adding a necessary classification between different authoritarian political configurations: monarchies, military dictatorships, and civilian dictatorships. In their work resides our base reference on what and when is a regime classified as an autocracy and their different types.
The data source for plebiscites is the Centre for Research on Direct Democracy (C2D) database.Footnote 4 Their data for voting events have a day-level precision measure, so we collapsed this information into a yearly unit of time. This allowed us to know the number of plebiscites in a given year, but since our interest was not on how many plebiscites took place, but if a plebiscite took place at all, this variable was subsequently transformed.
As we just mentioned, our level of analysis is the country-year, going from 1946 to 2008. Let us remember that our focus is the use of plebiscites. As such, the dependent variable is a dichotomous variable that holds ‘1’ for a country-year in which at least one plebiscite took place and ‘0’ for the opposite situation.
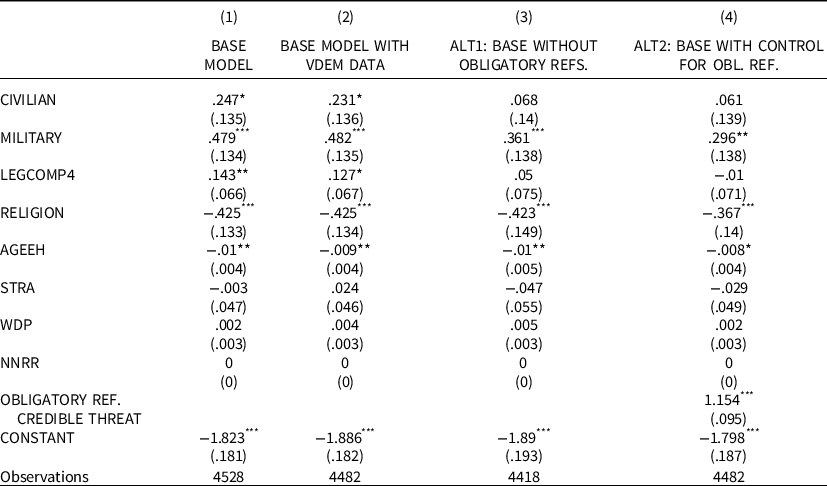
A concern regarding mandatory referendums may arise. To err on the side of caution, in the Appendix (A6), we statistically address this issue using the Varieties of Democracy Database in two ways: eliminating obligatory referendums and adding an obligatory referendum threat as a control variable to the model. Both show convergent results with the main findings of our main model, with the exception of the civilian and LEGCOMP variables which lose significance.
Returning to Cheibub, Gandhi, and Vreeland’s Database (Reference Cheibub, Gandhi and Vreeland2010), we used their regime sixfold classification. From these, the three democratic classes are disregarded, and the three autocratic remainders are used. These are royal, military, and civilian dictatorships. We followed Cheibub et al. (Reference Cheibub, Gandhi and Vreeland2010) operational definitions of these terms. Monarchies are regimes in which the dictator rules under a monarchic title and have been preceded or succeeded by a relative, meaning self-proclaimed monarchs are not classified likewise. Military dictatorships are those in which their leader is a current or past member of the armed forces. Regimes that did not fit any of these two definitions are classified as civilian. These three are dummy variables and since including every category in a regression simultaneously would cause perfect multicollinearity, we use only the military and civilian variables, leaving monarchies as base category.Footnote 5 Nevertheless, we will study the effect on monarchies in the final part of the empirical analysis.
Before addressing the other variables, we must mention why we used this kind of discrete classification of democracy and not gradual options like Polity IV or Freedom House’s classifications. The main reason is that the scope and dynamics of democratization is outside our analysis. We needed classifications of which country is autocratic, not a quantification of its autocratic measure, redeeming us of setting a threshold between autocratic and democratic regimes. Also, plebiscites may be considered to be pseudo democratic or transitional instruments – especially in competitive authoritarian regimes – correlating the measures of democracy towards those countries with a tendency to use plebiscites. In order to avoid such drawbacks, a discrete measure was chosen.
We introduced a modified variable from the Geddes et al. (Reference Geddes, Wright and Frantz2018) database to cover internal institutionalized opposition. This variable is ‘legislative competition’ (‘legcompetn’ in original source). This variable measures the level of parliamentary pseudo-competition a dictatorship has in its legislative system, from value ‘0’, meaning ‘no legislature available’, to ‘8’, meaning that at least a quarter of the parliament’s seats belong to opposition parties. We are not interested in the intermediate or lower values not only because no real opposition takes place but also because we are not interested in the subtleties of how a dictator organizes a rigged parliament. Therefore, information regarding how the autocrat builds this institution is discarded. In sight of this, we transformed the original variables into a dichotomous variable that takes value ‘1’ if at least one competitive multi-candidate election exists (‘5’ in their scale) and onwards, and ‘0’ otherwise. We call this variable ‘legcomp4’.
We also added independent variables from other sources. We used a religious fragmentation variable from Alesina et al (Reference Alesina, Devleeschauwer, Easterly, Kurlat and Wacziarg2003) as a proxy for general fractionalization in the society. This is a country fixed variable and therefore remains unchanged throughout the whole period of measurement. Although this is a negative aspect, we do not expect significant changes in most countries in their religious fragmentation.Footnote 6 Their alternative ethno-linguistic fragmentation index has no significant impact in the probability of plebiscites, mirroring the problem found by Gandhi and Przeworski (Reference Gandhi and Przeworski2007) while testing the two indices for predicting authoritarian elections. They suggested that this may be due to measurement problems and we are inclined to think that this is the case.
We also used two variables inspired by Gandhi and Przeworski (Reference Gandhi and Przeworski2006; Reference Gandhi and Przeworski2007). These two variables are the ‘world’s democracy percentage’ (WDP) and the ‘sum of past transitions to autocracy’ (STRA). Both variables are extracted from their works, which were also a part of Cheibub et al. (Reference Cheibub, Gandhi and Vreeland2010) database. From this database, we also extracted the tenure of each individual dictator (AGEEH), which corresponds to the ‘age of effective leader’s spell’ in office, as described by the authors. This variable is especially meaningful since we account for an individual initiative and reinforcement from the autocrat. We consider that this is not a regime or country measure, but a progressive counter on the individual effective head of state.
Finally, we used a natural resources variable. The main reason we added this variable in the model is that it acts as a control variable. There is an extensive body of literature on how abundant natural resources (like oil or mining ore) are useful for dictators since they can obtain rents from them and so do not need cooperation, as Cardoso and Faletto (Reference Cardoso and Faletto1979) argue. Other schools of thought, like those of Haber and Menaldo (Reference Haber and Menaldo2011), have revised the former’s conclusions and hold the opposite. The variable we use is extracted from Haber and Menaldo (Reference Haber and Menaldo2011) and is the sum of every natural resource. In our research, the natural resources variable yields non-significant results. It is important to mention that this variable has a high correlation with various GDP measures considered in previous versions of the statistical model. Since natural resources adds more information to the model and has been studied more thoroughly by previous authors, we use natural resources, discarding GDP measures.
Table 1 contains the number of years in which a plebiscite took place in a given autocratic regime, which totals 271 years. We also have the observations per political regime as classified by Cheibub et al. (Reference Cheibub, Gandhi and Vreeland2010). In this preliminary examination of the data, we can already observe that less than half of the average plebiscites take place in monarchies, while military regimes are over 30% more likely to celebrate plebiscites than the average regime.
Authoritarian plebiscites and country year observations

Model specification
Having briefly described the variables, we will now describe the model. We tried to combine statistical appropriateness and comparability as does the previous literature on these issues. As mentioned above, our dependent variable is a dichotomous variable. This led us to use discrete choice models. We had two alternatives: probit or logit models. We chose a probit model specification as the prominent work from Gandhi and Przeworski (Reference Gandhi and Przeworski2006, Reference Gandhi and Przeworski2007) did so.
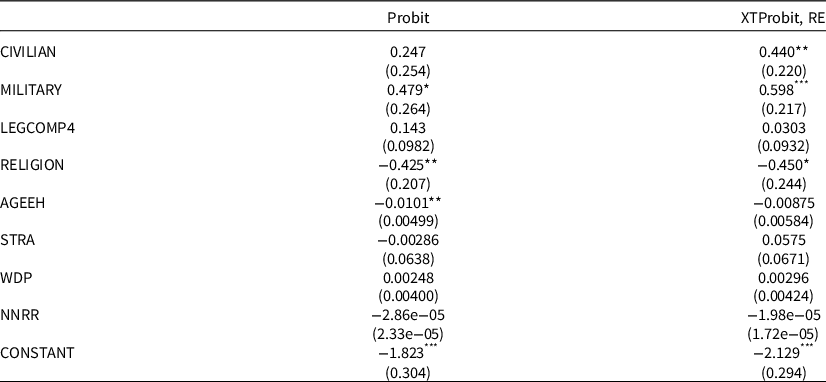
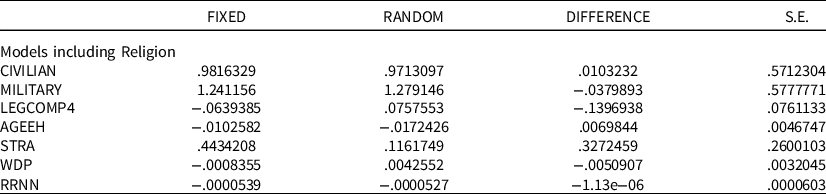
We also considered using panel specifications to address the shortcomings of time-series cross-section data, such as unobserved heterogeneity. For instance, some countries may have specific national conditions that may make them inclined to use plebiscites, an issue that needs to be addressed to be able to draw firm conclusions from the statistical model. To deal with this problem, we first tried a fixed effects logit model specification, which was discarded for three reasonsFootnote 7 : the use of a time invariant variable such as Religion which would be discarded entirely, the rejection of more than 1,600 observations of the dependent variable without variation (no plebiscite was used) and the results of the Hausman test (A10 in the Appendix). We carried out the Hausman test for models including and excluding the time-invariant variable ‘Religious Fractionalization’ to see if that would solve the problem. Both led us to the random effects model described in A2 in the Appendix.
In any case, logit or panel random effects models show convergent results with our final model (see Appendix). The only relevant difference we can find is the ‘legislative opposition’ variable in the panel regression, which loses significance. Except for this point, the results are practically equivalent.
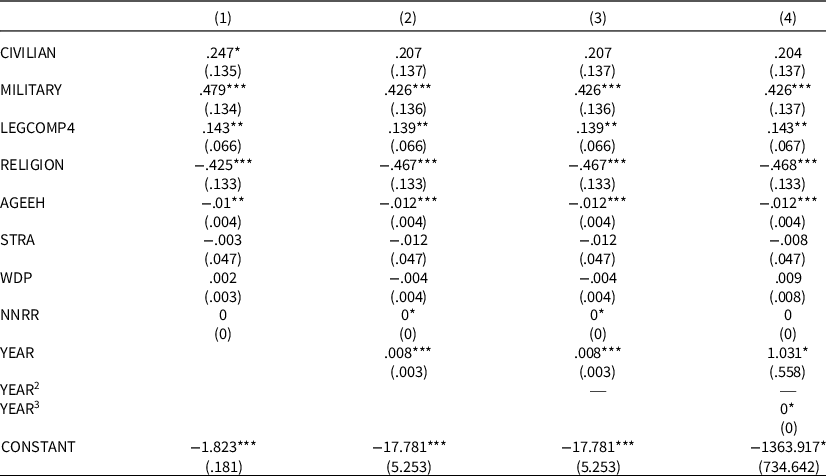
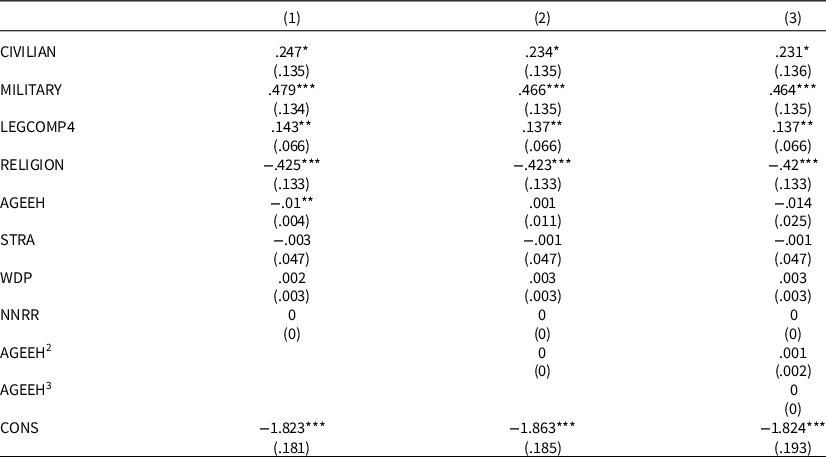
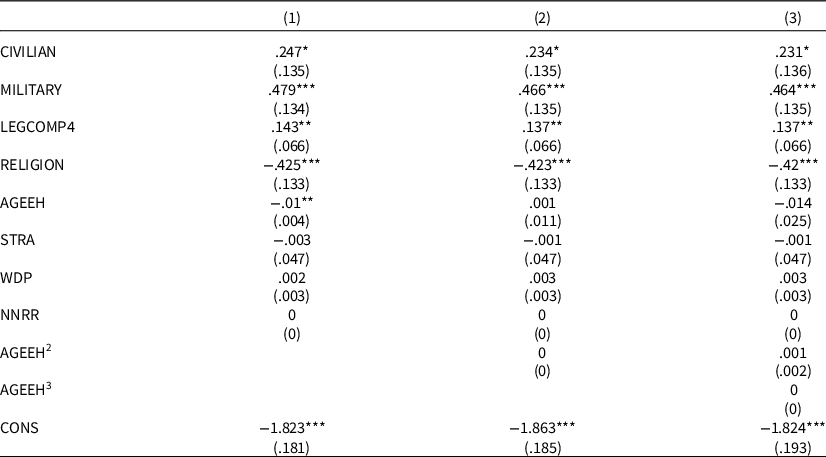
We also addressed potential time dynamics through a year polynomial (see Appendix). It shows convergent results – with the exception of the civilian variable, which loses significance – for all of the degrees of the time polynomial. We carried out the same exercise with the tenure of the dictator (Ageeh) to address possible nonlinear effects of the variable, but the polynomial was not significant. The other estimators remained convergent.
Regarding potential multicollinearity problems, we also include in A8 in the Appendix the correlation table for every variable used in our models, which show no alarming correlation figures for any crossed variable. To address potential auto-correlation problems, we have also included in A9 a robust errors model, clustering by country, which shows convergent results with our other models, both for the pooled and panel random effects specifications.
In the next section, we analyse the results of the model and its consequences for our expected hypotheses.
Analysis and discussion
To recap, we expect that an authoritarian ruler may find plebiscites useful in two ways: to consolidate his figure against potential inside challengers and to disrupt the outside perception of his own popularity. This leads us to expect that in autocracies in which parliaments are used, the dictator may find it useful to use plebiscites to overrule these institutions – even if he already controls them (H1). We would also expect that in regimes in which potential challengers are more likely to take place – military regimes – plebiscites should be more common than in others (H2). Other regimes with clear patterns for succession should have fewer challengers and should therefore use fewer plebiscites, such as we think is the case for monarchies. Additionally, we expect that the passing of time lowers the chances of using plebiscites. The initial steps of autocracy need ‘concessio imperii’ legitimacy, while common knowledge about opposition is better established as time passes – rendering plebiscites less useful (H3). Finally, we would expect that in more religiously fragmented regimes – and by extension, more socially fragmented regimes – plebiscites would be less effective since the popularity of the regime would be significantly more difficult to forge (H4).
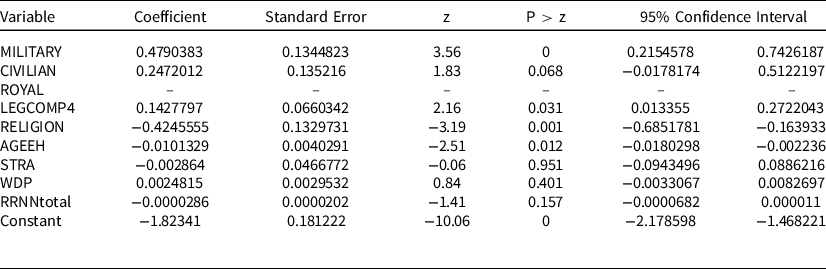
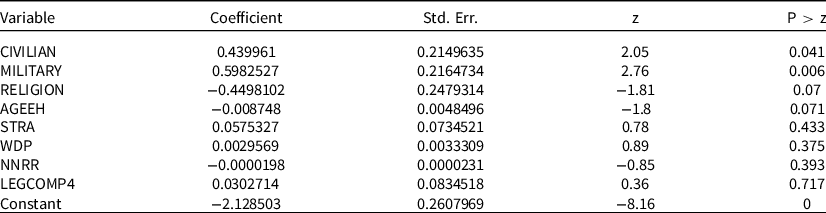
Table 2 contains the results of the probit model. Since regime is a threefold qualitative variable, estimation is unfeasible for the three variables at the same time as it would cause perfect collinearity. As such, we will begin with the military and civilian variables. Both show significant results: military shows a positive estimator sign with almost double the measure of civilian dictatorships. We can see that these positive estimators are already in line with our expectations regarding the regime specification. In the graphic analysis, we will deal with this issue in more depth.
Probit regression

Observations: 4,528. Prob > chi2 = 0.0000.
Notes: MILITARY and CIVILIAN extracted from Cheibub et al. (Reference Cheibub, Gandhi and Vreeland2010). They are two dummy variables that take value 1 when the autocratic regime is military (or civilian, respectively) and 0 otherwise. RELIGION is a time invariant variable extracted from Alesina et al (Reference Alesina, Devleeschauwer, Easterly, Kurlat and Wacziarg2003) which consists in a measure of how religiously fragmented a country is. AGEEH and STRA are extracted from Cheibub et al. (Reference Cheibub, Gandhi and Vreeland2010). AGEEH consists in the spell of the effective leader. STRA is the sum of past transitions to authoritarianism. NNRR are the total sum of natural resources as defined and extracted from Haber and Menaldo (Reference Haber and Menaldo2011). LEGCOMP4 is the transformation of the ordinal variable LEGCOMPETN extracted from Geddes et al (Reference Geddes, Wright and Frantz2018) into a dummy variable that takes value 1 when the level of opposition is 4 or more as defined by the authors.
We also find that the existence of parliamentary opposition stimulates the use of plebiscites, which is in line with our expectations. In the probit model, this estimator is significant and positive (as in the pooled model), but the finding in the panel effects model (see Appendix) that this variable loses significance leads us to moderate our hypothesis regarding this variable. Religious fractionalization is also a significant variable in our model. Religious fractionalization lowers the chances of holding a plebiscite. Again, this is in line with our hypothesis that in highly fractionalized societies, it is more difficult to block common knowledge, at least by means of plebiscites. Finally, tenure also shows a significant effect. The passing of time decreases the probability of celebrating a plebiscite, effectively following our expectations regarding time. Figure 1 contains the confidence intervals.
Estimators and 90% confidence intervals.

For our comparison variables, we find that the ‘sum transitions to authoritarianism’, ‘world’s democracy percentage’, and ‘natural resources’ variables are not significant. ‘Transitions to authoritarianism’, used as a proxy of repression to opposition, does not yield significant estimators. This may mean one of two things: that it is not a proper measurement for likelihood of repression – as the original authors of the variable suggest – or that repression is not significant. Since this is not the particular focus of our paper, we will go no further regarding repression. ‘World’s democracy percentage’ is another variable included in their models, but since the variable shows non significance, we may conclude that democratic spill-offs do not take place regarding plebiscites, or that we are unable to capture them. ‘Natural resources’ are also not significant. Again, this may mean one of two things: that the substitution-with-rents explanation is not correct for plebiscites, or – since natural resources is a variable highly correlated with GDP for autocracies – that income levels of countries do not affect the use of plebiscites.
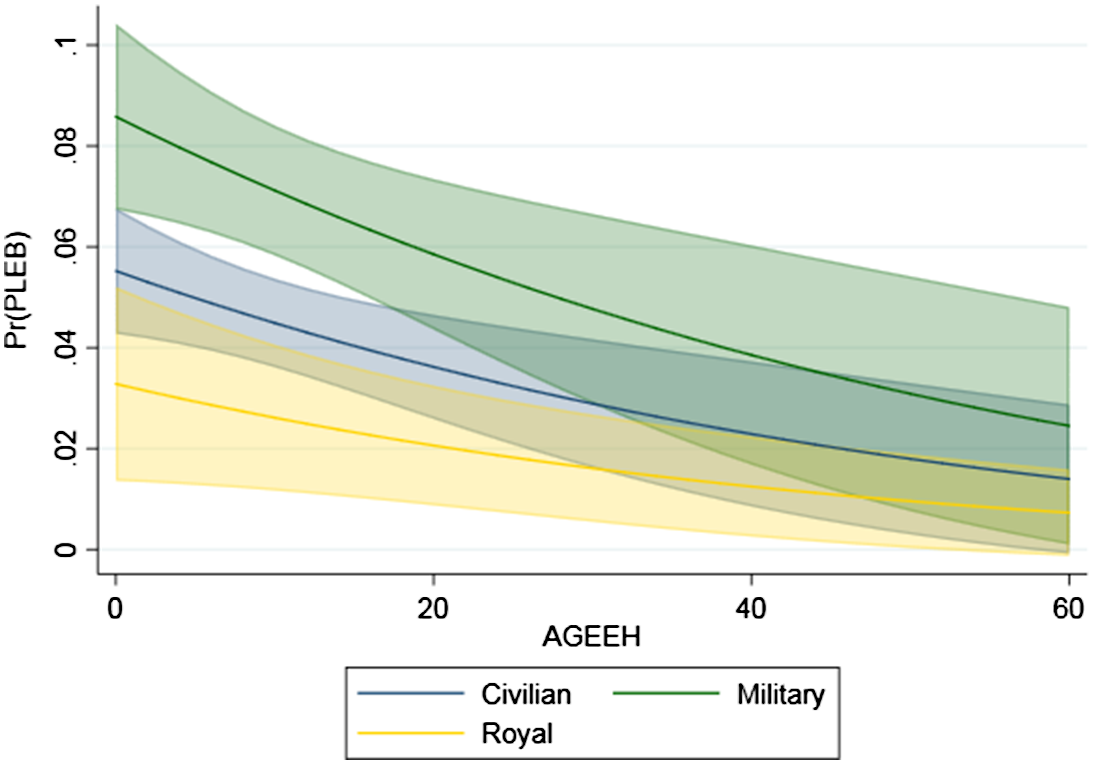
Figure 2 contains the results of the estimates of interaction between the regime variables and tenure. This figure also contains the estimates for the reference variable ‘royal’ dictatorships. First, from a static perspective, we can see the expected ranking between the regimes, with the highest probability of convoking a plebiscite for military regimes and the least for monarchies. In an in-between place, we find ‘civilian’ regimes. Second, from a dynamic perspective, we see that for the three regimes, the passing of time has a negative impact on the use of plebiscites. In the latter phases of a regime, however, we see that the difference between the three regimes is less clear.
Predictive margins of regime variable through regime tenures with 95% confidence intervals.

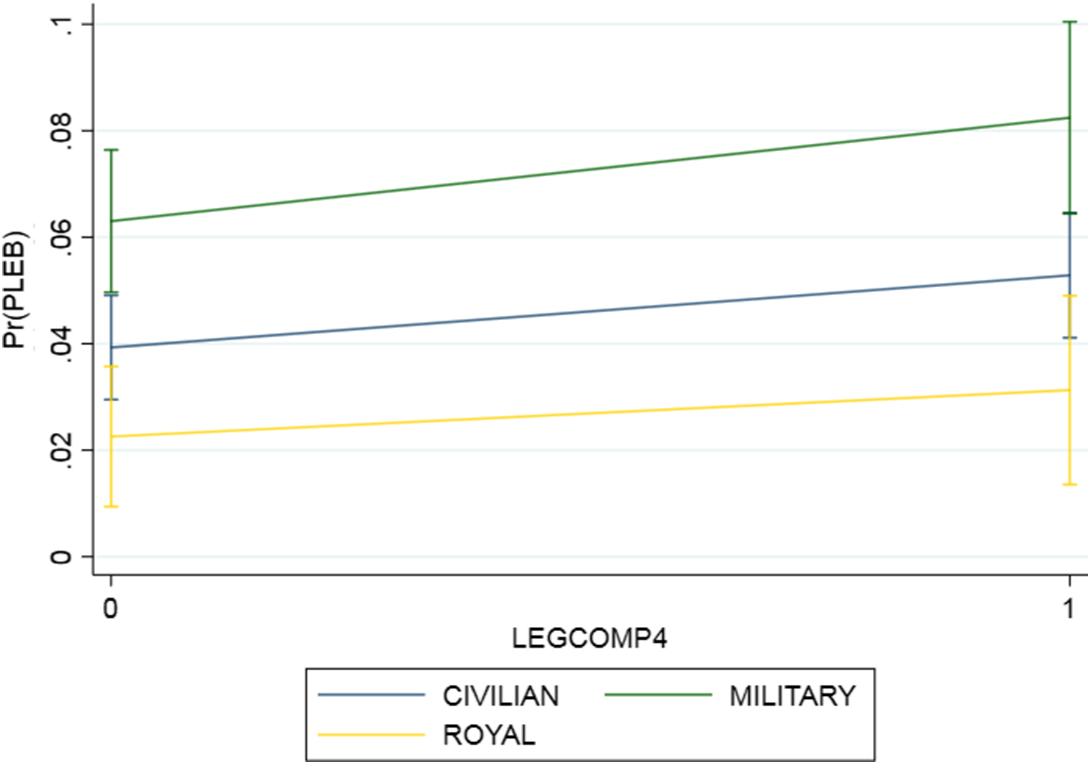
Figure 3 contains the results of the same exercise carried out for the existence of parliamentary opposition. It would seem that the existence of parliamentary opposition fosters the use of plebiscites. We also find the same static ranking between regimes.
Predictive margins of regime variable through parliamentary opposition with 95% confidence intervals.

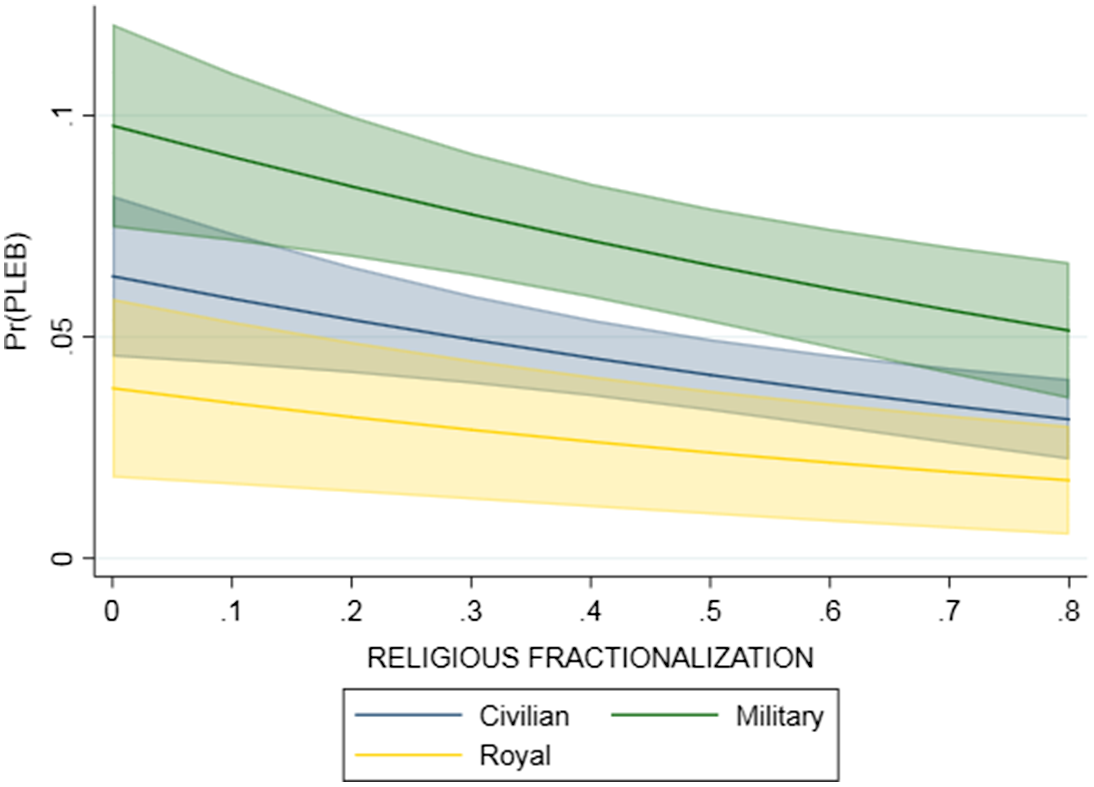
Finally, we plot the interaction between the three different regimes and religious fractionalization. The results are shown in Figure 4. As with the latter hypotheses, this is in line with our expectations: religiously fragmented regimes tend to use these instruments less as common knowledge is better established in these circumstances. We can see that for the three regimes, an increase of fractionalization is matched with a decrease in the probability of using plebiscites.
Predictive margins of regime variable through religious fractionalization with 95% confidence intervals.

We shall now summarize the above empirical results. We have found that regime specification (whether military, civilian or monarchic) has an impact on the use of plebiscites by autocracies (H2). This is related to the inner struggle of the regime between the dictator and his challengers, in which a plebiscite helps the autocrat to establish himself above other contestants. Since military regimes are the least institutionalized, they are the most likely to use plebiscites. On the other side of the scale are monarchies, in which the succession mechanism is clearly established, and contestants are less likely to appear. Therefore, monarchies will less likely use this instrument. In addition, we find that opposition inside a parliamentary institution – even when knowing this to be rigged – raises the likelihood of using plebiscites (H1). Tenure (H3), and fractionalization (H4) are two variables we expected to lower the chances of convoking plebiscites, and we found empirical evidence to support these expectations. For the first variable, we expected that in initial stages both the need for legitimation and the uncertainty of common knowledge would drive the regime to use plebiscitarian methods, which is what we found. For the second variable, religiously fragmented societies have a better established common knowledge, rendering plebiscites less useful.
We have found empirical evidence to support our expectations on authoritarian plebiscites: consolidation of the political figure of the autocrat versus internal opposition of whatever manifestation and introducing key uncertainty to hinder the collective action of the opposition.
Conclusion
We have argued that plebiscites can be regarded as an illiberal tool in the hands of authoritarian rulers, to overcome internal opposition and to help discourage external opposition. We have empirically shown that plebiscites are more likely in the case of military dictators, as well as in relatively competitive regimes, in religiously homogeneous societies, and early on in the dictator’s tenure. We have argued that the first two features derive from the strategic advantage of the chief executive, rather than from pluralism. We have also argued that the latter two derive from their function of silencing the opposition: we consider plebiscites neither as a form of legitimisation through voting nor as an information-gathering exercise, but as a means of disarming the opposition by preventing coordination.
We expect both to begin closing the gap in previous literature on the institutionalization of autocratic regimes – shedding some light on the strategic schemes that a dictator may be seeking when using these tools – and to open up the field for further research. There is still an open question as to why some specific regimes are particularly prone to using plebiscites. Particular dynamics out with the scope of our general model may be taking place in some regimes. For instance, Egypt has used at least 26 plebiscites since Nasser took power, while its neighbour Libya has only used plebiscites once. Another subsequent question to be posed is the effect of plebiscites on the survival options of a dictator. This is of the utmost interest if plebiscites may extend his tenure or make it more stable. They may also be of interest if they affect other variables like economic development, social turmoil or posterior democratization.
Acknowledgements
We would like to thank the useful comments, suggestions and corrections made by Álvaro Delgado, José Luis García Lapresta, Pedro Riera, Julie McGuinness, and the organizers and attendants of 2019 AECPA congress, 2019 JSSV, and 2020 REES meetings, as well as six anonymous reviewers and the editors of this journal.
APPENDIX A
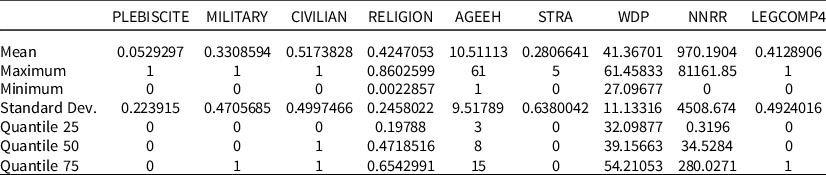
Descriptive statistics for the variables used

Probit panel random-effects model

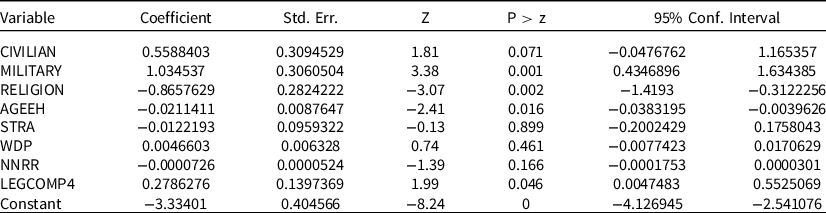
Logit regression model

Note: Logit pooled regression. Variables are the same as the probit regression of Table 1.
Time polynomials for the probit model

Standard errors are in parentheses. Year 2 omitted because of collinearity. ***p < .01, **p < .05, *p < .1.
Polynomials for age of effective leader duration
Standard errors are in parentheses. ***p < .01, **p < .05, *p < .1.
Addressing compulsory referendums

Standard errors are in parentheses. ***p < .01, **p < .05, *p < .1.
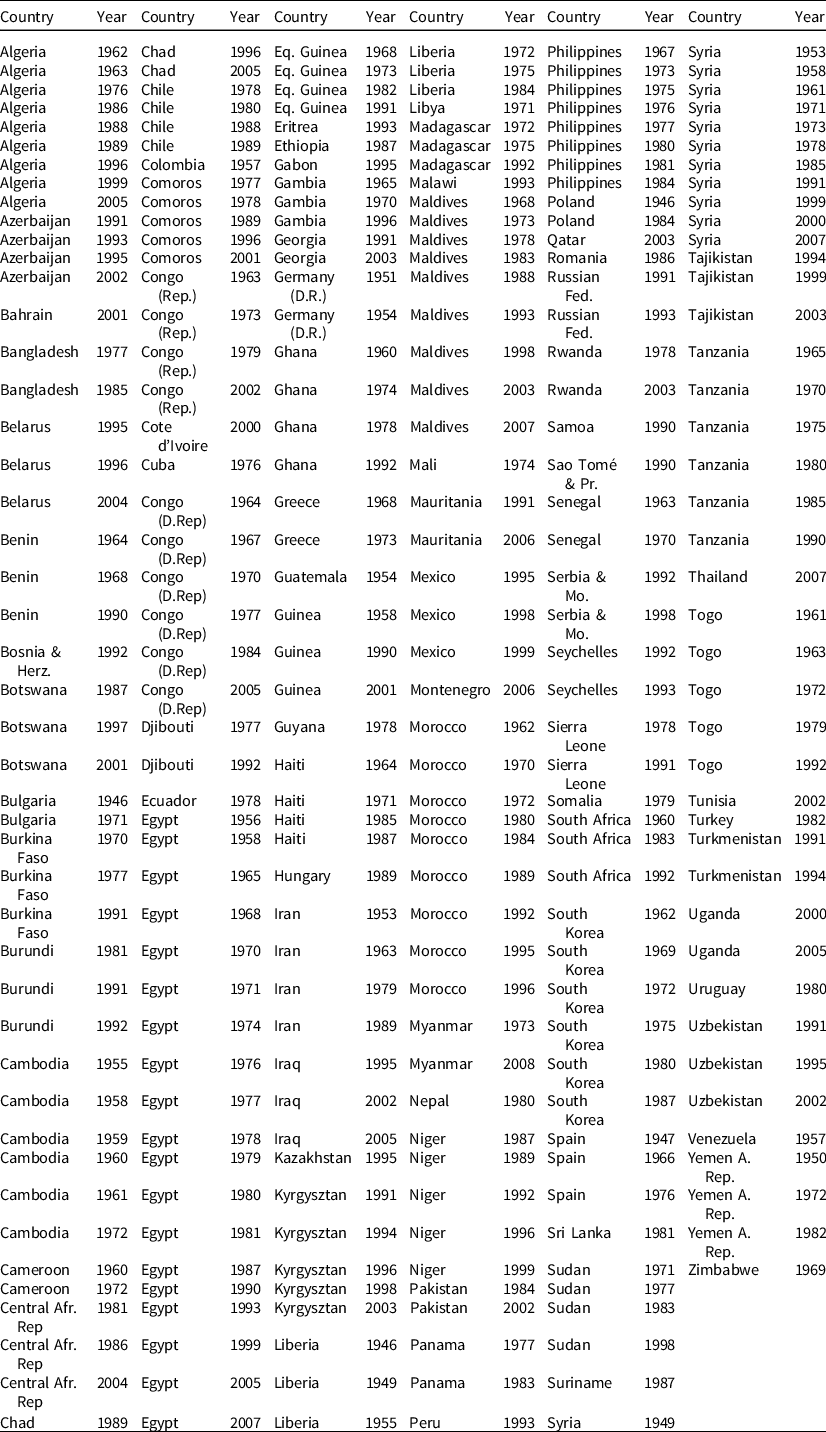
Plebiscites by country and year

Correlation matrix

Clustered errors models

Robust country-clustered standard errors are in parentheses. ***p < .01, **p < .05, *p < .1.
Hausman tests

Test: Ho: difference in coefficients not systematic.
chi2(6) = 6.38.
Prob > chi2 = 0.3818.

Test: Ho: difference in coefficients not systematic.
chi2(6) = 8.29.
Prob > chi2 = 0.2178.