

Introduction
There is a wide natural distribution of Barbodes caldwelli (Spinibarbus) in China, including the Yangtze River, south of Oujiang, the Min River and Qiantang River. The species is commonly found in fast-flowing, clear water, and in many small gravelly rivers. Their individual characteristics include a large body, fast growth, feeding on a variety of nutrients, strong resistance to disease and a delicate taste. In the last decade, a number of studies on B. caldwelli biology, reproductive mechanisms, artificial propagation and cultivation and breeding techniques have been carried out. With the maturation of artificial breeding technology, the species has gradually become important in pond and reservoir cage culture (Lv et al., Reference Lv, Yao and Lao2007, Reference Lv, Huang and Yang2008). However, studies of nutrition and feeding in B. caldwelli are still sparse at home and abroad. The protein component is most significant in the cost of feed (NRC, 1993). Establishing the most appropriate protein content is important in the optimization of feed costs, maintaining good fish growth and improving the utilization of dietary protein. This experiment took B. caldwelli juveniles as the study species, using a protein feeding grade experiment to determine the appropriate level of dietary protein for the growth of B. caldwelli. Technical data regarding the development of B. caldwelli are provided.
Materials and methods
Diet
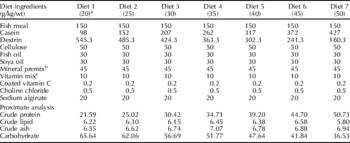
Seven isoenergetic semi-purified test diets containing graded levels of protein ranging from 20 to 50% were formulated using United States L/T level fish meal and CP grade casein as protein sources. Design formulae regarding raw material composition and nutrient composition are presented in Table 1. To produce the test diets, raw materials were crushed until the resulting powder could pass through the apertures in a 0.355-mm sieve. The raw materials were then measured out according to the formulae, mixed evenly, the appropriate amount of water added, then formed into a ~1.2-mm-diameter strip of feed using a meat grinder. They were then broken into particles, after air-drying at room temperature, and stored at 4°C.
Formulation and approximate analysis of the test diets (on dry weight basis)

a Designed dietary protein level.
b Mineral premix (g/kg mix): FeSO4 · 7H2O, 15; CuSO4 · H2O, 0.3; ZnSO4 · 7H2O, 10; MnSO4 · H2O, 0.5; NaCl, 30; MgSO4, 40; Ca(H2PO4)2, 400; KI, 0.05; Na2SeO3, 0.005; CoCl3 · 6H2O, 0.5; zeolite, 503.645.
c Vitamin mix (g/kg premix): vitamin A retinol acetate, 0.80; vitamin D3 cholecalciferol, 0.06; vitamin E α-tocopherol acetate, 4.00; vitamin K3 menadione, 8.00; thiamin, 2.00; riboflavin, 2.00; pantothenic acid, 6.00; pyridoxine, 2.00; folic acid, 0.50; niacin, 15; vitamin B12 cyanocobalamin, 0.02; inositol, 40.00; corn starch, 920.62.
Test fish and grouping
Test B. caldwelli juveniles, as described previously, were obtained from the Jinshuitan Reservoir in Yunhe County, Lishui City, Zhejiang Province, and were measured to have an average weight of 1.26±0.02 g. Before testing, they were domesticated in a cement pool using home-made hardware material particle breakage (crude protein percentage, CP40). After two weeks, they were randomly divided into seven triplicate parallel test groups in 21 water tanks, with 20 fish in each tank.
Rearing method and water quality
Test fish were kept in 300-l flow-type, cylindrical glass-fibre reinforced plastic water tanks containing 200 l water. Chlorine was added to the water to mimic tap water, on volume of 400% water exchange, continuous inflation. The fish were fed every 4 h from 8:00 to 16:00, so that they were almost full at each feeding time. The feeding trial continued for eight weeks. During the rearing period, water temperature was kept constant at 24±2°C, and water quality was maintained at pH 7.1–7.3, dissolved oxygen 4.89–5.73 mg/l, NH3-N 0.11–0.27 mg/l, NO2-N 0.04–0.06 mg/l and NO3-N 0.17–0.28 mg/l.
Nutrient composition
The determination of nutrient composition was performed as follows. Following completion of the test diets, fish that had been deprived of food for 1 d were eviscerated (six each). A moisture analysis was completed by drying at atmospheric pressure and 105°C. A micro-Kjeldahl method was used to determine crude protein content, and anhydrous ethyl ether used as the solvent in the Soxhlet fat extraction method used to determine crude fat content, and crude ash determination was carried out using a box-type resistance furnace burning at 550°C. The above steps were conducted according to AOAC (Reference Cunniff1995) methods.
Detection of digestive enzyme activities
Following the feeding trial, fish that had been deprived of food for 1 d were placed on an ice anatomical site. The hepatopancreas and digestive tract were taken out and the fat and digestive tract contents removed. The hepatopancreases and intestines (five from each test fish tank, a mixed sample), were dried using dry filter paper to absorb the water, then weighed, adding 10 × phosphate buffered saline (PBS) solution (pH 7.4, NaCl 50 μmol/l, Na2HPO4-NaH2PO4 154 μmol/l), and homogenized by hand using a glass homogenizer in an ice bath. This was placed in a 4°C, 10 000 g centrifuge for 10 min; the supernatant obtained comprised a crude enzyme solution, which was then placed in a 4°C refrigerator ready for use (within no more than 12 h). Protease activity was determined using Folin's reagent. Amylase determination was performed using the Bernfeld (Reference Bernfeld1955) method. The protein concentration in the crude enzyme solution was determined using the Bradford (Reference Bradford1976) method with bovine serum albumin as the base material.
The method of calculating indicators
Weighing and counting the test fish were used to statistically evaluate the total amount of feed. Survival rate, body weight gain, specific growth rate, feed efficiency and protein efficiency were calculated as follows:







Mathematical statistics
Experimental data were expressed as mean±standard error (mean±se). SPSS ver. 11.5 software was used for one-way analysis of variance and to test the average indicators for the existence of significant differences or not between the experimental groups. Any significant differences (P<0.05) were analysed with the Student's Newman–Kuels (SNK) multiple comparison analysis. Using the relationship between body weight gain and protein level in synthesizing the broken-line regression model, we determined the optimum level of dietary protein.
Results
Conditions for growth of fish
The fish growth conditions used are set out in Table 2. The initial body weights of the test fish showed no significant differences between the three groups (P>0.05). However, after feeding for eight weeks, the final weights among the test groups presented with a significant difference (P<0.05). The survival rate in each group was ~93.33−100%, with no significant intergroup differences (P>0.05). The weight gain and specific growth rate of the fish were increased with dietary protein levels increasing from 20 to 35%, but were not affected significantly (P>0.05) as dietary protein levels increased to between 35 and 60%. Feed efficiencies were not significantly different when fish were fed diets with protein levels from 30 to 50%, but were significantly higher than those of the other two treatments (fish fed diets with protein levels of 20 and 25%; P<0.05). The protein efficiency ratio (PER) was negatively correlated with diet protein level (x) (PER=3.006−0.03251x, R=0.9366, P<0.001). The relative weight of viscera and relative weight of liver were not significantly different among tests in different experimental groups (P>0.05).
Growth performance of B. caldwelli juvenile fed test diets with various protein levels

Diet compositions are shown in Table 1. There is a significant difference between treatments with different superscripts in any one column (P<0.05).
Suitable protein level
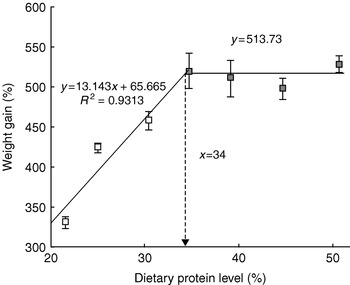
In accordance with the growth response to the feeding trial, body weight gain as an index (y) and feed protein level (x) were fitted using the broken-line model and a regression analysis map constructed (Fig. 1), which estimated the appropriate level of dietary protein to be 34% of the dry feed.
Regression analysis of weight gain response to dietary protein.

Effect of feed protein levels on carcass composition
The fish carcass nutritional composition test results are presented in Table 3. There was no significant effect of dietary protein levels on carcass moisture, crude protein and ash in the juveniles. However, carcass lipid (L) decreased with an increase in dietary protein level (x), showing a negative correlation L=8.2169−0.0458x (R=0.8551).
Effect of dietary protein levels on the carcass composition of B. caldwelli

Diet compositions are shown in Table 1. There is a significant difference between treatments with different superscripts in any one row (P<0.05).
Effect of dietary protein levels on digestive enzyme activities
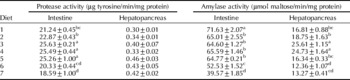
The test results for digestive enzyme activities are presented in Table 4. Intestinal protease, amylase and pancreatic amylase activity in the groups were significantly different (P<0.05), but the protease activity of the hepatopancreas in the group showed no significant difference (P>0.05). Intestine protease activity and hepatopancreas amylase activity were increased to some extent, and then decreased with continued increasing dietary protein levels or decreasing carbohydrate diet levels. IAA in the juvenile was negatively correlated with dietary protein level x (IAA=84.625−0.9147x, R=0.8463, P<0.001).
Effect of dietary protein levels on digestive enzyme activities

Diet compositions are shown in Table 1. There is a significant difference between treatments with different superscripts in any one row (P<0.05).
Discussion
This study used a dose–response design, the results showing that weight gain increased with an increase in dietary protein levels, but was not affected as significantly as when dietary protein levels increased beyond a certain level. With protein on demand, the results for other fish came out with a similar dose–response growth: Oreochromis nilotica×Oreochromis aureus, Channa striata, Maccullochella peelii, Taiwan Zacco barbata, Bidyanus Bidyanus, Spinibarbus hollandi caldwelli (Shiau and Huang, Reference Shiau and Huang1989; Mohanty and Samantaray, Reference Mohanty and Samantaray1996; Gunasekera et al., Reference Gunasekera, De Silva and Collins2000; Yang et al., Reference Yang, Lin and Liou2003). Body weight gain was used as the indicator in this test. It was estimated that the suitable protein level for the B. caldwelli juvenile is 34% when using the broken-line model to regress the relationship of weight gain of the juvenile and dietary protein levels. When compared to the protein demand (31%) of S. hollandi caldwelli (Yang et al., Reference Yang, Lin and Liou2003), the results of this study are slightly higher, and may be due to the relatively small size specifications of the fish species that were used in this study. The test results are close to the demand for protein of other omnivorous freshwater fish such as Cyprinus carpio (31–38%), Ictaluras puntatus (32–36%), Oreochromis niloticus (30–36%) and Labeo rohita (35%) (Siddiqui et al., Reference Siddiqui, Howlader and Adam1988; Satpathy et al., Reference Satpathy, Mukherjee and Ray2003) at the same developmental stage, but are lower than carnivorous fish species' demand for protein (40–55%) (NRC, 1993).
In this experiment, when dietary protein levels were 20 and 25%, the feed efficiency was significantly lower than that of other higher protein level test groups (as in the S. hollandi caldwelli results). The protein efficiency of B. caldwelli juveniles decreased linearly with an increase in feed protein levels, these results being similar to those of Ctenopharyngodon idella, Oreochromis mossambicus, Mystus nemurus, Carassius auratus, Barbodes altus and M. peelii (Lochmann and Phillips, Reference Lochmann and Phillips1994; Elangovan and Shim, Reference Elangovan and Shim1997; Gunasekera et al., Reference Gunasekera, De Silva and Collins2000). This is because, when the fish feed at higher levels of protein, the extra protein is used in energy expenditure (Kim et al., Reference Kim, Kayes and Amundson1991). When isonitrogenous feed is used, a lower protein level of feed is provided, and the form of digestible non-protein is higher and can reduce nitrogen loss and improve feed nitrogen accumulation in vivo (Cho and Kaushik, Reference Cho, Kaushik, Cowey, Mackie and Bell1985).
The fat content of B. caldwelli continuously decreased with increasing dietary protein levels, consistent with the results of similar studies. The reason for this phenomenon is that when the fat content provided in animal feed is kept constant, the carbohydrate intake cause an increase in the capacity for fat synthesis, and the results of this fat synthesis will be stored in the liver, intra-abdominal adipose tissue, the carcass and other parts (Lin et al., Reference Lin, Mao and Cai1980). Research on B. bidyanus, S. hollandi caldwelli and Clarias batrachus×Clarias gariepinus (Shyong et al., Reference Shyong, Huang and Chen1998; Giri et al., Reference Giri, Sahoo and Sahu2003; Yang et al., Reference Yang, Lin and Liou2003) has shown that the higher the protein level in the feed, the more significantly does the carcass protein content improve. In this feeding trial, B. caldwelli were fed higher protein levels of two types of feed (feed 6 and feed 7), and the carcass protein content increased, but when compared with the experimental groups there were no significant differences. In studies on the demand for protein in many fish such as B. bidyanus, tilapia and C. batrachus×C. gariepipinus, with fish meal always used as the source of feed, the carcass ash content positively correlated with fish meal content (Shiau and Huang, Reference Shiau and Huang1989; Giri et al., Reference Giri, Sahoo and Sahu2003; Yang et al., Reference Yang, Lin and Liou2003). In this study, feed ash content was essentially the same, fish carcass ash content for each group demonstrating no significant difference.
The intestine and hepatopancreas digestive enzyme activity changes in response to dietary protein levels were not consistent, indicating that digestive enzyme activities from different organs are not synchronized with changes in dietary protein. On the one hand, this may be due to the type and characteristics of protease produced in the intestine and hepatopancreas not being the same. On the other hand, digestive enzymes have complex control mechanisms, and the generation of the digestive enzyme in different organs may differ in the impact of changes in the role of feedback mechanisms and the levels of dietary protein. Sinocyclocheilus intestinal protease activity and amylase activity in the hepatopancreas gradually increased to their highest levels when feed protein levels increased, these higher levels of dietary protein, rather than a decrease, suggesting an adaptive effect of intestinal protease activity and hepatopancreas amylase of B. caldwelli in response to changes in dietary protein levels. This is similar to observations in carp, C. batrachus, grass carp and Chanos chanos (Das and Tripathi, Reference Das and Tripathi1991; Jana et al., Reference Jana, Garg and Barman2006), where the levels of feed protein and carbon compounds affected digestive enzyme activity in association with mRNA levels for encoding digestive enzymes. Regarding dietary protein levels and their impact on intestinal amylase activity, the conclusions in different studies are not consistent. The intestinal amylase activity of grass carp and Chanos chanos was negatively correlated with feed protein levels; in the Kamloops trout, however, intestinal amylase activity was positively correlated with feed protein levels. The present study has found that the intestinal amylase activity of B. caldwelli is negatively correlated with feed protein levels, supporting the former point of view.
Acknowledgements
This work was supported by the Science and Technology Department of Zhejiang Province Project (2004C32041) and the Lishui City, Zhejiang Province Technology Bureau Projects (20063-7).