I. INTRODUCTION
Raman spectroscopy is a powerful tool to acquire the chemical information of molecules. However, it is a kind of weak spectroscopy, and representative data of the scattering section are below 10−30 cm2, which greatly limits its application in physics, chemistry, material, medicine, biology, and other fields. Since Fleischmann et al.Reference Fleischmann, Hendra and McQuillan1 first reported that the Raman scattering from a material can be significantly increased when the material was attached on a metal nanostructure surface, the so-called surface enhanced Raman scattering (SERS), some researchers have focused on studying SERS including its enhancement mechanism and potential applications. The key to a wider and practical application of SERS is the fabrication of a SERS-active substrate that should be strong in Raman signal enhancement, reproducible, uniformly rough, easy to fabricate, and stable over a long time. Most of the conventional SERS substrates were obtained from pure noble gold (Au) or silver (Ag) nanostructures with various morphologies, such as nanoparticles (NPs), nanocubes, nanorods, and nanowires (NWs).Reference Li, Wu, Wang, Wu, Peng and Pan2–Reference Wang, Hu and Dong6 In recent years, semiconductor SERS-active substrates have been investigated. For example, Cao et al.Reference Cao, Nabet and Spanier7 have reported a strong enhancement of the spontaneous Raman scattering from individual Si NWs and nanocones. Yang et al.Reference Yang, Jiang, Ruan, Zhao, Xu and Lombardi8 have observed SERS from molecules adsorbed on TiO2, and they attributed this to the dominant contribution of TiO2-to-molecule charge-transfer mechanism. In addition, the modification of semiconductor with noble metal has also been attracting significant attention in SERS application, which would exhibit some advantages over the pure noble metal and semiconductor nanostructures. As far as we know, many different kinds of noble metal–semiconductor hybrid nanostructures have been fabricated, such as Ag NPs–Si NWs hybrid,Reference Prokes, Glembocki, Livenere, Tumkur, Kitur, Zhu, Wells, Podolskiy and Noginov9–Reference Wu, Liu, Li and Pan11 Ag NPs–Ge NWs hybrid,Reference Peng, Gao, Zhang, Li, Sun and Lee12 Ag–TiO2 hybrid,Reference Yang, Jiang, Ruan, Yang, Zhao, Xu and Lombardi13–Reference Es-Souni, Es-Souni, Habouti, Pfeiffer, Lahmar, Dietze and Solterbeck16 Ag (Au)–ZnO hybrid,Reference Chen, Luo, Chen, Zhang, Zapien, Lee and Lee17–Reference Georgekutty, Seery and Pillai20 and so on.
Among the above semiconductor materials, ZnO is one of the most important n-type semiconductors with a direct wide band gap of 3.37 eV and a large excitation binding energy of 60 meV.Reference Ozgur, Alivov, Liu, Teke, Reshchikov, Dogan, Avrutin, Cho and Morkoc21 ZnO exhibits excellent piezoelectricity,Reference Emanetoglu, Gorla, Liu, Liang and Lu22–Reference Xiang, Yang, Hou and Zhu26 transparent conductivity,Reference Suzuki, Matsushita, Wada, Sakamoto and Okuda27–Reference Dehuff, Kettenring, Hong, Chiang, Wager, Hoffman, Park and Keszler30 gas sensing,Reference Mitra, Chatterjee and Maiti31–Reference Wang, Sun, Yang, Huang, Lee, Tan and Vayssieres33 and field-emissionReference Lee, Lee, Lyu, Zhang, Ruh and Lee34–Reference Premkumar, Zhou, Lu and Baskar37 properties, which can be used in piezoelectric transducers, optical coating, gas sensors, varistors, photocatalysis, and display devices, etc. In addition to these, ZnO nanostructures with different dimensions can be easily prepared in large scales and at relatively low cost, which are considered to be capable as SERS substrates or templates for practical application. Zhao et al. have demonstrated that ZnO nanocrystals can give rise to surface-enhanced Raman signal with an enhancement factor (EF) of 103, and they considered that the chemical enhancement is most likely responsible for the observed enhancement. Song et al.Reference Song, Wang, Hu and Zhao18 have prepared Ag–ZnO composite microspheres by the reduction of Ag(NH3)2+ with the reducing agent formaldehyde in aqueous solution, whose Raman EF was about 9 × 10⁴. Yin et al.Reference Yin, Zang, Yue, Wu, Wu, Li and Wu38 have fabricated two-dimensional (2D) Ag NP/ZnO hollow nanosphere arrays in a large scale using self-assembled polystyrene (PS) monolayer nanospheres as a template, which proved to be an effective SERS substrate for Raman signal detection. Moreover, three-dimensional (3D) Ag (Au)–ZnO NW or nanorod hybrid arrays have also been reported by some research groups, most of which can produce much large SERS enhancement than that of the typical 2D SERS substrates due to the enhanced light-scattering local field and the interwire plasmon-enhanced electronic field (E-field).Reference Chen, Luo, Chen, Zhang, Zapien, Lee and Lee17,Reference Deng, Fan, Zhang, Loh, Cheng, Sow and Foo39,Reference Tang, Meng, Huang, Zhang, Huang and Zhu40 ZnO hexagonal nanoplates are another kind of interesting material which can be obtained easily and exhibit unique optical property and enhanced photocatalysis activity.Reference Liu, Xu, Wei, Lv, Gao and Zhang41,Reference Xu, Yuan, Du, Halasa and Su42 However, as far as we know, its potential as a substrate or template for Raman enhancement has not been investigated up to now.
In this work, we have fabricated Ag-decorated ZnO nanoplate arrays by combining water-bath heating toward ZnO hexagonal nanoplate arrays, and subsequent decoration of Ag film or NPs on the ZnO surface by magnetron sputtering or photoreduction. The effects of Ag sputtering time on the morphology and the SERS activity of the as-prepared Ag–ZnO hybrid substrate have been investigated based on the experimental and finite-different time-domain (FDTD) numerical simulation. It is found that the measured Raman enhancement in Ag-film–ZnO hybrid nanoplate arrays is in good agreement with the simulation results. In addition, the SERS mapping images exhibit a good uniform Raman enhanced results for our prepared Ag–ZnO hexagonal nanoplate arrays, which can be used as an excellent and homogeneous SERS substrate or sensor in the rapid measurement of trace materials.
II. EXPERIMENTAL
A. Fabrication of ZnO nanoplate arrays
The ZnO nanoplate arrays were prepared by the following two steps:
1. Fabrication of ZnO seeding layer
The n-type (001) Si substrates were first washed sequentially with acetone/ethanol/deionized water in an ultrasonic bath. Then, the ZnO seeding layer was deposited onto the Si substrates by the magnetron sputtering method. When the pressure in the chamber was decreased to 1.8 × 10⁻³ Pa, O2 and Ar gases with flow rates of 15 and 5 sccm were brought into the chamber, and the working pressure was adjusted to 0.4 Pa. The sputtering power for Zn target was 80 W. The sputtering time was controlled to be 20 min.
2. Synthesis of ZnO nanoplate arrays
First, 100 mL of aqueous triethanolamine (0.1 M) was mixed with 100 mL of aqueous zinc acetate (0.1 M) and stirred for 5 min. Then, ZnO seeding layer-coated Si substrates were put into the above mixed solution. Next, the solution was stirred constantly at 70 °C in a water bath for 2 h. After the reaction, the resulting substrates were taken out from the water bath and washed with aqueous water, and finally, the samples were blow-dried by nitrogen gas.
B. Preparation of the SERS substrate
The combination of Ag nanostructures and ZnO nanoplate arrays was realized by the following two methods:
1. Magnetron sputtering method
Herein, Ag films were deposited onto ZnO hexagonal nanoplate substrates by magnetron sputtering method in an ultrahigh vacuum system (JGPG-450, Zky, Shenyang, China). When the pressure in the chamber was decreased to 10−4 Pa, Ar gas with a flow rate of 30 sccm was introduced into the chamber, and the working pressure was adjusted to 0.4 Pa. The sputtering power for Ag target was 30 W. The sputtering time was ranging from 2 to 10 min.
2. Photoreduction method
The ZnO hexagonal nanoplate substrates were immersed in an aqueous solution containing 500 mg/L AgNO3 and were irradiated with an ultraviolet lamp (wave length: 254 nm, power: 6 W) for 5 min to photocatalytically deposit Ag NPs, where the distance between the substrate and the ultraviolet lamp was approximately 5 cm. After irradiation, the substrates were removed from AgNO3 solution, blow-dried by nitrogen gas, and stored in the dark room.
C. SERS measurement
In SERS measurement, Rhodamine 6G (R6G) solution with a concentration of 10−7 M was selected as the probe molecule, which was prepared via successive dilution by factors of 10. The above two kinds of SERS substrates were soaked in the R6G solution for 2 h. After soaking, the sample with R6G molecules was washed with deionized water to remove the free molecules and dried in air. All Raman spectra were measured under the same conditions as follows: a 632.8-nm He–Ne laser with a power of 3.28 mW was used as the exciting light; a 50x objective was used to focus the laser beam onto the sample surface and to collect the Raman signal; the size of the laser spot was about 2 μm; the spectra were recorded with an accumulation time of 10 s.
D. Characterization
The products were analyzed by a scanning electron microscope (SEM, Nova NanoSEM 450, FEI), an atomic force microscope (AFM; Agilent PicoPlusII, Agilent, Santa Clara, CA), and a Raman spectrometer (Renishaw inVia plus, Renishaw, Gloucetershire, U.K.).
III. RESULTS AND DISCUSSION
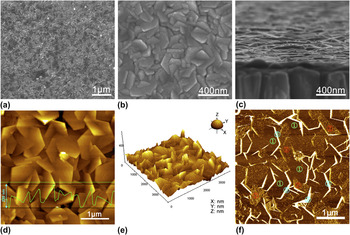
Figures 1(a) and 1(b) show the SEM images of ZnO nanoplates grown by the water-bath heating method on a Si substrate. Obviously, it can be seen that a large amount of interlaced hexagonal ZnO nanoplates uniformly disperse on the Si substrate with an average side length of approximately 350 nm. From the side view of ZnO nanoplates [Fig. 1(c)], the thickness of the nanoplate is measured to be about 30–40 nm. Figures 1(d) and 1(e) show the typical 2D and 3D AFM topographies of as-prepared ZnO nanoplates, respectively. Consistent with the SEM images, regular hexagonal nanoplates protrude from the surface of the Si substrate. In addition, the maximum fluctuating quantity and the root-mean-square roughness of the nanoplate substrate are measured about 220 nm and (158 ± 43) nm from Fig. 1(d) and the inset in the same image, which indicates that this ZnO nanoplate substrate is rough-textured and suitable to serve as a 3D template for SERS. The phase diagram of ZnO nanoplates is shown in Fig. 1(f), where three different regions can be distinguished as indicated by the sequence numbers of 1, 2, and 3. Based on the AFM imaging theory, different phase regions reveal different surface features of both multicomponent compounds and one-component systems with different density distributions.Reference Magonov, Elings and Whangbo43 Thus, the three phase distributions in Fig. 1(f) manifest that the grown hexagonal ZnO nanoplates are composed of three different components or crystal faces. It has been reported that the hexagonal wurtzite ZnO with a polar structure can be described as the hexagonal close packing of O and Zn atoms, which mainly exhibit several crystal planes: a positively charged (0001)-Zn polar face, a negatively charged (000 $\overline {\rm{1}}$)-O polar face, and six symmetric nonpolar (0110) planes parallel to the [0001] direction.Reference Liu, Xu, Wei, Lv, Gao and Zhang41,Reference Wang, Kong and Zuo44 Therefore, it can be inferred from the phase diagram image that regions 1 and 2 correspond to the Zn-terminated (0001) plane and the O-terminated (000
 $\overline {\rm{1}}$) plane, which can be distinguished due to the different surface adsorbed atoms, whereas region 3 points to the (0110) surfaces of ZnO.
SEM images of (a) and (b) top view, (c) side view for ZnO nanoplates grown by the water-bath heating method on a Si substrate. (d) 2D AFM image, (e) 3D AFM image, and (f) the corresponding phase diagram of ZnO nanoplates grown on a Si substrate. The inset in (d) shows the cross-section height along the line drawn in the same image.

A. Ag-film–ZnO hybrid SERS substrate prepared by the magnetron sputtering method
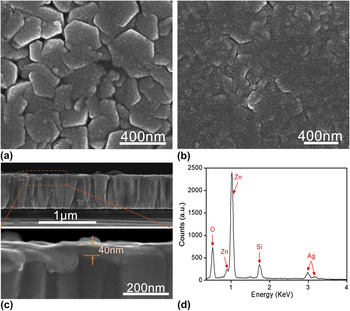
Figure 2 shows the typical SEM images of hexagonal ZnO nanoplate arrays coated with Ag NPs or films prepared by the magnetron sputtering method. The thickness of the Ag film on the ZnO nanoplate surface is controlled by changing the sputtering time. When depositing Ag for 4 min, Ag films composed of continuous Ag NPs are formed, as shown in Fig. 2(a). It is found that the surface of Ag film-coated ZnO nanoplates is very rough, which may be beneficial for SERS enhancement. However, when the sputtering time reaches 10 min, ZnO nanoplates (especially for the grooves formed between adjacent ZnO nanoplates) are almost covered by a thick Ag film, leading to a relatively smooth Ag-film–ZnO surface [Fig. 2(b)]. The thickness of the Ag film formed on ZnO nanoplates with 4-min sputtering is approximately 40 nm measured from the cross-sectional view and the enlarged image in Fig. 2(c). The energy dispersive x-ray (EDX) spectroscopy analysis of the ZnO nanoplate sample with 4-min Ag sputtering reveals that this hybrid is composed of Zn, Ag, and O (Si mainly originated from the n-type Si substrate) [Fig. 2(d)], indicating that Ag-film–ZnO hybrid is successfully formed.
SEM images of ZnO nanoplates coated with Ag films by magnetron sputtering for (a) 4 min and (b) 10 min. (c) Cross-sectional SEM image of ZnO nanoplates coated with Ag films by magnetron sputtering for 4 min. (d) EDX spectrum of ZnO nanoplates coated with Ag films by magnetron sputtering for 4 min.

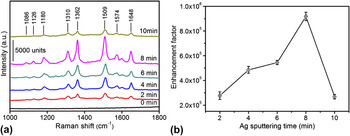
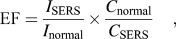
To test the SERS activity of Ag-film–ZnO nanoplate hybrids, R6G with a concentration of 10−7 M was selected as the probe molecule. Figure 3(a) shows the SERS signals of R6G absorbed on Ag-film–ZnO hybrids with different Ag sputtering times. Many Raman peaks originated from R6G are clearly observed, which are similar to those reported by other researchers.Reference Hildebrandt and Stockburger45,Reference Li, Pan, Wu and Li46 It is found that the SERS enhancement is very sensitive to the Ag sputtering time. SERS signals of R6G first increase gradually with increasing Ag sputtering time, and then it reaches a maximum when the Ag sputtering time is 8 min. However, the further increase in the Ag sputtering time results in a rapid decrease in the SERS intensity. To further compare the Raman enhancement on these substrates, the SERS EF has been estimated according to the following formula:
 $${\mathop{\rm EF}\nolimits} = {{{I_{{\rm{SERS}}}}} \over {{I_{{\rm{normal}}}}}} \times {{{C_{{\rm{normal}}}}} \over {{C_{{\rm{SERS}}}}}}\quad {\rm{,}}$$
where I SERS and I normal are SERS intensities of probes detected on the SERS substrate and normal Raman scattering intensity of the probe solution, C SERS and C normal are the analyte solution concentrations that contribute to the SERS and normal Raman spectra, respectively.Reference Le Ru, Blackie, Meyer and Etchegoin47I SERS and I normal are both measured at 1510 cm−1, and the EF as a function of Ag sputtering time is plotted, as shown in Fig. 3(b), which indicates that the highest EF achieved using Ag-film–ZnO hybrid substrate has reached nearly 1 × 10⁶.
(a) SERS spectra of R6G with a concentration of 10−7 M adsorbed on the Ag-film–ZnO hybrid substrate prepared by magnetron sputtering for different time periods. (b) The dependence of SERS EF on Ag sputtering time.

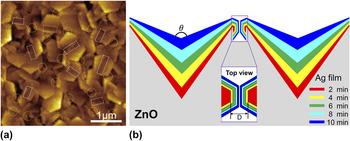
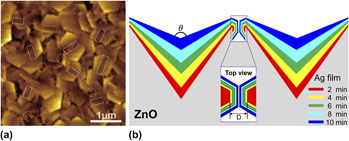
At the same time, a question is raised of why the Ag-film–ZnO nanoplate substrates with different Ag sputtering times exhibit such a large difference in SERS activity. It is known that SERS can be attributed to two mechanisms, the electromagnetic enhancement due to the localized surface plasmon resonance mode and the chemical enhancement that arises from the interaction between molecules and nanostructure. In general, the electromagnetic mechanism contributes to most of the enhancement. For electromagnetic enhancement, SERS largely depends on the detailed physical structures of a metal nanomaterial, including its size, shape, morphology, and composition. In this experimental, different Ag sputtering times would gradually change the surface structure of Ag-film–ZnO nanoplate array from 3D to 2D, as can be clearly observed in Fig. 2, and then affects the production and distribution of “hot spots” for SERS enhancement. Figure 4(a) shows the typical AFM topography image of ZnO nanoplates coated with Ag film by sputtering for 4 min, where the dotted line circles and rectangles point to the gaps formed between adjacent separate Ag-film–ZnO hybrid nanoplates and V-grooves formed between two adjacent interlaced Ag-film–ZnO hybrid nanoplates, respectively. It is considered that the strong optical electric field (E-field) can be produced under the excitation of laser at the gap and V-groove positions, namely, the formed gaps and grooves are two kinds of hot spots for our SERS substrates. Figure 4(b) shows the schematic for the cross section of ZnO nanoplates coated with Ag films for different sputtering times. We believe that with an increase in Ag sputtering time, the size of the gap D between two adjacent nanoplates will become smaller until the two nanoplates turn into a whole [see the inset in Fig. 4(b)]; meanwhile, the angle θ of V-grooves formed by two adjacent interlaced Ag-film–ZnO nanoplates will become larger. To understand the influences of the size of the gap and the angle of the V-groove on the E-field or SERS enhancement, a theoretical simulation is carried out by using the FDTD method in the following section.
(a) The typical AFM image of ZnO nanoplates coated with Ag film by magnetron sputtering for 4 min. (b) Schematic of cross section of ZnO nanoplates coated with Ag films for different sputtering times. The dotted line circles and rectangles in (a) point to the gaps and grooves formed between two adjacent Ag-film–ZnO hybrid nanoplates, respectively. The inset in (b) shows the top view of the gap formed by two adjacent Ag-film–ZnO hybrid nanoplates.

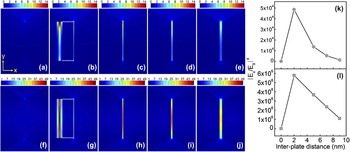
The 2D geometric model of two adjacent separate Ag nanoplates is shown in Figs. S1(a) and S1(b), which is presented by a variable interplate distance D and a fixed regular hexagonal plate structure (side length: 150 nm, thickness: 30 nm). A p-polarized plane wave with a wave length of 632.8 nm is projected on the structure from two directions: the wave vector K is parallel to the nanoplate surface [Fig. S1(a)] and K is vertical to the nanoplate surface [Fig. S1(b)]. Figure 5 illustrates the calculated optical E-field distribution at the gap between two adjacent Ag nanoplates. Figures 5(a)–5(e) show the E-field distribution between two adjacent Ag nanoplates under the excitation of laser with wave K parallel to the nanoplate surface and with interplate distances of 0, 2, 5, 7, and 9 nm, respectively. It is clearly observed that E-field enhancement for the narrow gap is stronger than that for the wide gap. However, when the size of the gap becomes 0 nm, the E-field intensity will be very weak. A similar variance law has been obtained when the plane wave enters perpendicularly the nanoplate surface, as shown in Figs. 5(f)–5(j). The SERS EF can give a more direct indication of the enhancement ability of Ag nanoplates. To more quantitatively investigate the relationship between the size of the gap and the enhancement ability, the dependence of SERS EF on the interplate distance is plotted in Figs. S1(c) and S1(d). Herein, the SERS EF is simply defined as |E/E 0|4 (E 0 is the incident field). Figures 5(k) and 5(l) show the variation of maximum SERS EF on the interplate distance. It is observed that the maximum SERS EF increases and then decreases rapidly with continuous increase in distance, similar to that of changing law for the coupled metal NPsReference Li, Wu, Wang, Wu, Peng and Pan2,Reference Oubre and Nordlander48,Reference Li, Huang, Ding, Yang, Li, Zhou, Fan, Zhang, Zhou, Wu, Ren, Wang and Tian49 and coupled metal nanorods,Reference Li, Pedano, Chang, Mirkin and Schatz50 which indicates that the formation of a narrow gap is crucial for the SERS enhancement. In addition, it is found that the E-field intensity produced at the gap under the excitation of laser with wave K vertical to the nanoplate surface is stronger than that under the excitation of laser with wave K parallel to the nanoplate surface. This may be due to the asymmetric structure of Ag hexagonal nanoplates, which leads to the different plasmon coupling effects.
FDTD simulation of E-field distributions at the gap between two adjacent Ag nanoplates with interplate distances of (a) and (f) 0 nm, (b) and (g) 2 nm, (c) and (h) 5 nm, (d) and (i) 7 nm, (e) and (j) 9 nm. (k) and (l) Dependence of the maximum SERS EF at the gap on the interplate distance. Laser wave length: 632.8 nm. In (a–e) and (k), the plane wave K is parallel to the nanoplate surface; in (f–j) and (l), the plane wave K is vertical to the nanoplate surface. The insets in (b) and (g) show the enlarged images of E-field distributions at the gap.

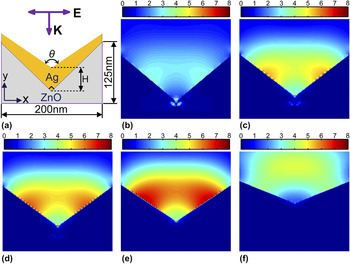
Figure 6(a) shows the 2D geometric model of the V-groove formed by two adjacent Ag-film–ZnO nanoplates, where a 632.8-nm wave length p-polarized plane wave enters perpendicularly above the V-groove. The angle of ZnO groove is 90°, and the ZnO groove surface is coated with an Ag film with variable groove wall angle θ and thickness H. The dependence of the E-field enhancement on the groove wall angle is analyzed by changing the angles from 100 to 135°, as shown in Figs. 6(b)–6(f). Overall, the E-field contribution to SERS shows continual increase with an increase in groove angles from 100 to 115° [Figs. 6(b)–6(e)], while there appears to be a sudden decrease in E-field intensity for a groove angle of 135° [Fig. 6(f)]. The E-field distribution also changes drastically when the groove angle is increased. At small angle [Fig. 6(b)], the E-field is highly localized at the groove bottom, which is possibly due to the strong diffraction effects arising from the effective refractive index changing.Reference Bozhevolnyi51,Reference Vernon, Davis, Scholes, Gomez and Lau52 As the groove angle is increased [Figs. 6(c)–6(e)], the E-field is not only located at the groove bottom, but also on the groove wall, which is possibly due to the smaller effective index.Reference Bozhevolnyi51 In addition, the E-field distribution along the groove wall becomes broader and the corresponding E-field intensity becomes stronger as the angle is increased. The increase in E-field intensity is considered to be due to the increase in Ag film thickness, where sufficient Ag thin film allows the coupling of plasmons to the both sides of the film. In the other words, the E-field enhancement and distribution at the groove is a result of a combination of diffraction and plasmon coupling effects. Since most of the probe molecules usually adhere to both the groove bottom and the groove wall, the optimized groove wall angle and Ag film thickness may provide a stronger SERS enhancement.
(a) A geometric model of the V-groove formed by two adjacent Ag-film–ZnO nanoplates under the excitation of a p-polarized plane wave with a wave length of 632.8 nm. FDTD simulation of E-field distributions at the groove with angles θ and center Ag film thicknesses H of (b) 100°, 10 nm; (c) 105°, 20 nm; (d) 110°, 30 nm; (e) 115°, 40 nm; and (f) 135°, 80 nm.

B. Ag-NPs-ZnO hybrid SERS substrate prepared by the photoreduction method
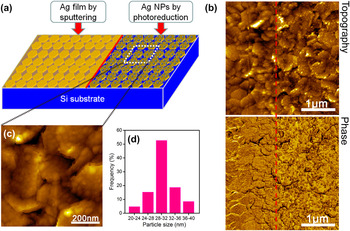
It has been reported that Ag NPs can be generated on some semiconductor film surfaces by photocatalysis reduction, such as TiO2, ZnO, etc.Reference Li, Pan, Li, Liu, Wu and Peng15,Reference Cheng, Yan, Wong, Li, Zhou, Yu, Shen, Yu and Fan19 Prompted by this feature, Ag NPs are grown on hexagonal ZnO nanoplate arrays by photoreduction in an AgNO3 aqueous solution. To simultaneously evaluate the uniformity and reproducibility of the SERS substrates and distinguish the SERS enhancement differences of Ag–ZnO hybrid substrates prepared by sputtering and photoreduction methods, we have fabricated the Ag-film–ZnO hybrid (sputtering) and Ag-NPs-ZnO hybrid (photoreduction) on the same Si substrate, the schematic of which is shown in Fig. 7(a). Figure 7(b) shows the AFM topography (top) and phase diagram (bottom) of ZnO nanoplates coated with Ag films by sputtering (the left part of the red dashed line) and Ag NPs by the photoreduction method (the right part of the dashed line) on the same substrate. The Ag film and Ag NPs formed on the ZnO nanoplates can be clearly distinguished, both of which distribute uniformly on the ZnO array surfaces. Figure 7(c) shows the high-magnification AFM topography image of ZnO nanoplates coated with Ag NPs. It is observed that the Ag NPs attached to the ZnO surface has a narrow dispersion in particle size, typically with an average diameter of 30 nm [Fig. 7(d)].
(a) Schematic of ZnO nanoplate arrays coated with Ag film by magnetron sputtering (left) and Ag NPs by photoreduction (right) method. (b) AFM topography (top) and phase diagram (bottom) of ZnO nanoplates coated with Ag film by magnetron sputtering (the left part of the red dashed line) and Ag NPs by photoreduction method (the right part of the dashed line) on the same Si substrate. (c) High-magnification AFM image of ZnO nanoplates coated with Ag NPs. (d) The size distribution of Ag NPs in (c).

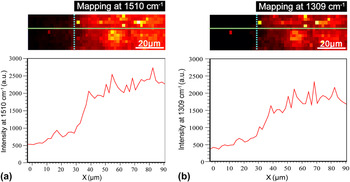
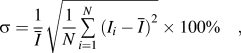
To evaluate the SERS performances of our prepared Ag–ZnO hybrid substrates using two different methods, a Raman mapping of R6G with a concentration of 10−7 M over ZnO nanoplates coated with Ag film and Ag NPs has been made, as shown in Fig. 8. The top views in Fig. 8 illustrate the measured region and the brightness is proportional to the R6G signal at 1510 cm−1 [Fig. 8(a)] and at 1310 cm−1 [Fig. 8(b)]. In addition, the left part of the vertical dashed line corresponds to the Ag-film–ZnO hybrid region, whereas the right part of the vertical dashed line corresponds to the Ag-NPs-ZnO hybrid region. The bottom curves in Figs. 8(a) and 8(b) are the corresponding R6G signal intensity changes along the horizontal green lines in the above two Raman mapping views. Comparing with the Raman signal of R6G measured on the Ag-film–ZnO hybrid, the SERS activity of the Ag-NPs-ZnO hybrid is relatively strong, which may be due to more hot spots formed on the Ag-NPs-ZnO hybrid substrate. The standard deviations σ in SERS enhancement (probed at different locations for a single substrate) for above two kinds of SERS substrates are estimated as follows:
 $${\rm{\sigma }} = {1 \over {\overline I }}\sqrt {{1 \over N}\mathop\sum\limits_{i = 1}^N {{{{\rm{(}}{I_i} - \overline I {\rm{)}}}^2}} } \times 100{\rm{\% }}\quad {\rm{,}}$$
where N are numbers of SERS spectra of R6G (10−7 M), which are measured at different locations on the same substrate; I i is the R6G signal intensity at 1510 cm−1 detected at the ith location; and  $\bar I$ is the average R6G signal intensity. According to the above equation, we get σ ≈ 14.5% for Ag-film–ZnO hybrid substrate and σ ≈ 16.3% for Ag-NPs-ZnO hybrid substrate, which indicates that both SERS substrates have a comparative uniform Raman enhancement. These results demonstrate that the Ag–ZnO nanoplate hybrid array substrate with excellent and homogeneous SERS activity has potential feasibility as sensitive SERS sensors.
SERS mapping (step size 2 μm, 48 × 11 = 528) of R6G with a concentration of 10−7 M on ZnO nanoplates coated with Ag film (the left part of the vertical dashed line) and Ag NPs (the right part of the vertical dashed line). (a) The mapping view corresponding to R6G at 1510 cm−1, (b) the mapping view corresponding to R6G at 1309 cm−1. The top view in (a) and (b) illustrates the measured rectangular region, and the brightness is proportional to the R6G signal intensity, the bottom curves in (a) and (b) are the corresponding R6G signal intensity changes along the horizontal green lines.

IV. CONCLUSIONS
In conclusion, we have demonstrated a kind of simple and economic strategy for the fabrication of SERS-active substrates based on Ag-coated ZnO hexagonal nanoplate arrays. The combination of Ag and ZnO nanoplates is realized by two different methods namely magnetron sputtering and photoreduction. The optimized Ag–ZnO nanoplate hybrid SERS substrates exhibit excellent performance in terms of high sensitivity, good uniformity, and reproducibility. AFM analysis reveals that there are two kinds of hot spots in our Ag-film–ZnO hybrid substrates, which are located at the gaps and the V-grooves formed between adjacent Ag-film–ZnO hybrid nanoplates. The experimentally observed SERS difference due to structural changes is in good agreement with the results of FDTD simulation. Therefore, our prepared Ag–ZnO nanoplate hybrid substrates due to their excellent and homogeneous SERS activity have potential feasibility as sensitive SERS sensors in the rapid measurement of trace materials.
Supplementary Material
To view supplementary material for this article, please visit http://dx.doi.org/jmr.2013.3567
ACKNOWLEDGMENTS
This work was supported by the Fundamental Research Funds for the Central Universities of China (Grant Nos. DUT13LK21 and DUT13ZD107), National Natural Science Foundation of China (Grant Nos. 61137005 and 11274055), National High-tech R&D Program of China (Grant No. 2011AA050516), and Program for New Century Excellent Talents in University (Grant No. NCET-12–0077).