Introduction
Concussions, a form of mild traumatic brain injury (mTBI), occur in approximately 1–2 million children/adolescents yearly in the United States (Bryan et al., Reference Bryan, Rowhani-Rahbar, Comstock and Rivara2016), and are frequently associated with cognitive, somatic, behavioral, and emotional symptoms (Ayr et al., Reference Ayr, Yeates, Taylor and Browne2009). For approximately 1 in 3 children, these post-concussion symptoms (PCS) persist up to 1 month or longer (Barlow et al., Reference Barlow, Crawford, Stevenson, Sandhu, Belanger and Dewey2010; Zemek et al., Reference Zemek, Barrowman, Freedman, Gravel, Gagnon, McGahern and Osmond2016). Persistent PCS have a negative impact on health-related quality of life and wellness (Beauchamp et al., Reference Beauchamp, Tang, Yeates, Anderson, Brooks, Keightley and Zemek2019; Novak et al., Reference Novak, Aglipay, Barrowman, Yeates, Beauchamp, Gravel and Zemek2016). Accurate identification of PCS is essential for appropriate management of concussion.
Current guidelines call for the use of age-appropriate and validated PCS rating scales to assist with diagnosis and monitoring recovery (Lumba-Brown et al., Reference Lumba-Brown, Yeates, Sarmiento, Breiding, Haegerich, Gioia and Timmons2018; Reed et al., Reference Reed, Dawson and Ledoux2019). The Health and Behaviour Inventory (HBI) is a PCS rating scale that is embedded within the child version of the Sport Concussion Assessment Tool (Davis et al., Reference Davis, Purcell, Schneider, Yeates, Gioia, Anderson and Kutcher2017) and recommended in the NINDS Common Data Elements for pediatric TBI and sport-related concussion (Broglio et al., Reference Broglio, Kontos, Levin, Schneider, Wilde, Cantu and Joseph2018; McCauley et al., Reference McCauley, Wilde, Anderson, Bedell, Beers, Campbell and Yeates2012). The HBI, which is intended for use with 8–17 year old children, consists of 20 items separated into two subscales that reflect cognitive and somatic symptoms commonly reported after concussion (Ayr et al., Reference Ayr, Yeates, Taylor and Browne2009). The 20 items were chosen from a larger pool of 50 items based on the results of common factor analyses using target rotation (Browne, Reference Browne2001), which identified cognitive and somatic symptom factors that consistently replicated based on both child and parent ratings and over time. The HBI has acceptable psychometric properties, including good-to-excellent internal consistency and moderate-to-good test–retest reliability (O’Brien et al., Reference O’Brien, Minich, Langevin, Taylor, Bigler, Cohen and Yeates2021), is sensitive to pediatric mild TBI and sport-related concussion (Babl et al., Reference Babl, Dionisio, Davenport, Baylis, Hearps, Bressan and Davis2017; Patsimas et al., Reference Patsimas, Howell, Potter, Provance, Kirkwood and Wilson2020), predicts other outcomes such as quality of life (Moran et al., Reference Moran, Taylor, Rusin, Bangert, Dietrich, Nuss and Yeates2012; Yeates et al., Reference Yeates, Kaizar, Rusin, Bangert, Dietrich, Nuss and Taylor2012), and is sensitive to treatment of concussion (Hilt et al., Reference Hilt, McCarty, Rivara, Wang, Marcynyszyn, Chrisman and Zatzick2022; McCarty et al., Reference McCarty, Zatzick, Marcynyszyn, Wang, Hilt, Jinguji and Rivara2021).
Another approach to validating symptom rating scales such as the HBI is to examine their factor structure and invariance. Factor analyses (exploratory or confirmatory) are commonly used to identify and validate the dimensions of PCS rating scales because they offer empirical evidence for the validity of symptom interpretation and guide the development of subscales (Karr & Iverson, Reference Karr and Iverson2020). Identifying the dimensions of concussion symptoms also can offer insights into an individually tailored approach to treatment (Brett et al., Reference Brett, Kramer, McCrea, Broglio, McAllister, Nelson and Susmarski2020). To date, factor analyses of PCS rating scales have yielded somewhat inconsistent results, although factors involving cognitive, somatic, emotional, and sleep symptoms are typically reported (Brett et al., Reference Brett, Kramer, McCrea, Broglio, McAllister, Nelson and Susmarski2020; Nelson et al., Reference Nelson, Kramer, Patrick and McCrea2018). No universally consistent dimensions have been identified, as past studies have found PCS ratings to be both unidimensional and multidimensional (Joyce et al., Reference Joyce, Labella, Carl, Lai and Zelko2015; Merritt & Arnett, Reference Merritt and Arnett2014; Piland et al., Reference Piland, Motl, Ferrara and Peterson2003; Sady, Vaughan, & Giogial, Reference Sady, Vaughan and Gioia2014; Waljas et al., Reference Waljas, Iverson, Hartikainen, Liimatainen, Dastidar, Soimakallio and Ohman2012). In both clinical and research contexts, total scores are often used in place of more discrete subscales. The bifactor model has become an innovative approach to reconciling these inconsistencies, as it allows for both a dominant general factor and multi-faceted subfactors. In a bifactor model, a broad comprehensive factor directly accounts for each item on the symptom rating scale, and the residual item variance is accounted for by additional subfactors (Nelson et al., Reference Nelson, Kramer, Patrick and McCrea2018).
To validate factor models, measurement invariance (MI) can be assessed to test the applicability of the factor model across time, raters, or groups, by imposing stringent assumptions on the equality of model parameters. Tests of these assumptions can offer insights into the nature of underlying constructs and their measurement (Agtarap et al., Reference Agtarap, Kramer, Campbell-Sills, Yuh, Mukherjee, Manley and Nelson2020; Brett et al., Reference Brett, Kramer, McCrea, Broglio, McAllister, Nelson and Susmarski2020); importantly, confirmation of MI ensures that researchers and clinicians can be confident that scores on PCS rating scales are comparable across time, raters, and different injury types. The four levels of MI are: (1) configural, which requires equivalence of factor model structure (i.e., items load onto the same factors); (2) weak, which requires equivalence of factor loadings; (3) strong, which requires equivalence of item thresholds or intercepts; and (4) strict, which requires equivalence of item residuals or unique variances (Putnick & Bornstein, Reference Putnick and Bornstein2016).
The factor structure of the HBI has not been validated since its original derivation (Ayr et al., Reference Ayr, Yeates, Taylor and Browne2009) and no research has investigated its MI. Therefore, this study had three main goals: (1) to validate the two dimensions of the HBI identified in previous research using both exploratory and confirmatory approaches, (2) to test whether a bifactor model with a general factor and cognitive and somatic subfactors achieves better fit than the correlated two-factor model, and (3) to evaluate MI for all factor models across time (10-days, 3-months, and 6-months post-injury), raters (child vs. parent), and groups (concussion vs. orthopedic injury [OI]). Analyses used data collected from a prospective multicenter, longitudinal cohort study of children aged 8–16.99 years who presented to emergency departments (EDs) at five pediatric hospitals across Canada with either concussion or OI (Yeates et al., Reference Yeates, Beauchamp, Craig, Doan, Zemek, Bjornson and Schneider2017). We predicted that analyses would confirm the two-dimensional model of the HBI, but anticipated that a bifactor model might provide a better overall fit than a correlated two-factor model. We also expected to find at least weak MI across all comparisons (time, rater, group) for both bifactor and correlated two-factor models.
Methods
Participants
The study included 967 children and adolescents aged 8 to 16.99 with mTBI or OI. They were recruited for the Advancing Concussion Assessment in Pediatrics (A-CAP) study (Yeates et al., Reference Yeates, Beauchamp, Craig, Doan, Zemek, Bjornson and Schneider2017), conducted at five sites from the Pediatric Emergency Research Canada network (Bialy et al., Reference Bialy, Plint, Zemek, Johnson, Klassen and Osmond2018): Alberta Children’s Hospital (Calgary, Alberta), Children’s Hospital of Eastern Ontario (Ottawa, Ontario), Sainte-Justine Hospital (Montreal, Quebec), Stollery Children’s Hospital (Edmonton, Alberta), and British Columbia Children’s Hospital (Vancouver, British Columbia).
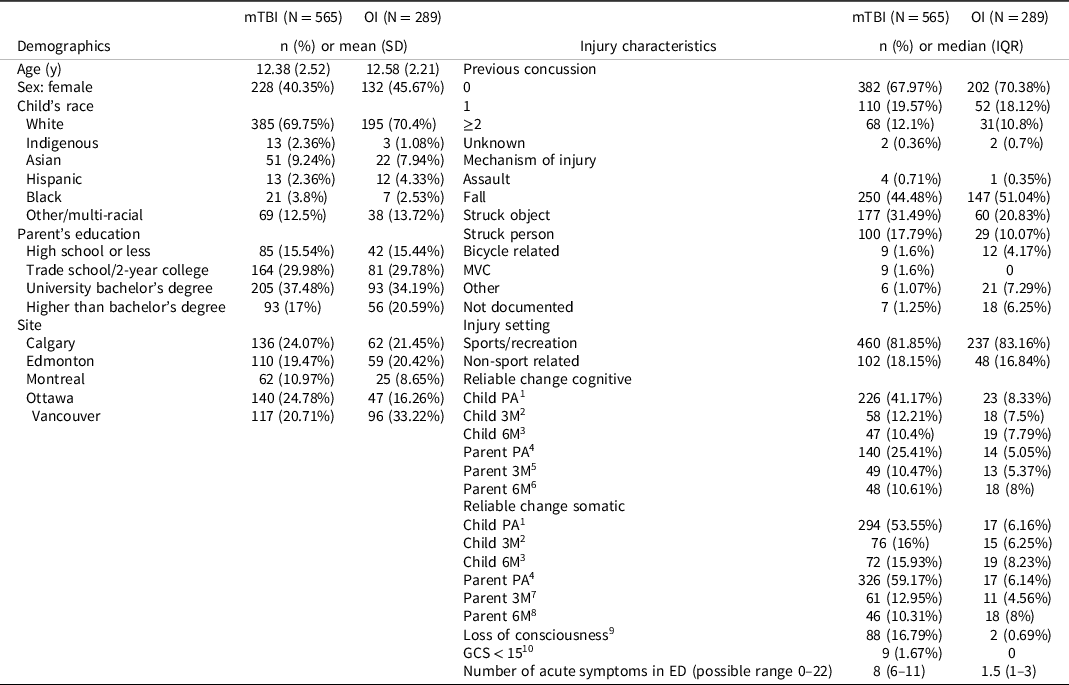
Children were eligible for the concussion group if they presented to the ED within 48 h of sustaining a blunt head trauma and met at least one of the three following criteria, consistent with the WHO definition of mTBI (Carroll et al., Reference Carroll, Cassidy, Holm, Kraus and Coronado2004): (1) an observed loss of consciousness (LOC), (2) a Glasgow Coma Scale (GCS) score of 13 or 14, or (3) at least one acute sign or symptom of concussion such as post-traumatic amnesia, focal neurological deficits, skull fracture, post-traumatic seizure, vomiting, headache, dizziness, and other mental status changes. Children were eligible for the OI group if they sustained upper or lower extremity fractures, sprains, or strains due to blunt force/physical trauma, associated with a score of 4 or less on the Abbreviated Injury Scale (Medicine, 1990), within 48 h of presentation to the ED. Exclusion criteria for the concussion group were delayed neurological deterioration as indicated by a GCS score less than 13, LOC > 30 min, or post-traumatic amnesia > 24 h. OI group exclusion criteria included any head trauma or symptoms of concussion reported during screening for recruitment, as well as any injury requiring surgical intervention or procedural sedation. For both groups, additional exclusion criteria were hypoxia, hypotension, or shock during or following the injury; non-English-speaking child or parents (non-English and non-French-speaking in Quebec or Ottawa); previous TBI requiring overnight hospitalization; previous concussion within the past 3 months; previous severe neurological or neurodevelopmental disorder such as epilepsy, intellectual disability, or autism (history of attention deficit hyperactivity disorder, learning disability, or Tourette’s syndrome was not an exclusion); hospitalization in the previous year for psychiatric disorder; administration of sedative medication prior to ED data collection (fentanyl was not an exclusion if used for pain management only); obvious alcohol or drug ingestion associated with injury; injury related to abuse or assault; and legal guardian not present or child in foster care. Table 1 shows demographic and injury characteristics of the sample.
Sample demographic and injury characteristics

mTBI = mild traumatic brain injury; OI = orthopedic injury; SD = standard deviation; PA = post-acute; 3M = 3 month; 6M = 6 month. ED = emergency department.
1 mTBI = 549, OI = 276.
2 mTBI = 475, OI = 240.
3 mTBI = 452, OI = 231.
4 mTBI = 551, OI = 277.
5 mTBI = 468, OI = 242.
6 mTBI = 443, OI = 225.
7 mTBI = 471, OI = 241.
8 mTBI = 446, OI = 225.
9 mTBI = 524, OI = 288.
10 mTBI = 538.
Measures
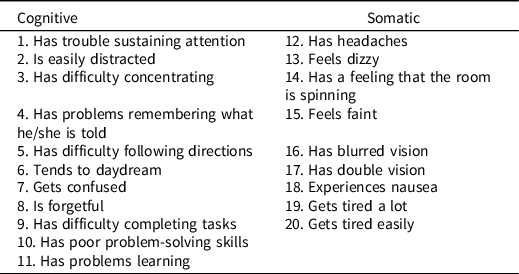
The HBI consists of 20 items (Table 2), with each item rated on a 4-point scale (0 = Never, 1 = Rarely, 2 = Sometimes, 3 = Often). The items form two subscales, with the first 11 constituting the cognitive scale and the remaining 9 constituting the somatic scale (Ayr et al., Reference Ayr, Yeates, Taylor and Browne2009). The wording of child and parent proxy forms differ slightly to reflect first- versus third-person perspective, but the items are otherwise equivalent.
Health and behavior inventory subscale items

Procedures
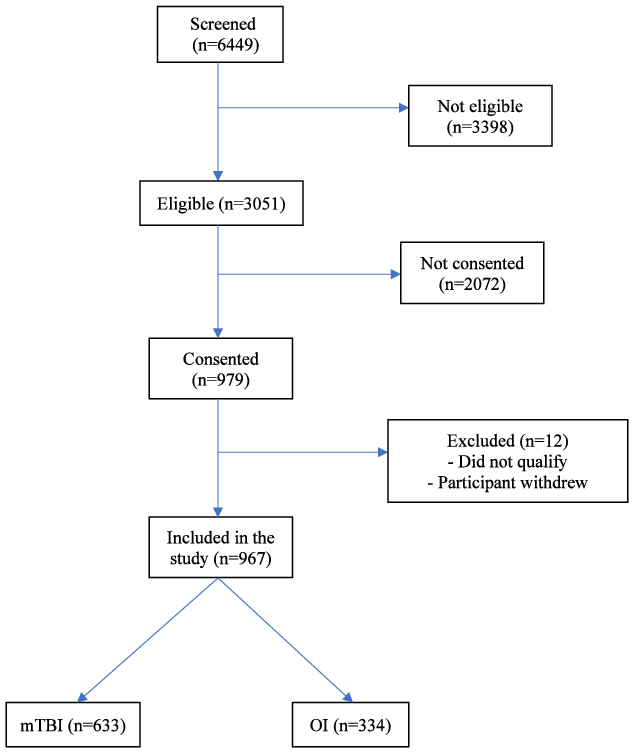
The study was approved by the research ethics boards of all participating institutions. Parents and capable adolescents provided written informed consent, and all other children provided written assent. Designated staff screened for all eligible participants who presented to the EDs. Recruitment took place from September 2016 to December 2018. Figure 1 shows a total of 3051 participants were eligible, and 967 (32%) consented (644 with concussion and 334 with OI).
Participant enrollment. mTBI = mild traumatic brain injury, OI = orthopedic injury.

HBI ratings were directly entered into REDCap databases by both the parent and the child during three face-to-face follow-up visits post-injury. A post-acute assessment was completed within three weeks of the injury (M = 8.39 days, SD = 3.13) by 828 (86%) parents and 829 (86%) children. Ratings were completed by 722 (75%) parents and 728 (75%) children at 3-months post-injury (M = 96.21 days, SD = 9.74) and by 685 (71%) parents and 701 (72%) children at 6-months post-injury (M = 186.06 days, SD = 11.49). Of the parent ratings, 75% were completed by the mother, 21% by the father, and the remaining 4% by adoptive, step, and grandparents. Item-level missingness was less than 5% for the parent’s rating at the 3- and 6-month assessments, with no missingness at the first follow-up post-injury visit. No item-level missingness was detected in children’s ratings at any time point.
Statistical analysis
Factor analyses
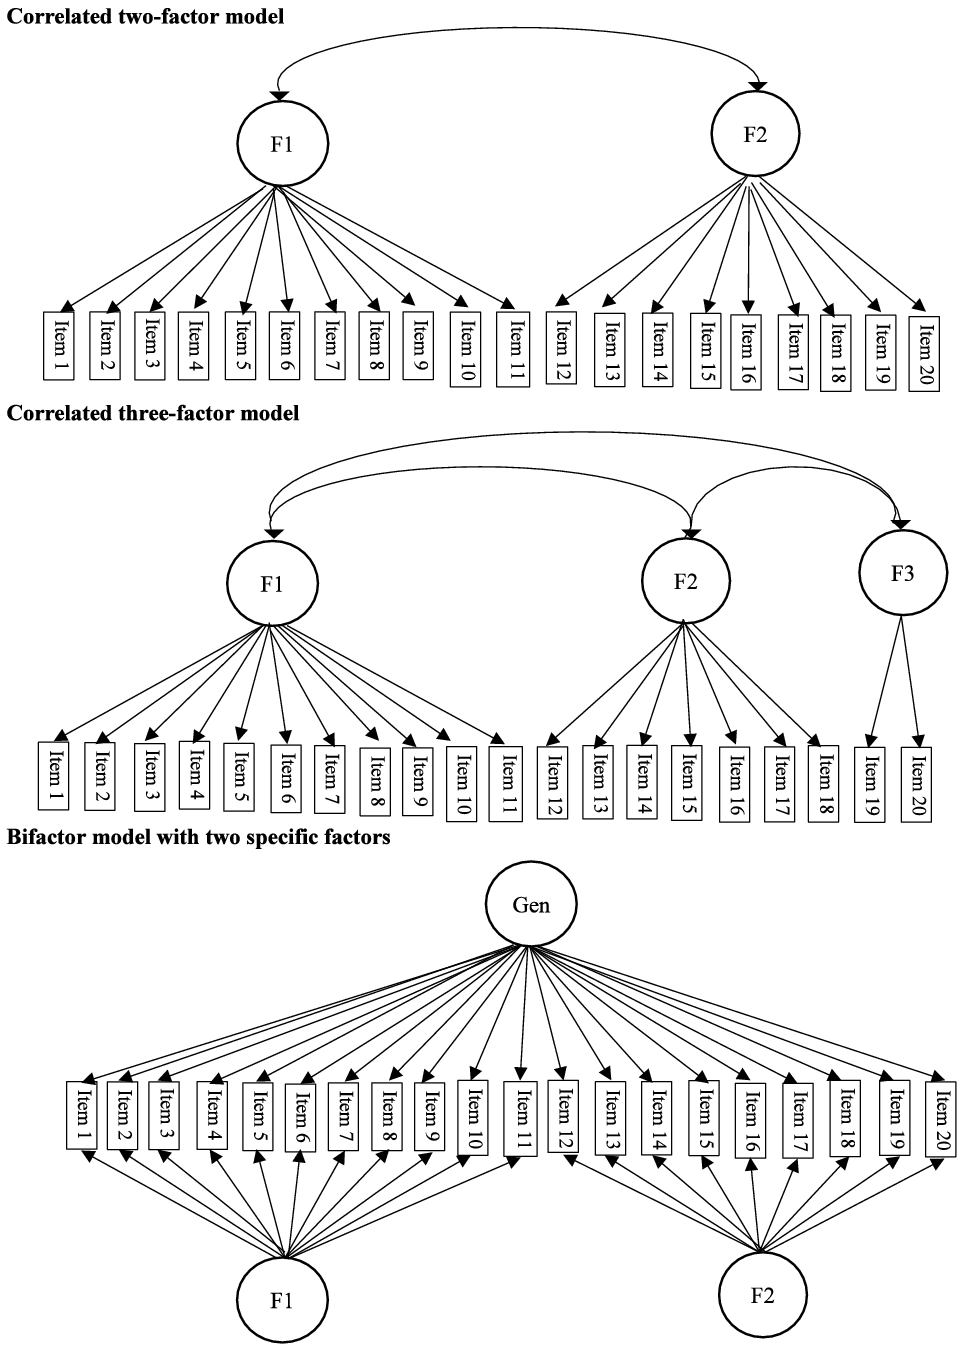
Based on the ordinal nature of the HBI ratings, polychoric correlations were computed to examine inter-item correlation (Agtarap et al., Reference Agtarap, Kramer, Campbell-Sills, Yuh, Mukherjee, Manley and Nelson2020; Karr & Iverson, Reference Karr and Iverson2020; Rodriguez et al., Reference Rodriguez, Reise and Haviland2016) Next, we conducted exploratory factor analyses (EFA) to verify the two factors identified in previous research (Ayr et al., Reference Ayr, Yeates, Taylor and Browne2009). Because the HBI is intended to measure PCS after concussion, EFAs were conducted separately for mTBI and OI groups and for child and parent ratings. Models adopted Geomin rotation, an oblique method that allows correlations between factors (Agtarap et al., Reference Agtarap, Kramer, Campbell-Sills, Yuh, Mukherjee, Manley and Nelson2020; Brett et al., Reference Brett, Kramer, McCrea, Broglio, McAllister, Nelson and Susmarski2020; Nelson et al., Reference Nelson, Kramer, Patrick and McCrea2018). Factors with eigenvalues > 1, scree plot inflections, and high factor loadings (> 0.7) were all considered to determine candidate models. Confirmatory factor analyses (CFAs) included correlated two-factor and three-factor models, as well as a three-factor bifactor model using two subfactors for the cognitive and somatic items (Figure 2). A four-factor bifactor model could not be examined in confirmatory analyses due to convergence issues. Factors were set to be orthogonal in the bifactor model but were allowed to correlate with one another in the correlated models.
Factor models.

Models were compared using multiple fit indices. Absolute fit was assessed using the root mean square error of approximation (RMSEA). Incremental fit was evaluated using comparative fit index (CFI) and Tucker-Lewis index (TLI). Models with RMSEA < 0.05 and CFI/TLI > 0.95 were considered good fit, and RMSEA < 0.08 and CFI/TLI > 0.9 were considered acceptable fit. A weighted least squares with mean and variance adjusted (WLSMV) estimator was incorporated to accommodate for the ordinal nature of the HBI items (Agtarap et al., Reference Agtarap, Kramer, Campbell-Sills, Yuh, Mukherjee, Manley and Nelson2020; Karr & Iverson, Reference Karr and Iverson2020; Nelson et al., Reference Nelson, Kramer, Patrick and McCrea2018). Theta parameterization was used to allow for the inclusion of residual variances as parameters to permit testing strict MI (Karr & Iverson, Reference Karr and Iverson2020). Model-based reliability measures of omega, omega hierarchical (omegaH), and relative omega were computed, with a particular focus on omegaH, to estimate the proportion of observed variance in total and subscale scores that could be attributed to the underlying general and subfactors (Reise, Reference Reise2012). In addition, Pearson correlations were computed between predicted factor scores and calculated HBI scores to explore their association.
Measurement invariance
MI is a stepwise approach that compares nested models by adding increasingly stringent constraints to model parameters. The analyses test whether a given scale measures the same construct at different time points or between different groups of people. We tested MI across time (post-acute vs. 3-months vs. 6-months), raters (parent vs. child), and groups (concussion vs. OI). MI is defined as four progressively more stringent levels: configural, weak, strong, and strict. In configural invariance, the pattern of factor loading is consistent across time/groups/raters, and each item should load most highly onto the same respective factor. Weak invariance constrains item loadings on the factors to be equal across time/groups/raters. It allows for the comparison of factor variances and covariances, meaning the proportion of variance in each HBI item accounted for by each factor is similar over time and across groups/raters. Strong invariance constrains item thresholds to be equivalent across time/groups/raters. Factor means between groups or within-person mean factor scores across time can be compared at this level, with differences in factor means reflecting true differences in the construct measured. Lastly, strict invariance further constrains the residual variances of items to be the same across time/groups/raters. In this case, differences in item parameters (i.e., means, variance, and covariance) are entirely attributable to differences in factor means over time or between groups/raters. Because of model complexity, and to ensure convergence, the test of configural invariance across time for the correlated two-factor model had to be defined differently for parent versus child ratings; no constraints were necessary for the analysis based on child ratings, but one item was constrained to be equal across time for the analysis based on parent ratings. Given the constraint at the configural level is consistent with weak, strong, and strict invariance, our subsequent tests for MI are valid.
MI is established when the fit of the more stringent model (e.g., strong invariance) is no worse compared to the one with more relaxed assumptions (e.g., weak invariance), as indicated by fit statistics. Consistent with prior studies, we rejected the more restricted model if CFI decreased by > 0.01 or RMSEA increased by > 0.015. Chi-square differences were not calculated due to their oversensitivity in large samples and a lack of an appropriate test to handle scaled chi-square differences from the WLSMV estimators. We examined factor scores once strong invariance was achieved to assess differences in mean scores between raters, groups, and time points; factor scores were estimated based on the strict invariance model and expressed in standardized units (i.e., Z scores). To test for group MI, the two highest categories in symptom ratings had to be combined for a few items because the OI group did not select “often” as a response. However, categories were collapsed for only three items for parent ratings at all three time points and two and one item for child ratings at 3 and 6 months, respectively. Factor analyses were implemented in R (version 4.0.3) and descriptive analyses were conducted in Stata (version 15.0/MP, StataCorp, College Station, Texas).
Results
Exploratory factor analyses
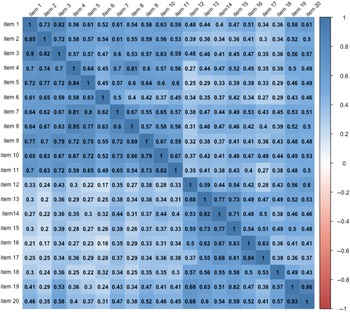
EFA analyses showed consistent loadings of the first 11 items, involving cognitive symptoms, onto the first factor across the three time points for both child and parent ratings. This was further evident in the polychoric correlations, which showed strong inter-item correlations among items 1–11 (Figure 3). Items 12–20 involving somatic symptoms loaded onto two different factors when based on eigenvalues > 1, with items 19 and 20 loading separately from the others, suggesting the possibility of a third fatigue factor; however, the eigenvalues for the third factor were relatively low and scree plots suggested a 2-factor solution. When EFA were constrained to 2 factors, items 1–11 loaded onto factor 1 and items 12–20 onto factor 2 across all time points for each group and rater. Occasional loadings of items 19 and 20 onto the first factor were also observed, again suggesting the possibility of a third fatigue factor.
Polychoric correlation of HBI items at post-acute. Correlations above diagonal line are from children’s ratings and correlations below the diagonal line are from parents’ ratings.

Confirmatory factor analyses
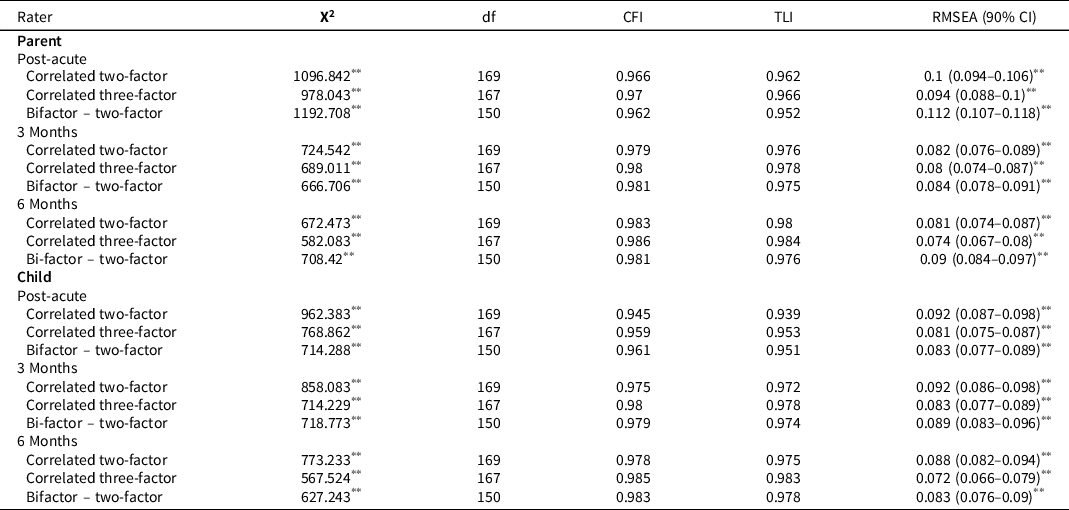
Fit statistics for the correlated two-factor, correlated three-factor, and three-factor bifactor models are presented in Table 3. At each time point, the correlated three-factor model consistently achieved the best absolute and incremental fit, although no model established good fit due to RMSEA > 0.05.
Fit statistics for confirmatory factor models at each time point across raters

X2 = chi-square statistic; df = degrees of freedom; RMSEA = root mean square error of approximation statistic; CFI = comparative fit index; TLI = Tucker-Lewis index.
Note: model fitted for mTBI group only.
** p-value ≤ 0.001.
Correlated two-factor model
The correlated two-factor model had the worst fit at post-acute for both raters. All RMSEA were > 0.08 and the fit indices were worse than the other two models at all time points for child’s ratings. Fit indices were better for the parent ratings at all time points except for RMSEA post-acutely.
Correlated three-factor model
The correlated three-factor model demonstrated improved fit compared to the more parsimonious two-factor model. Loadings of items 19 and 20 on the third factor, reflecting fatigue, were 0.92 and 0.934, 0.974 and 0.967, and 0.965 and 0.966 at post-acute, 3-months, and 6-months respectively; these loadings were consistently higher than their loadings on the second factor in the correlated two-factor model, which were 0.883 and 0.894., 0.954 and 0.953, 0.95 and 0.953 at post-acute, 3-months, and 6-months respectively. Parent ratings displayed better comparative fit statistics post-acutely and the child ratings showed better absolute fit than parent ratings (RMSEA 0.081 vs. 0.094) post-acutely, with no apparent differences at other time points.
Bifactor model
The three-factor bifactor model for parent ratings resulted in the worst fit indices at post-acute and 6-months compared to the other two models. For child ratings, absolute and incremental fit were better than the correlated two-factor model at all time points. The bifactor model failed to achieve acceptable fit at any time point for both raters because RMSEA > 0.08; however, comparative fit indices (CFI/TLI) were greater than 0.95. The omegaH for the parent model were 0.89, 0.81, and 0.87 at post-acute, 3-months, and 6-months, respectively. For the child model, omegaH were 0.68, 0.86, and 0.64 at post-acute, 3-months, and 6-months, respectively. These high omega values for the general factor suggest that 64% to 89% of the reliable variance in the HBI can be attributed to this factor. However, some substantive variance was explained by the subfactors, especially for the child ratings. Pearson correlations between the predicted general factor score and the total HBI score for the child and parent ratings were large and significant across all three time points. Correlations between predicted subfactor scores and the calculated cognitive and somatic scores were all significant but ranged from 0.13 to 0.89 (supplementary Table 1).
Measurement invariance
Invariance of the three models in the CFA was tested across raters, time points, and groups. Additionally, a bifactor model with three subfactors was tested across raters and time points as it was able to converge.
Rater invariance
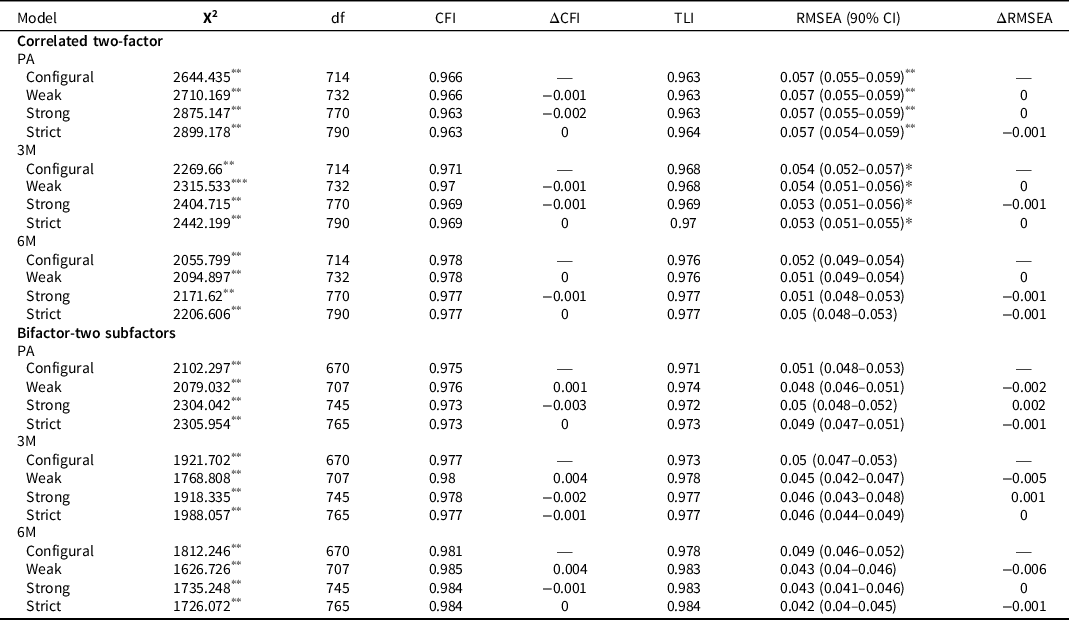
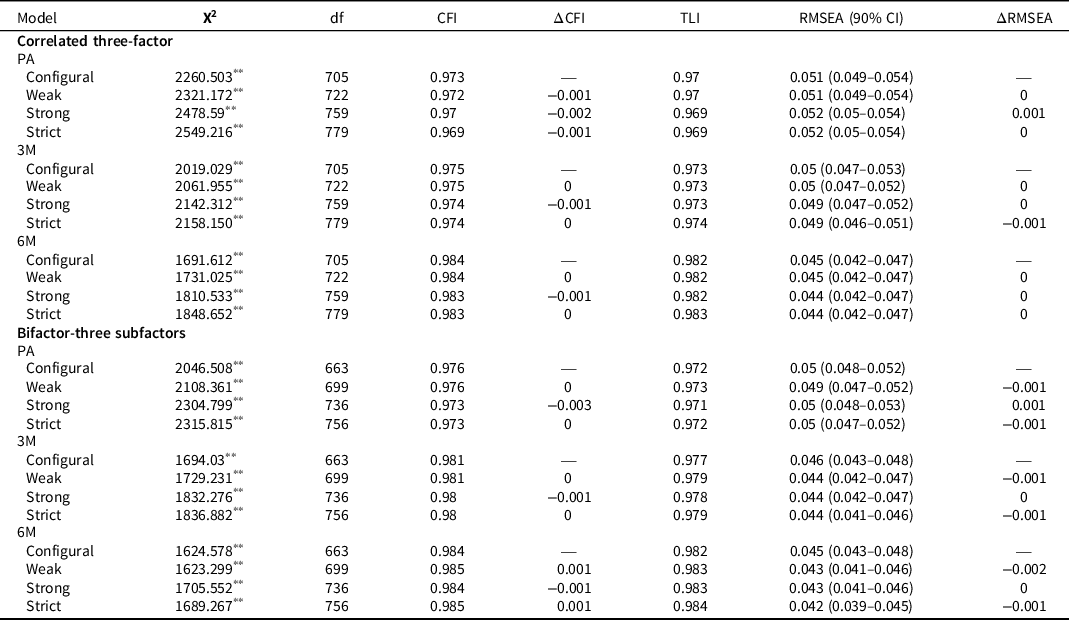
Tables 4 and 5 present the fit statistics for tests of MI across raters for each of the models, with statistics for each of the increasingly more stringent assumptions. All models at all time points demonstrated CFI/TLI > 0.96 and RMSEA < 0.08, indicating acceptable fit. Consistent with the criteria for MI, no CFI decreased more than 0.01 and none of the RMSEA increased more than 0.015; therefore, strict invariance across child and parent ratings was established at each time point for all four models. Analogous to the results in the CFA, the correlated three-factor model had slightly better fit indices than the correlated two-factor model. For the bifactor models, differences in fit between models with three versus two subfactors were less apparent.
Fit statistics for measurement invariance of two-factor models across raters within time points

X2 = chi-square statistic; df = degrees of freedom; RMSEA = root mean square error of approximation statistic; CFI = comparative fit index; TLI = Tucker-Lewis index. Note: **p-value <0.001, *0.001 ≤ p-value <0.05. Δ: current model subtract the previous (the one above) model.
Fit statistics for measurement invariance of three-factor models across raters within time points

X2 = chi-square statistic; df = degrees of freedom; RMSEA = root mean square error of approximation statistic; CFI = comparative fit index; TLI = Tucker-Lewis index. Note: **p-value <0.001, Δ: current model subtract the previous (the one above) model.
Longitudinal invariance
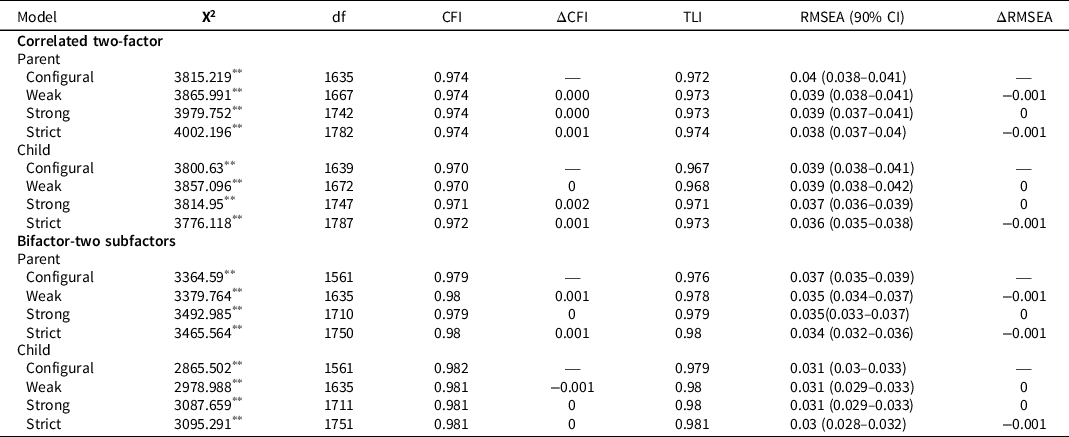
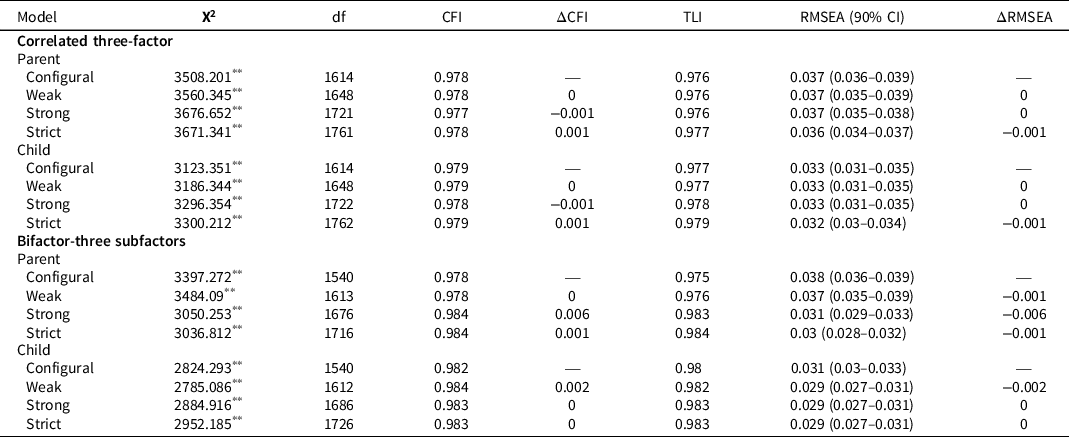
Tables 6 and 7 display the fit statistics for tests of MI across time points separately for child and parent ratings. Model parameters were constrained to be equal across all three time points. Strict invariance was achieved across all time points for all models for both raters. All models retained good fit with CFI/TLI > 0.97 and RMSEA < 0.04. At each level of invariance, fit indices were either similar or better for child than parent ratings for all models except for CFI and TLI for the correlated two-factor model. Model fit was better when comparing the three-factor bifactor model to the correlated two-factor model, particularly for children’s ratings (ΔCFI between 0.009 to 0.012 and ΔRMSEA between 0.003 to 0.008). The same difference was apparent but smaller when comparing the three-factor correlated model with the four-factor bifactor model. For each rater, absolute and incremental fit improved as more constraints were imposed on model parameters.
Fit statistics for measurement invariance of two-factor models within raters across time points

X2 = chi-square statistic; df = degrees of freedom; RMSEA = root mean square error of approximation statistic; CFI = comparative fit index; TLI = Tucker-Lewis index. Note: **p-value <0.001, Δ: current model subtract the previous (the one above) model.
Fit statistics for measurement invariance of three-factor models within raters across time points

X2 = chi-square statistic; df = degrees of freedom; RMSEA = root mean square error of approximation statistic; CFI = comparative fit index; TLI = Tucker-Lewis index. Note: ** p-value <0.001, Δ: current model subtract the previous (the one above) model.
Group invariance
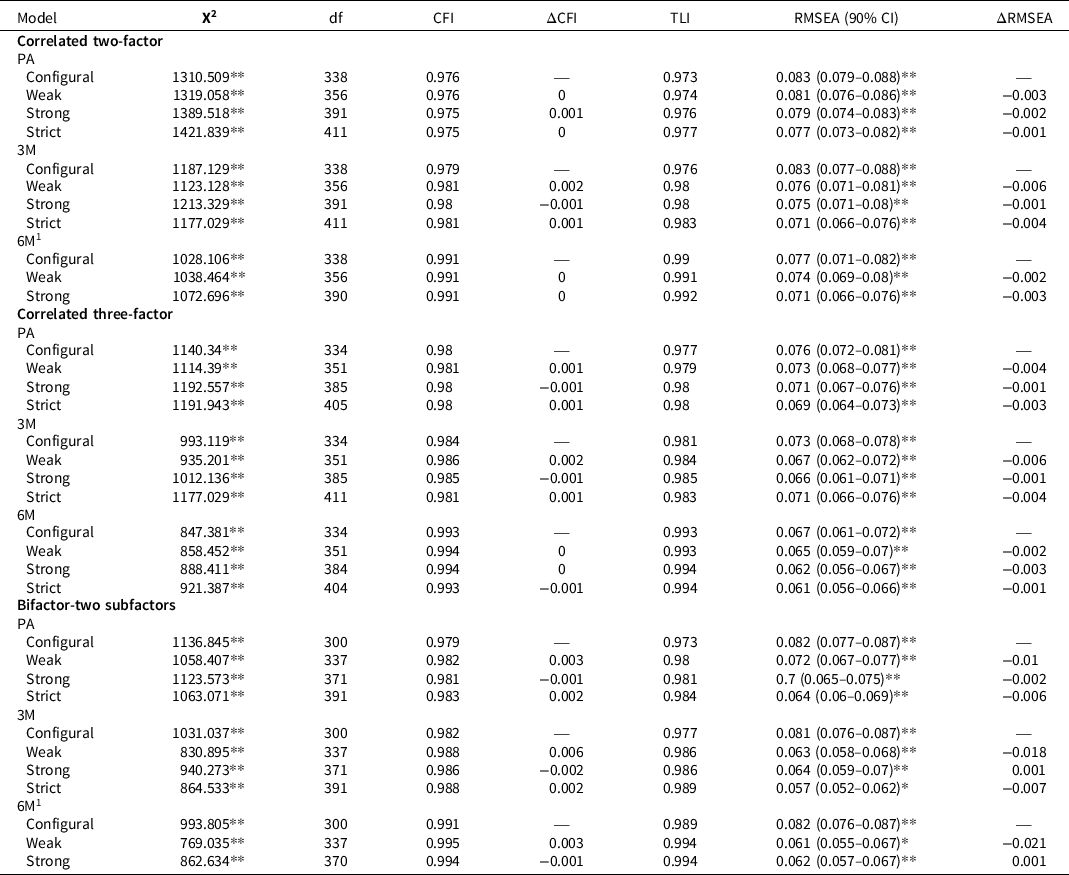
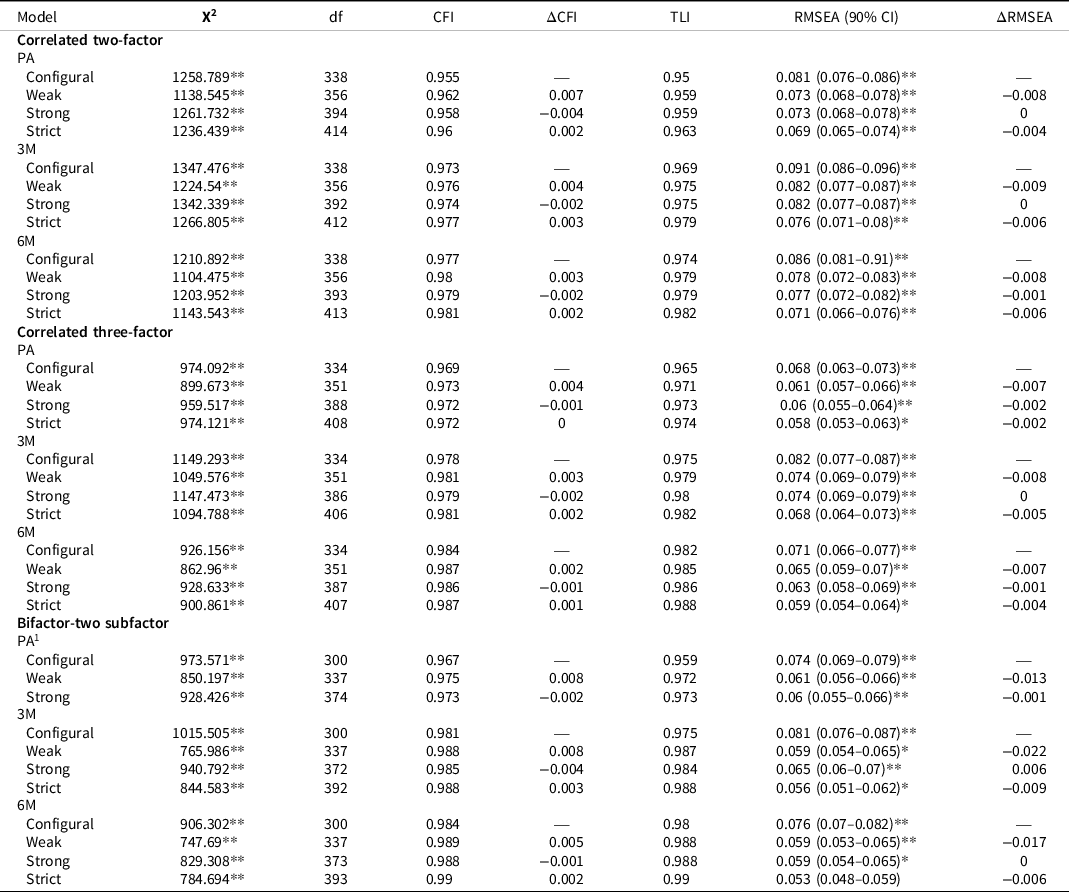
Tables 8 and 9 present the fit statistics for MI across the concussion and OI groups for parents and children, respectively. The bifactor model with three subfactors was unable to converge; hence, fit indices were not derived. For parent ratings, delta parameterization was used at 6-months for the correlated two-factor and bifactor model with two subfactors, precluding testing for strict invariance as residual variances are not included in the model under delta parameterization. For child ratings, delta parameterization was used at post-acute for the bifactor model. Strict invariance was established for all models at each time point separately for child and parent ratings, except for models that used delta parameterization, for which strong invariance was achieved.
Fit statistics for measurement invariance across groups for parent rating

Note:
1 due to convergence issues, delta parameterization was used; therefore, strict invariance cannot be fitted.
**p-value < 0.001.*p-value < 0.05. Δ: current model subtracts the previous (the one above) model.
Fit statistics for measurement invariance across groups for child rating

Note:
1 due to convergence issues, delta parameterization was used; therefore, strict invariance cannot be fitted.
**p-value < 0.001.*p-value < 0.05. Δ: current model subtracts the previous (the one above) model.
The correlated two-factor model at 6-months and correlated three-factor model at 3-months and 6-months achieved acceptable fit at each invariance level for parent ratings. For child ratings, the correlated three-factor and bifactor model achieved acceptable fit at post-acute and 6-months at each invariance level. In turn, no model showed good fit at the configural level due to RMSEA > 0.05. Child ratings demonstrated a consistent pattern of better model fit as more constraints were imposed at all time points. The same pattern was apparent for parent ratings except for the correlated three-factor model at 3-months, with the strong invariance model showing better fit than strict invariance model. Incremental fit for parent ratings at 6-months was excellent for each model (CFI > 0.99, TLI > 0.988). Every CFI/TLI in Table 9 (child) was equal to or greater than 0.95, reflecting good incremental fit. The largest improvement in absolute fit was observed in the bifactor model at 3-months and 6-months for both raters; RMSEA decreased between 0.017 to 0.021 moving from configural to weak invariance. The correlated three-factor model showed the best overall fit at the configural level at post-acute, followed by the bifactor model with two subfactors. The three-factor bifactor model, when moving from weak to strict invariance, retained better fit than the correlated three-factor model at 6-months for child ratings.
Comparison of means
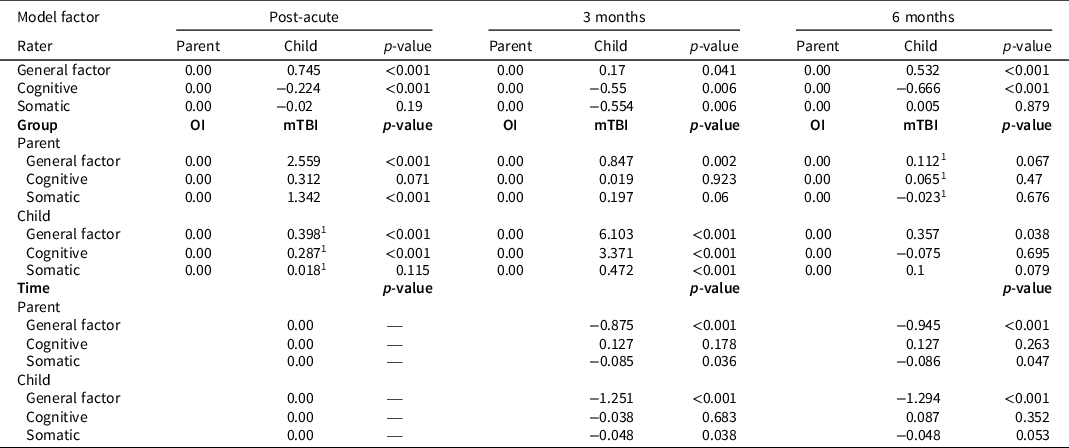
The achievement of at least strong invariance indicates that factor means can be compared between different groups and across time. Table 10 illustrates the mean differences between factors by raters/groups/time based on the strict invariance three-factor bifactor model, which we chose for this purpose because it had the most acceptable fit indices. When comparing child and parent ratings, the mean of the general factor was significantly higher for child ratings at each time point. The cognitive subfactor showed an opposite pattern, indicating that children rate themselves lower on cognitive symptoms after accounting for general differences in symptom ratings. On the somatic subfactor, ratings differed significantly only at 3-months, with child ratings lower than parent ratings. In group comparisons, the concussion group consistently scored higher than the OI group on the general factor according to both raters. Group differences on the cognitive subfactor were not significant at any time for parent ratings but were higher in the concussion group at post-acute and 3-months for child ratings. The concussion group scored significantly higher on the somatic subfactor at post-acute based on parent ratings and at 3-months based on child ratings. General factor means decreased significantly over time for both raters. Cognitive subfactor means did not change significantly for either rater, while somatic subfactor means decreased significantly over time for both child and parent ratings.
Mean differences assuming strict measurement invariance for the three-factor bifactor model by rater, group, and time

Note:
1 strong invariance model used instead.
Discussion
The current study validated and supported the two underlying dimensions of the HBI (cognitive and somatic symptoms) established in its original derivation study (Ayr et al., Reference Ayr, Yeates, Taylor and Browne2009). A third factor, represented by fatigue symptoms, may serve as an additional dimension; however, its inclusion in a four-factor bifactor model was constrained by convergence issues. At the configural level, almost all models achieved either acceptable or good fit, reflecting the robustness of the basic cognitive and somatic factor structure. When comparing correlated factor models to the bifactor model, however, the bifactor model consistently achieved better fit, and this difference was most apparent when using two subfactors. Fit indices for the bifactor model with two subfactors and the correlated three-factor model were similar; therefore, the three-factor bifactor model may be the better solution based on parsimony, although the negative item-level loadings of items 19 and 20 onto the somatic subfactor suggests the possibility of further dividing this subfactor into vestibular and fatigue components. However, when comparing factor loadings of the correlated two-factor and three-factor bifactor models, the high, consistent, and distinct loadings of the correlated model provide an easier interpretation of the underlying dimensions. In summary, the three-factor bifactor model achieved the most consistent acceptable fit indices across groups, raters, and time, while the correlated two-factor model achieved greater parsimony. Either model can reasonably be used to interpret ratings on the HBI.
Both the bifactor and correlated factor models align with other studies regarding the dimensions represented by PCS. The Sport Concussion Assessment Tool-3, the Post-Concussion Symptom Scale, and the Rivermead Postconcussion Symptoms Questionnaire are often used to measure PCS ratings. A specific cognitive factor has been consistently identified in previous research studies that used the bifactor model to examine the structure of those tools (Agtarap et al., Reference Agtarap, Kramer, Campbell-Sills, Yuh, Mukherjee, Manley and Nelson2020; Brett et al., Reference Brett, Kramer, McCrea, Broglio, McAllister, Nelson and Susmarski2020; Joyce et al., Reference Joyce, Labella, Carl, Lai and Zelko2015; Karr & Iverson, Reference Karr and Iverson2020). A specific somatic or physical factor was also identified in four of the studies (Agtarap et al., Reference Agtarap, Kramer, Campbell-Sills, Yuh, Mukherjee, Manley and Nelson2020; Ayr et al., Reference Ayr, Yeates, Taylor and Browne2009; Joyce et al., Reference Joyce, Labella, Carl, Lai and Zelko2015; Karr & Iverson, Reference Karr and Iverson2020), while fatigue was identified in one study (Brett et al., Reference Brett, Kramer, McCrea, Broglio, McAllister, Nelson and Susmarski2020). Some previous studies also identified a specific vestibular symptom dimension, but that was not apparent on the HBI (Franke et al., Reference Franke, Czarnota, Ketchum and Walker2015; Taylor et al., Reference Taylor, Dietrich, Nuss, Wright, Rusin, Bangert and Yeates2010). The differences in factor structure across rating scales likely depend largely on the types of items included in various instruments (e.g., the HBI does not include emotional symptoms), and perhaps on the nature of the responses required, ranging from yes-no to 7 point Likert-type scales.
Tests of MI demonstrated strict invariance across raters, time, and groups for all comparisons in the absence of convergence issues, and at least strong invariance when convergence could not be achieved. Thus, clinicians and researchers using the HBI can confidently assume that its scores are measuring the same constructs in these different groups, raters, and over time. Indeed, strict invariance across child and parent ratings signifies that the HBI items measure the same constructs on the same scales in both children and parents, and any difference in the means, variances, and covariances of the individual items are solely due to differences in the common factors (Liu et al., Reference Liu, Millsap, West, Tein, Tanaka and Grimm2017). Although past studies have found only moderate agreement between child and parent ratings on the HBI (Ayr et al., Reference Ayr, Yeates, Taylor and Browne2009; Hajek et al., Reference Hajek, Yeates, Taylor, Bangert, Dietrich, Nuss and Wright2011; Taylor et al., Reference Taylor, Dietrich, Nuss, Wright, Rusin, Bangert and Yeates2010), our findings suggest that the constructs measured by child and parent ratings are the same. Thus, mean differences between child and parent ratings are likely reflections of true differences in child and parent perceptions, rather than differences in what the scales are measuring.
Our study has several limitations. Attrition occurred over time, and the data may have been not missing at random (MAR), which can bias WLSMW estimates. However, we have previously tested for differences between those who returned for follow-up assessments versus those who did not across a broad range of variables and did not find any significant differences, suggesting the data are MAR. Another limitation is that we needed to collapse symptom ratings on several items in the concussion group to test group MI. However, ratings were collapsed for no more than two items for child ratings and no more than three items for parent ratings at any given time point. Finally, the study sample was largely white and well-educated, so the results may not be generalizable to the general population. Future research is needed to determine whether the MI demonstrated in this study extends to more diverse samples.
The good fit of the bifactor model and the strong correlation between the predicted general factor score and the computed total HBI score suggest that clinicians can use a total score when measuring concussion symptoms with the HBI. However, the strong loadings of the correlated two-factor model, as well as the subfactors in the bifactor model, suggest that clinicians may also want to use subscales to isolate specific symptom dimensions to guide individualized treatment and rehabilitation. Indeed, the bifactor model provides a justification for assessing both overall symptom severity and the severity of cognitive and somatic symptoms, which may have distinct diagnostic and prognostic value beyond the total score. Using a total score can obscure the severity of specific symptom types. Two individuals with the same total score could exhibit different scores on the cognitive and somatic subscales; therefore, assessing specific subscales may improve detection of more subtle concussion-related sequelae (Brett et al., Reference Brett, Kramer, McCrea, Broglio, McAllister, Nelson and Susmarski2020). Notably, the general and subfactors of the bifactor model are independent, so the model estimates the unique contribution of the subfactors (Chen et al., Reference Chen, Hayes, Carver, Laurenceau and Zhang2012). The omegaH values and the factor loadings of the bifactor model signify that a general factor is a good representation of all HBI items, but the subfactors are also needed to account for the remaining variance, providing strong evidence for the use of both a total score and subscale scores. Use of the bifactor model could allow for a more precise assessment of specific symptom types and allow for more targeted intervention through selection of specific treatment modalities based on subfactor elevations. However, the inconsistent correlations between the predicted factor scores and calculated subscale scores indicate that simply relying on the raw subscale scores as a reflection of the true factor scores might be inadvisable.
Future study is needed to examine the stability of the three-factor bifactor and correlated two-factor models across different post-injury time points and groups (e.g., healthy children, younger children, and children with concussion recruited from settings other than the ED) to validate the HBI’s underlying dimensions and to inform clinical applications. A factor consisting of emotional symptoms has sometimes been identified in past factor analytic studies of concussion symptom ratings, but this emerged only for parent ratings in the original derivation study of the HBI, and not for child ratings; validated rating scales of emotional symptoms may be included as a supplement to the HBI for specific research or clinical purposes. Similarly, ratings of behavioral difficulties did not cohere in the derivation of the HBI but may be relevant for younger children (Dupont et al., Reference Dupont, Beaudoin, Desire, Tran, Gagnon and Beauchamp2021). Future research also should continue to examine the relative contributions of injury and non-injury factors as predictors of the general and subfactors, or the two correlated factors (cognitive and somatic), of the HBI (O’Neill et al., Reference O’Neill, Rose, Davidson, Shiplett, Castillo and McNally2021).
Our study indicates that the HBI structure is best represented either by a three-factor bifactor model that captures an essentially unidimensional general component of concussion symptom severity along with distinct, but related, dimensions of cognitive and somatic symptoms, or by a correlated two-factor model that contains cognitive and somatic subscales. The HBI can be used to measure PCS consistently over time by both parents and children, and in individuals with concussion or other injuries, for comparison across various phases of concussion recovery, at least for children who are originally seen in the ED. Efforts to characterize individuals based on profiles across the dimensions of these models may facilitate a more precise approach to classifying and treating children with concussion.
Supplementary material
To view supplementary material for this article, please visit https://doi.org/10.1017/S1355617722000340
Acknowledgements
The authors thank all the children and parents who participated in the study, as well as the research staff for their assistance in carrying out the study.
Funding statement
The data reported here were collected with support from a Canadian Institutes of Health Foundation grant (FDN143304) to Keith Yeates.
Conflicts of interest
Roger Zemek holds Clinical Research Chair in Pediatric Concussion from University of Ottawa and sits on the concussion advisory board for Parachute Canada; he is the co-founder, Scientific Director and a minority shareholder in 360 Concussion Care, an interdisciplinary concussion clinic. All other authors have nothing to declare.