INTRODUCTION
The number and extent of protected areas (PAs) have been used as indicators for a variety of conservation targets (Chape et al. Reference Chape, Harrison, Spalding and Lysenko2005; Butchart et al. Reference Butchart, Walpole, Collen, van Strien, Scharlemann, Almond, Baillie, Bomhard, Brown and Bruno2010). However, despite significant expansion in the global PA network, there is concern that the ecological performance (sensu Gaston et al. Reference Gaston, Jackson, Cantu-Salazar and Cruz-Pinon2008) of these areas, namely representation and maintenance of biodiversity, cannot be assumed (Laurance et al. Reference Laurance, Useche, Rendeiro, Kalka, Bradshaw, Sloan, Laurance, Campbell, Abernethy and Alvarez2012; Solano-Fernandez et al. Reference Solano-Fernandez, Attwood, Chalmers, Clark, Cowley, Fairweather, Fennessy, Gotz, Harrison and Kerwath2012). For example, the occurrence of protected area downgrading, downsizing and degazettement may undermine the positive trend in PA expansion (Fuller et al. Reference Fuller, McDonald-Madden, Wilson, Carwardine, Grantham, Watson, Klein, Green and Possingham2010; Mascia & Pailler Reference Mascia and Pailler2011; Mascia et al. Reference Mascia, Pailler, Krithivasan, Roshchanka, Burns, Mlotha, Murray and Peng2014). Although downsizing (reduction in size of a PA) and degazettement (abandonment of legal protection) are likely to be captured by indicators of PA extent, the occurrence of downgrading (in essence, an increase in the size, number and extent of permitted [legal], but also illegal, human activities within PAs) is more subtle and may be undetected beyond local scales of management (Dudley Reference Dudley2008).
While PA downgrading and associated change in the use of resources in PAs is concerning for biodiversity, it does parallel the shift in thinking about the role of PAs that has taken place over the last three decades. The pre-1980 view that PAs were largely managed to the general exclusion of local communities shifted significantly across the course of two World Parks Congresses (Naughton-Treves et al. Reference Naughton-Treves, Buck Holland and Brandon2005; Bϋscher & Wolmer Reference Bϋscher and Wolmer2007). The recognition in the early 1980s that PAs would be sustainable only in so far as they addressed human concerns brought about a policy change towards ecosystem service, tourism and infrastructure benefits from PAs being directed beyond their boundaries (Wilshusen et al. Reference Wilshusen, Brechin, Fortwangler and West2002). Although still controversial in application (Adams et al. Reference Adams, Aveling, Brockington, Dickson, Elliott, Hutton, Roe, Vira and Wolmer2004; Locke & Dearden Reference Locke and Dearden2005; Salafsky Reference Salafsky2011), it is widely recognized that local communities should play a role in PA management (Andrade & Rhodes Reference Andrade and Rhodes2012), and that these areas should contribute to local livelihoods and poverty reduction, thereby fostering a vested interest in conservation (Wells & McShane Reference Wells and McShane2004). This concept is not new, but the process of effectively integrating multiple sustainability objectives into PA management has been slow and faces a range of implementation barriers (Adams et al. Reference Adams, Aveling, Brockington, Dickson, Elliott, Hutton, Roe, Vira and Wolmer2004; Ferraro & Hanauer Reference Ferraro and Hanauer2011).
At the same time, a rise in environmental crime (such as commercial poaching) driven by organized international syndicates has significantly raised the profile of the plight of particular species and resources (Lenzen et al. Reference Lenzen, Moran, Kanemoto, Foran, Lobefaro and Geschke2012; Nellemann Reference Nellemann2012). This increase in organized environmental crime has also extended the concept and scale of overharvesting from one driven largely by the subsistence requirements of local communities, to sophisticated syndicates linking supply and demand across continents (Lenzen et al. Reference Lenzen, Moran, Kanemoto, Foran, Lobefaro and Geschke2012; Lindsey et al. Reference Lindsey, Balme, Becker, Begg, Bento, Bocchino, Dickman, Diggle, Eves and Henschel2013). It is clear that both legal and illegal extraction of biological resources takes place across many of the world's PA systems (Naughton-Treves et al. Reference Naughton-Treves, Buck Holland and Brandon2005; Ndanyalasi et al. Reference Ndanyalasi, Bitariho and Dovie2007; Lindsey et al. Reference Lindsey, Balme, Becker, Begg, Bento, Bocchino, Dickman, Diggle, Eves and Henschel2013) and that these activities may affect PA ecological performance and contribution to national and global conservation targets (Leverington et al. Reference Leverington, Lemos Costa, Pavese, Lisle and Hockings2010). However, although some processes (such as logging and deforestation), species and cases (such as elephant and rhinoceros poaching) receive significant attention, other trades are less well understood (such as the bushmeat trade in Africa: Lindsey et al. Reference Lindsey, Balme, Becker, Begg, Bento, Bocchino, Dickman, Diggle, Eves and Henschel2013). The collective risk posed to PA ecological performance by the full suite, diversity and extent of resource extraction and resource use practices has rarely been quantified at local and regional scales.
Considering the full suite of harvest activities is essential for understanding and interpreting potential risks to protected areas. For example, as the diversity of species harvested increases, marginal species might begin to disappear and biological community level impacts and species loss from the system may start to occur. Species loss may occur even where the main target species is not threatened, but due to opportunistic exploitation of rarer species (Gaston et al. Reference Gaston, Jackson, Cantu-Salazar and Cruz-Pinon2008; Branch et al. Reference Branch, Lobo and Purcell2013) or habitat degradation. Similarly, risk is likely to increase as harvesting shifts in extent from individual sites, or areas within a particular PA (such as a management zone designated for this purpose of use, or infrequent poaching events) to widespread harvesting within and across multiple PAs (Naughton-Treves et al. Reference Naughton-Treves, Alvarez-Berr, Brandon, Bruner, Holland, Ponce, Saenz, Suarez and Treves2006), potentially resulting in a decline in species’ conservation status. The risk of degradation in particular PAs, or habitats within them, increases as harvesting changes from sporadic, low volume use of particular species, to wide-scale depletion of one or more targeted resources. Such depletion is often followed by resource substitution with other species, and increasingly indiscriminate harvest of available resources may ensue (Petersen et al. Reference Petersen, Moll, Collins and Hockings2012). In general, if extraction is not adequately managed, PA ecological performance will decline as the quantity, extent and diversity of extractive resource use increases beyond sustainable thresholds in individual PAs and across reserve networks (Kremen Reference Kremen2005).
In this paper, we demonstrate that quantification of the diversity and impact of all harvested resources (in addition to particular high priority taxa or practices) is necessary to understand the consequences of resource use for PA ecological performance (such as achieving biodiversity objectives and contributing to national and global conservation targets). Further, we argue that although recognition of the problems and trade-offs associated with resource extraction from PAs is essential to their effective management (Salafsky Reference Salafsky2011), these trade-offs are not universally acknowledged, at least in part because data are inadequate. Willingness to engage in this discussion and the importance of an evidence-base to support decisions about trade-offs is an essential first step. While there has been a significant shift towards softening access restrictions to PAs (Naughton-Treves et al. Reference Naughton-Treves, Buck Holland and Brandon2005; Andrade & Rhodes Reference Andrade and Rhodes2012), this has not been matched by the investment necessary to successfully manage the transition and ensure that both biodiversity and social objectives are achieved (Blore et al. Reference Blore, Cundill and Mkhulisi2013). Here we examine the evidence base available for informing resource use sustainability decisions across the national park network in South Africa.
METHODS
Study area
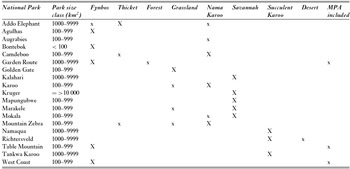
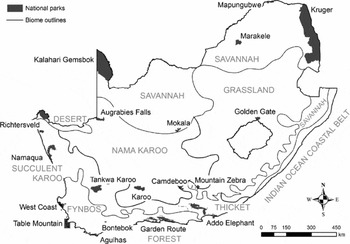
The South African National Parks (SANParks) estate (19 parks, as well as three adjacent marine protected areas [MPAs] considered separately here from the terrestrial components; Supplementary material, Appendix 1) covers about 39000 km2, constitutes 52% of terrestrial protected area in South Africa, spans the country geographically and encompasses a diverse range of park sizes (from 50–20000 km2), urban to rural contexts, climates and eight of the nine major biomes of the region (Fig. 1; Table 1). The SANParks estate provides an appropriate model system for investigating resource use-related risks, as it represents a developed, highly biodiverse (Myers et al. Reference Myers, Mittermeier, Mittermeier, da Fonseca and Kent2000), well-supported and comparatively effectively managed network of PAs (du Toit et al. Reference du Toit, Rogers and Biggs2003; Craigie et al. Reference Craigie, Baillie, Balmford, Carbone, Collen, Green and Hutton2010). These PAs nonetheless lie within a complex socioeconomic context of rapid population growth (including immigration from rural areas and other parts of Africa), high unemployment, poverty and accompanying socioeconomic demands (Thondhlana et al. Reference Thondhlana, Shackleton and Muchapondwa2011; Stats SA [Statistics South Africa] Reference Stats2012), in a country with a long history of biological resource use (including over 2000 plant species (van Wyk & Gericke Reference van Wyk and Gericke2007; van Wyk et al. Reference van Wyk, van Oudtshoorn and Gericke2009), used by over 27 million consumers (Mander et al. Reference Mander, Ntuli, Diederichs and Mavundla2007) for a wide variety of medicinal, ritual and subsistence purposes). This juxtaposition of high biodiversity, rapid population growth and social development needs is not unique to South Africa, and is widely recognized as a general threat to biodiversity (Turner et al. Reference Turner, Brandon, Brooks, Costanza, da Fonseca and Portela2007).
National parks in South Africa and the biomes contained within each park (X = dominant or single biome per park; x = additional biome element in park), including Fynbos (dominant in five parks), Savannah (5), Succulent Karoo (3) and Nama Karoo (dominant in three), with components of Forest, Grassland (including one entire park), Desert and Thicket biomes in some parks (Mucina & Rutherford Reference Mucina and Rutherford2006).

The nineteen national parks managed by SANParks and the biomes in which they occur.

Quantifying resource use
Data were gathered using questionnaire-based interviews and correspondence with agency staff and scientists. Importantly, although the number of people involved in the completion of the questionnaire differed between parks (3 to 14, affected by differences in numbers of personnel employed in parks of different sizes and degrees of remoteness: larger, less remote parks employ more people), the participants included the persons most knowledgeable of resource use in each park and represent collective rather than individual contributions (van Wilgen et al. Reference van Wilgen, Dopolo, Symonds, Vermeulen, Bester, Smith and McGeoch2013). Respondents listed all known resources harvested within a particular park (based on permit records, agreements or knowledge of unauthorized use). For each listed resource respondents were required, where possible, to provide information on the parts used, purpose of use, authorization, user group and quantity (as well as monitoring thereof) of the harvested resource (for details of the approach and questionnaire see van Wilgen et al. Reference van Wilgen, Dopolo, Symonds, Vermeulen, Bester, Smith and McGeoch2013). Where data on quantities used were not available, participants were asked to estimate the quantity used and the accuracy associated with their estimate using three categories: estimate within 80% of true harvest; 50% (considered a ‘guestimate’); or true value unknown (van Wilgen et al. Reference van Wilgen, Dopolo, Symonds, Vermeulen, Bester, Smith and McGeoch2013). During collation of questionnaire responses, the identity and taxonomy of all resources recorded were cross-checked for accuracy against multiple published and online sources (including Encyclopedia of Life 2008; The Plant List 2010).
We recognize that the resulting suite of species identified with this approach is likely to be incomplete, particularly for unauthorized cases of resource use, for which information can be difficult to obtain (Petersen et al. Reference Petersen, Moll, Collins and Hockings2012). However, there is currently no alternative source of information and this approach provided a minimum estimate, constituting the most complete understanding of resource use across national parks in the country to date. It also provides a baseline for quantifying and addressing the knowledge and information gaps, which will require long-term investment in research and monitoring.
Data analysis
We investigated to what extent data on resource use per park, could be used to assess sustainability and to identify potential conservation risks. We considered only the indigenous biological resource subset of resources extracted per park (for a full checklist of biotic and abiotic resources used see van Wilgen et al. Reference van Wilgen, Dopolo, Symonds, Vermeulen, Bester, Smith and McGeoch2013). Resource use that occurred as an indirect consequence of management interventions such as post-clearing use of alien plants (for example for firewood) or the sale or culling of animals as part of population management actions was excluded from analysis. We assessed (1) the number and composition of species harvested per park, (2) information availability on harvest quantities, (3) regional similarity in harvest diversity, and (4) the global conservation status of harvested species using the International Union for the Conservation of Nature (IUCN) Red List (IUCN 2011), and national conservation status using existing evaluations (Supplementary material, Appendix 1). As an assessment of the relative completeness of available data, we compared the number of resources reported per park before and after conducting follow-up interviews (which took place one year after the initial survey in a subset of six national parks).
To compare the composition of terrestrial resources used across parks, non-metric multidimensional scaling (nMDS) was conducted on the matrix of resources used in each park (249 resources and 15 parks, excluding parks with no, or a single, resource use). Jaccard similarity indices from the resemblance matrices (calculated in PRIMER v6; Clarke & Gorley Reference Clarke and Gorley2006) were used to examine relative similarity between individual parks for both terrestrial parks and MPAs. Similarity percentages (SIMPER) based on Bray Curtis similarity indices were used to examine similarity in terrestrial resource use composition within and between biomes (Clarke & Warwick Reference Clarke and Warwick2001). We expected parks in close proximity to each other, and those in the same vegetation biome, to be most similar to each other in resource use composition. Canonical correspondence analysis (CANOCO v 4.5, ter Braak & Smilauer Reference ter Braak and Smilauer2002) was used to examine the role of park area (log10 km2) and human population density surrounding the park (total density (log10) across bordering quarter degree grid cells; Stats SA Reference Stats1996) on resource use composition.
RESULTS
Diversity of species harvested
The biological resources used across the national park estate are taxonomically diverse, totalling 341 species or species groups, including 178 woody and herbaceous plant species, mushrooms (not identified to species level), two seaweed species, as well as 160 animals. The last group included 37 terrestrial, freshwater and marine invertebrates, four freshwater and 57 marine fish, 11 birds, 33 mammals and 18 reptiles (Supplementary material, Appendix 1). However, species identity was unclear or unknown for many of these resources (78 or 23%), meaning that assessments of sustainable thresholds and harvest impact on conservation status are not possible at present for close to a quarter of the species involved.
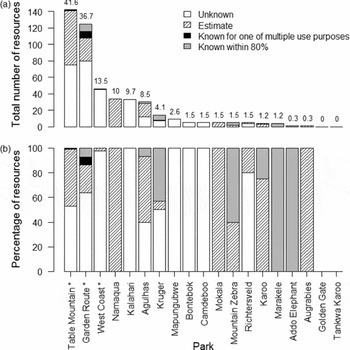
The highest richness of harvested resources was reported from parks that included MPAs (104.3 ± 29.6 SE; Fig. 2 a), compared to parks with no MPA (9.65 ± 2.9 SE). Two parks reported no use of indigenous biological resources (Fig. 2 a). Follow-up of questionnaires in six other parks suggested that further investigation would likely reveal more harvested species, with parks where follow-up was conducted identifying additional resources in all cases (mean difference before and after follow-up = 29 ± 13 SE resources), although the number of resources used in parks where follow-up was conducted was no different to the other parks (t = –2.1, p = 0.08, n = 6). Park size and human population density both provided a significant positive contribution to explaining the composition of resources used across terrestrial parks (together explaining 16.7% of the variation in resource composition across parks, F = 1.21, p = 0.05; Supplementary material, Appendix 2).
(a) The number of biological resources harvested per park, indicating the number of resources for which estimates of harvest quantities were possible. Percentages of total resources per park numbered above each bar (note values sum to > 100 because some resources are harvested in multiple parks). Parks are ordered by total harvested resources and names with an asterisk are those parks that include marine protected areas. Estimates of harvest quantity were split into four categories, (1) unknown = no estimate possible; (2) guesstimate = a rough estimate or a range of likely harvest quantities was provided; (3) known within 80% = estimates of harvest quantity were made with 80% perceived accuracy; and (4) known for one of multiple uses = harvest quantities were known for one use purpose, but use of the same species for an additional purpose(s) was not monitored or unknown. (b) The same information on harvest quantities expressed as a percentage of the total number of resources harvested from each national park.

Most species were harvested for use in traditional medicine or rituals (39% of all resources) or for food (38%; Supplementary material, Appendix 2), and many were harvested without authorization. Only 17% of species were harvested with authorization in all instances, while authorization was obtained for a further 35% in some instances, parks or seasons (Supplementary material, Appendix 3). Half of the legitimately harvested species were marine, while plants harvested in two parks (Kalahari and Garden Route; mainly for medicinal use and timber, respectively) accounted for an additional 26% of legally harvested resources. Seven parks reported no unauthorized resource use, and reported mainly resources for which accurate harvest quantities could be provided.
Quantities of resources harvested
Returned questionnaires contained significant gaps in information on the quantities of resources harvested from national parks. Of the 341 resources, the quantity used was not known in 62% of cases in at least one park, while quantities were known for only 7.6% of resources used (namely within 80–100% of true harvest, as specified by the questionnaire) for all use purposes in at least one park (Fig. 2). Ten parks were not in a position to provide accurate estimates of harvest quantities for any resources, although six of the 10 provided estimates (within 50% accuracy) of harvest quantities for most resources (Fig. 2 b).
Although empirical data were not available, questionnaire responses indicated that for certain resources use is known to be isolated or sporadic (for example Ludwig's bustard, Neotis ludwigii or aardvark, Orycteropus afer), whereas the use of others is locally more extensive and regular (for example sour figs, Carpobrotus edulis, and many of the more common marine species, such as blacktail, Diplodus sargus capensis). The resources for which use quantities were known included, for example, timber harvests from one park, the number of rhinoceros poached from another, and resources harvested for park staff use, such as wild fruit (milk plum, Englerophytum magalismontanum).
Similarity of resources used across parks
Most resources (74%) were used in only a single park, with 17% used from two and 8% from three parks. Although we did not assess within-park spatial extent of resource use, this localized distribution of use between parks suggests low risk to widespread species. Kudu (Tragelaphus strepsiceros), grazing for domestic animals, honey (from Apis mellifera) and porcupines (Hystrix africaeaustralis) were most widely used and yet were only used in four or five of the 19 parks. As a result, resource use was very different across parks, with a maximum Jaccard similarity (JSI) of 25–29% between parks in the Nama Karoo biome, and 21% between two parks in the Savannah biome (Supplementary material, Appendix 2; for biomes see Fig. 1 and Table 1). Even within biomes, parks were generally very different from each other with < 10% similarity between parks within the Fynbos, Savannah and Succulent Karoo biomes, although the marine resources used across the three parks with MPAs were on average more similar (27–44% JSI) than their terrestrial counterparts.
Conservation status of species harvested
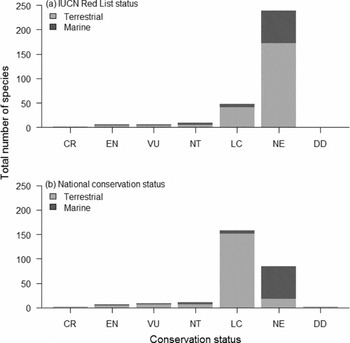
Of the species harvested (that were identified to species level), only the black rhinoceros, Diceros bicornis minor is critically endangered (CR), while six of the harvested species are endangered and six vulnerable (VU, Fig. 3; Supplementary material, Appendix 1). At a national level, two species had a conservation status of CR (Wild ginger Siphonochilis aethiopicus and the black rhinoceros), while most (156) were of least concern (Supplementary material, Appendix 1). However, while not many harvested species were threatened, most harvested species (78%) have not been evaluated (NE) for the IUCN Red List (Fig. 3; Supplementary material, Appendix 1). Although more species have been assessed nationally than internationally, the percentage of species not yet evaluated at a national scale remained high (31%, not counting the 60 species for which conservation status could not be determined due to taxonomic uncertainty; Fig. 3); 81% of these species without a national conservation status were marine. Overall, 83% of identifiable harvested marine species (n = 83) had no national or IUCN conservation status.
(a) IUCN Red List status and (b) national conservation status of terrestrial and marine species known to be harvested within national parks: CR = critically endangered; EN = endangered; VU = vulnerable; NT = near threatened; LC = least concern; NE = not evaluated; DD = data deficient (IUCN 2012). The following species categorizations are not shown: Declining (a national status); taxa that could not be identified to species level; non-biological resources that are not assigned conservation status and hybrids.

Threatened species harvested without authorization are of particular management concern. Twenty-eight nationally threatened species (VU–CR) and 13 IUCN Red List threatened species were harvested without authorization, or in contravention of permitted harvest quantities or seasons. These species included the black rhinoceros, white rhinoceros (Ceratotherium simum simum), pepperbark tree (Warburgia salutaris), geometric tortoise (Psammobates geometricus) and the great white shark (Carcharodon carcharias) (Supplementary material, Appendix 1). Another group of species that should be prioritized for monitoring and management action are those where harvest is permissible, but where species conservation status has not been evaluated. Such cases, where essentially an unknown stock is being harvested, accounted for 135 (40% of) species. The majority (51%) of these NE species were marine (including species of shellfish, seaweed and fish) and could be fished in certain MPA zones. Although we do not have information on the basis on which harvesting of these resources was permitted, we suggest that in most cases it was likely the combined demand for the resource along with a perceived lack of risk or impact to the conservation status of the species involved; decisions for marine species quotas are made nationally and not by park authorities. A further 11 permissibly harvested species (including black stinkwood, Ocotea bullata, and three species of tuna, genus Thunnus) are listed as threatened or near threatened on the IUCN Red List and 12 are threatened nationally (Supplementary material, Appendix 1).
DISCUSSION
Our survey revealed widespread demand for a diversity of resources from national parks across the country, involving at least 340 species. Although there were few similarities in species targeted across parks, most species were harvested for the purposes of food and medicine. As one of the first assessments of the full suite of exploited resources across a national park network, this study demonstrates that these high priority conservation areas are clearly in demand for provisioning ecosystem services. Perhaps most importantly, the significant knowledge gaps found exposed absence of empirical information, especially on the volumes and conservation status of species being harvested, as a potential risk to PA ecological performance. This lack of data precludes assessment of harvest sustainability. For example, in the marine environment, although some metrics do exist to assess commercial fish stocks (Hutchings et al. Reference Hutchings, Augustyn, Cockcroft, Van der Lingen, Coetzee, Leslie, Tarr, Oosthuizen, Lipinski and Roberts2009), there are no comprehensive assessments for individual species that include the full range of methods by which they are harvested (for example subsistence through recreational and commercial fishing using shore-based, trek net and trawl methods).
Diversity and quantity of harvested resources
Despite good reporting by some parks, several harvested species may still have been overlooked. Ad hoc comments from multiple sources suggest that numerous additional plant species, for example grasses and reeds, not reported during the course of our assessment, are being harvested. Furthermore, there was only a 20% overlap between species reported as harvested for Table Mountain National Park and a detailed market and user-based study including the broader Cape Town area (Petersen et al. Reference Petersen, Moll, Collins and Hockings2012). Similarly, only four medicinal plants were reported harvested in the Kruger National Park, but Botha et al. (Reference Botha, Witkowski and Shackleton2001) identified over 200 medicinal plants being sold in local markets along the western boundary of this Park. While the origin of these plants is uncertain and most would likely be sourced outside of the park (including in other countries such as Swaziland; Botha et al. Reference Botha, Witkowski and Shackleton2001), the parks may provide an alternate (or future) source in instances where these resources are, or become, scarce outside of PAs.
There may have been some reluctance to report on illegal activities in certain parks. Seven parks reported no unauthorized resource use, and mainly resources for which accurate harvest quantities could be provided. While little unauthorized use may be true for very isolated parks, it is likely that some resource extraction takes place in all parks. During collation of the information there was resistance in some cases to the idea that unauthorized resource use might take place within park boundaries, while in other cases the perspective expressed was that because use was illegal, it did not happen. While park staff might be reluctant to report on illegal use for fear that it could be perceived as ineffective management, acknowledging the potential existence of illegal resource extraction is necessary to motivate for adequate intelligence, law enforcement, research and monitoring in support of such conclusions, or alternatively in support of sustainable solutions.
Improving information on resource use, especially quantities and unauthorized extraction of resources from PAs will require investment in a range of approaches, including in-field data collection and marketplace surveys (Botha et al. Reference Botha, Witkowski and Shackleton2004; Moeng & Potgieter Reference Moeng and Potgieter2011), and is an important priority for PAs to ensure their performance. This type of information will become increasingly important under conditions of human population growth (including immigration and the formation of increasingly multicultural communities, with diverse needs and practices; see for example Petersen et al. Reference Petersen, Charman, Moll, Collins and Hockings2014), high unemployment and poverty (Stats SA 2012), and as resources become increasingly scarce outside of PAs (see Greve et al. Reference Greve, Chown, van Rensburg, Dallimer and Gaston2011). These results provide an important basis for prioritizing research and monitoring investment in specific species and particular national parks in South Africa.
Context dependence of resource use
Despite low similarity in the species used across parks and biomes, risks could be high for species with narrow geographic ranges, especially where individuals are killed or removed in entirety (such as many of the bulbs harvested from endemic species in the Fynbos or the pepper-bark tree, Warburgia salutaris, in Kruger, which has a limited distribution and dies when ring-barked: Scheepers et al. Reference Scheepers, Swemmer and Vermeulen2011). In addition, park size and human population density were found to contribute to explaining the composition of resources used across terrestrial parks. This suggests that species with ranges associated with high human density face the highest harvest pressure (see also Spear et al. Reference Spear, Foxcroft, Bezuidenhout and McGeoch2013). The issue of high human density is most pertinent in urban and open-access PAs like Table Mountain National Park, where the PA is accessible and the surrounding city offers a ready market for multiple products (Petersen et al. Reference Petersen, Moll, Collins and Hockings2012). The urban context also provides incentive for the harvest of non-subsistence resources like ornamental plants (Supplementary material, Appendix 2), many of which have high market value (Reinten et al. Reference Reinten, Coetzee and van Wyk2011). Together with the significant biological differences between and even within biomes, these differences in socioeconomic and development contexts across individual parks most likely explain the differences in resource use across them.
Conservation status
The conservation status of species can be used as a surrogate for potential harvest impact and risk to individual species (Almond et al. Reference Almond, Butchart, Oldfield, McRae, de Bie, Collen, Pettorelli, Baillie, Durant, Almond, Butchart, Oldfield, McRae and de Bie2013). If tracked over time across the entire range of a species this might also provide insight into the extent of harvest and associated pressures. Indeed, in the absence of population level information or adequate investment in monitoring (Tunley Reference Tunley2009; Pereira et al. Reference Pereira, Leadley, Proenca, Alkemade, Scharlemann, Fernandez-Manjarres, Araujo, Balvanera, Biggs and Cheung2010; McGeoch et al. Reference McGeoch, Dopolo, Novellie, Hendricks, Freitag, Ferreira, Grant, Kruger, Bezuidenhout and Randall2011), the IUCN Red List and national conservation status assessments are often the only means of assessing species-level risk.
Threatened species harvested without authorization, as well as those harvested species with no conservation status information, should be seen as priority species for targeted surveillance and appropriate management interventions. A number of well-known and high profile threatened species currently have monitoring and/or management programmes in place, for example the large-scale anti-rhino-poaching efforts in Kruger, nursery propagation of the endangered pepperbark trees in conjunction with local traditional healers (Scheepers et al. Reference Scheepers, Swemmer and Vermeulen2011), and the application of stringent protocols for timber harvests where these take place in the Garden Route (Seydack et al. Reference Seydack, Vermeulen, Heyns, Durrheim, Vermeulen, Willems, Ferguson, Huisamen and Roth1995). However, given the large number of species without conservation status information, management needs to be expanded to encompass a broader range of species. Knowledge gaps are especially large in the marine sector (83% of species have no conservation status).
The international community relies heavily on indicators derived from the IUCN Red List to monitor progress towards meeting conservation targets (Butchart et al. Reference Butchart, Walpole, Collen, van Strien, Scharlemann, Almond, Baillie, Bomhard, Brown and Bruno2010), including monitoring the use of exploited species (see Almond et al. Reference Almond, Butchart, Oldfield, McRae, de Bie, Collen, Pettorelli, Baillie, Durant, Almond, Butchart, Oldfield, McRae and de Bie2013). If the status of harvested species is unknown, however, these metrics are of little value at national and local scales. This leaves virtually no information on which to base sustainability assessments or prioritize monitoring and management.
Current and future challenges
PAs are meant to protect biodiversity, but their ability to do so may be jeopardized by demands for access to resources in them. The ability to determine the level of this risk is compromised by significant knowledge gaps, and there is no way to determine how sustainable the current levels of resource use are. In a review of the contribution of Costa Rica's PAs to poverty alleviation and reduction in deforestation (both of which were intended to benefit from the management of the system of parks), Ferraro and Hanauer (Reference Ferraro and Hanauer2011) concluded that wins for both social and biodiversity objectives would only be realized if stakeholders were satisfied with low levels of the desired outcome for each objective. Further, trade-offs would be required if higher outcomes of either were desired. Given the mandate of most PAs, it is unlikely that low levels of either biodiversity or social outcomes would be an acceptable solution. Social and biodiversity targets must be more clearly defined, and evaluated to assess whether these targets are mutually achievable, and at what cost. Increased emphasis on the monitoring and management of resource use by protected area authorities is essential.
These problems are not unique to South Africa or to national parks more broadly. Detailed information on the identity, extent and demand for resources in PAs is considered to be poor for PAs worldwide (Kremen Reference Kremen2005; Mascia & Pailler Reference Mascia and Pailler2011), while shifts in resource use, although often driven by policy change in line with more socially inclusive PA objectives, often simply exceed the management capacity to deal with them (Naughton-Treves et al. Reference Naughton-Treves, Alvarez-Berr, Brandon, Bruner, Holland, Ponce, Saenz, Suarez and Treves2006). Globally, populations of terrestrial vertebrates used by humans (for any purpose) have declined on average by 15% since 1970 as a consequence of multiple factors, and the proportion of overexploited global fish stocks has increased significantly (Butchart et al. Reference Butchart, Walpole, Collen, van Strien, Scharlemann, Almond, Baillie, Bomhard, Brown and Bruno2010). There is also increasing evidence of illegal use and under-reporting under the guise of legitimate and reported management and harvesting activities (Pala Reference Pala2013; Nellemann Reference Nellemann2012). To date, the use of experience rather than evidence-based knowledge to support decision making in PAs has been common (Cook & Hockings Reference Cook and Hockings2011). However, given a rapidly changing environment under climate change (Gillson et al. Reference Gillson, Dawson, Jack and McGeoch2013), biological invasion (Spear et al. Reference Spear, Foxcroft, Bezuidenhout and McGeoch2013) and the movement of people responding to and driving these changes, past experience will not be an adequate to manage future resource use demands or ensure environmental resilience.
Protected areas in South Africa and elsewhere face ongoing pressure to manage and balance people-based conservation outcomes (including provisioning and cultural services and tourism) with PA ecological performance (Holmes-Watts & Watts Reference Holmes-Watts and Watts2008). Evidence is growing that this balance of PA performance and direct human benefit is an unrealistic objective in many parts of the world (Ferraro & Hanauer Reference Ferraro and Hanauer2011; Laurance et al. Reference Laurance, Useche, Rendeiro, Kalka, Bradshaw, Sloan, Laurance, Campbell, Abernethy and Alvarez2012). This is particularly true in rapidly developing regions with an imbalance between demand and supply of resources and insufficient information to effectively manage the development transition. Whereas investment in PA expansion has significant conservation benefits, the return on this investment may not have the desired positive impacts if not matched by increased support for evidence-based management (Wintle et al. Reference Wintle, Bekessy, Keith, van Wilgen, Cabeza, Schroeder, Carvalho, Falcucci, Maiorano and Regan2011). Managing PA areas into the future will require careful consideration of the trade-offs between investing in PA expansion and increasing management capacity and the knowledge foundation to ensure ecological performance.
Supplementary material
To view supplementary material for this article, http://dx.doi.org/10.1017/S0376892914000320.
ACKNOWLEDGEMENTS
We thank the SANParks park managers and regional ecologists, Alexis Symonds, Kyle Smith, Mbulelo Dopolo, Wessel Vermeulen, Elzette Bester, Louise Swemmer, Leif Petersen and Wendy Annecke for valuable comments and assistance, as well as Carly Cook, Brian van Wilgen and three anonymous referees for comments on an earlier version of this manuscript. This work was supported by SANParks and the Andrew W. Mellon Foundation.