


I. INTRODUCTION
Characterization of the interface in multilayer structures is of prime importance in many applications, such as microelectronics. X-ray reflectometry is often used for the estimation of the surface and interface roughness as well as the thickness of each layer (Parratt, Reference Parratt1954; Nevot and Croce, Reference Nevot and Croce1980; Sinha et al., Reference Sinha, Sirota, Garoff and Stanley1988; Holy et al., Reference Holy, Kubena, Ohlidal, Lischka and Plotz1993; Daillant and Gibaud, Reference Daillant and Gibaud1999; Fujii et al., Reference Fujii, Nakayama and Yoshida2004, Reference Fujii, Komai and Ikeda2005; Fujii, Reference Fujii2010, Reference Fujii2011, Reference Fujii2013). In the X-ray reflectivity (XRR) analysis, the reflectivity is usually calculated based on the Parratt formalism (Parratt, Reference Parratt1954), coupled with the use of the theory of Nevot and Croce to include the effect of surface and interface roughness (Nevot and Croce, Reference Nevot and Croce1980). However, XRR simulations that are calculated in this way sometimes show strange results. The calculated amplitude of the oscillation, which originates from the interference effects, increases with increasing surface roughness in some cases. This strange behavior suggests that the method used to incorporate the effect of surface and interface roughness into the Parratt formalism is not adequate. Actually, we have recently demonstrated that the diffuse scattering at the interface is not correctly taken into account in the conventional formula (Fujii, Reference Fujii2010, Reference Fujii2011, Reference Fujii2013). For precise measurements, correction of the conventional formula is required. In order to derive a more accurate formalism of XRR, we measured the surface roughness of the same sample by atomic force microscopy (AFM) and XRR, and compared the results of the measurements.
II. EXPERIMENTAL AND RESULTS
A. Sample preparation
Two samples of silicon wafers having a thin SiO2 layer were prepared by the following methods. Sample A was prepared by thermal oxidizing of a Si(001) wafer. The thickness of the prepared SiO2 layer is about 5 nm. Sample B was prepared by vacuum deposition of an additional SiO2 layer of about 2 nm onto sample A at room temperature. The roughness of the SiO2/Si interface for sample B is expected to be the same as sample A although the surface roughness should be increased after the deposition. The surfaces of these samples were measured by XRR and AFM.
B. XRR measurement
XRR measurements were performed using a CuKα1 X-ray beam from a 3 kW rotating-anode source. The beam size of the X-ray was about 2 mm (perpendicular to the reflection plane) × 0.05 mm (parallel to the reflection plane). The XRR results measured for samples A and B are shown as a function of the angle of incidence, θ i , by dashed curves in Figures 1(a) and 1(b), respectively. For θ i values smaller than the critical angle for total reflection (i.e. 0.22°), the reflectivity is almost unity. With increasing θ i over the critical angle, the reflectivity decreases and oscillatory structures are seen. These oscillations originate from the interference of X-rays reflected from the surface and the interface of the SiO2/Si. By analyzing the θ i -dependence of the reflectivity, the surface roughness, interface roughness, and the thickness of the SiO2 layer can be estimated.
(Color online) (a) XRR from sample A. The experimental result (thick dashed curve) is compared with the calculated ones for σ i = 0.42 nm and various σ s (thin curves). (b) XRR from sample B. The experimental result (thick dashed curve) is compared with the calculated ones for σ i = 0.42 nm and various σ s (thin curves).

C. AFM observation
The surfaces of samples A and B were observed by AFM. Figures 2(a) and 2(b) show the AFM images and the roughness profiles of samples A and B, respectively. The r.m.s. surface roughness (σ s ) at the area of 1 × 1 µm2 of the SiO2 surfaces of samples A and B in Figures 2(a) and 2(b) were both about 0.17 nm, and those over an area of 10 × 10 µm2 in Figures 2(c) and 2(d) were both about 0.24 nm. AFM observation shows that changes in surface roughness before and after vapor deposition of SiO2 were negligible.
(Color online) (a) AFM image and the roughness profile of sample A (in the area of 1 µm2). (b) AFM image and the roughness profile of sample B (in the area of 1 µm2). (c) AFM image and the roughness profile of sample A (in the area of 10 µm2). (d) AFM image and the roughness profile of sample B (in the area of 10 µm2).

III. DISCUSSION
In the conventional XRR analysis, the reflectivity is calculated based on the Parratt formalism (Parratt, Reference Parratt1954), incorporating the effect of the interface roughness according to the theory of Nevot and Croce (Reference Nevot and Croce1980). Recently, we have found that, in some cases the surface and interfacial roughness derived using this conventional formula are not consistent with those measured by transmission electron microscope (TEM) (Fujii, Reference Fujii2010, Reference Fujii2011). We also found that, in some cases the conventional formula gives strange results when the interface roughness increases, i.e. the amplitude of the oscillation becomes larger with increasing interface roughness (Fujii, Reference Fujii2010, Reference Fujii2011, Reference Fujii2013). This is strange because the interference of X-rays reflected from the surface and interface should be weaker with increasing roughness. These results were attributed to the fact that the diffuse scattering at the rough interface was not correctly taken into account in the conventional formula by Nevot and Croce. Therefore, we have developed a new formula in which the effects of the surface and interface roughness are correctly treated (Fujii, Reference Fujii2010, Reference Fujii2011, Reference Fujii2013). The XRR R of a multilayer sample consisting of N layers is given by:
 $$\eqalign{& R={\left\vert {{R_{0\comma 1}}} \right\vert ^2}\comma \; \; \cr & {R_{\,j - 1\comma j}}=\displaystyle{{{\Psi _{\,j - 1\comma j}}+\left({{\Phi _{\,j - 1\comma \;j}}{\Phi _{\,j\comma \;j - 1}} - {\Psi _{\,j - 1\comma \;j}}{\Psi _{\,j\comma j - 1}}} \right){R_{\,j\comma \;j+1}}} \over {1 - {\Psi _{\,j\comma \;j - 1}}{R_{\,j\comma \;j+1}}}} \cr & \quad \quad \quad \times\exp \left({2i{k_{\,j - 1\comma z}}{h_{\,j - 1}}} \right)\comma \; {R_{N\comma N+1}}=0}$$
where R j−1, j is the reflection coefficient at the interface between j−1th layer and jth layer, h j is the thickness of the jth layer, h 0 = 0, k j,z is the z component of the wave vector in the jth layer, and Ψ j−1, j and Φ j−1, j are the Fresnel coefficients for reflection and refraction, respectively, at the interface between the (j − 1) th layer and the jth layer. Although the formula for Ψ j−1, j is well known:
 $$\eqalign{& {\Psi _{\,j - 1\comma \,j}}=\displaystyle{{{k_{\,j - 1\comma z}} - {k_{\,j\comma z}}} \over {{k_{\,j - 1\comma z}}+{k_{\,j\comma z}}}}\exp \left({ - 2{k_{\,j - 1\comma z}}{k_{\,j\comma z}}{\sigma _{\,j - 1\comma j}}^2 } \right)\comma \; \; \cr & {\Psi _{\,j\comma \;j - 1}}=- {\Psi _{\,j - 1\comma j}}}$$
where σ j−1, j is the interface roughness between (j − 1) th and jth layers, an accurate analytical formula for Φ j−1, j including the effect of the interface roughness is not available. There are several approximations proposed for Φ j−1, j and all these results can be written as:
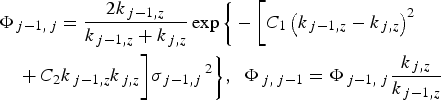 $$\eqalign{& \Phi _{\,j - 1\comma \,j} = \displaystyle{{2k_{\,j - 1\comma z} \over k_{\,j - 1\comma z}+ k_{\,j\comma z}}} \exp \bigg\{ - \bigg[C_1 \left( k_{\,j - 1\comma z} - k_{\,j\comma z} \right)^2 \cr & \quad +C_{2}k_{\,j - 1\comma z} k_{\,j\comma z} \bigg] \sigma_{\,j - 1\comma j}\,^2 \bigg\}\comma \; \; \Phi _{\,j\comma \;j - 1} = \Phi _{\,j - 1\comma \;j} \displaystyle{k_{\,j\comma z} \over k_{\,j - 1\comma z}}}$$
where parameters C 1, C 2 depend on the proposed approximation (Vidal and Vincent, Reference Vidal and Vincent1984; Sinha et al., Reference Sinha, Sirota, Garoff and Stanley1988; Holy et al., Reference Holy, Kubena, Ohlidal, Lischka and Plotz1993, Reference Holy, Pietsch and Baumbach1999; Boer, Reference Boer1995; Daillant and Gibaud, Reference Daillant and Gibaud1999; Fujii et al., Reference Fujii, Nakayama and Yoshida2004, Reference Fujii, Komai and Ikeda2005; Sakurai, Reference Sakurai2009; Fujii, Reference Fujii2010, Reference Fujii2011, Reference Fujii2013). In the present work, we choose C 1 = 1 and C 2 = 0, which, we believe, is the most appropriate approximation (Fujii, Reference Fujii2010, Reference Fujii2011, Reference Fujii2013).
As was mentioned above, the origin of the oscillation is the interference between the X-rays reflected from the surface and the interface. Thus the thickness of the SiO2 layer can be determined from the observed period of the oscillation. The degree of the decrease in the XRR for angles larger than the total reflection critical angle is strongly related to the surface roughness. The detailed procedure to derive the layer thickness from the observed period of the oscillation can be found in the literature (Parratt, Reference Parratt1954).
After analyzing the XRR results with the above procedure, the SiO2 layer profiles of sample A were derived. The thickness of the SiO2 layer was determined to be 5.3 nm. Using Eqs (1) and (3), the reflectivity was calculated with various values of surface roughness σ s , where the sample was treated as three layers (vacuum/SiO2/Si). The calculated results are compared with the experimental one in Figure 1(a).
When σ s is increased the calculated reflectivity decreases more rapidly with θ i . This indicates that the surface roughness can be accurately determined by comparing the θ i -dependence of the calculated results with the experimental one. The best fit was obtained using a surface roughness of 0.52 nm. We also modeled the interface roughness by fitting the calculated reflectivity to the observed reflectivity. The best fit was obtained using an interface roughness value of 0.42 nm for sample A.
The calculated reflectivity for a surface roughness of σ s = 0.52 nm and interface roughness of σ i = 0.42 nm is shown by a solid line in Figure 1(a). The agreement with the experimental result is very good. It should be noted that we cannot obtain good agreement if we use other values for C 1 and C 2, such as (C 1, C 2) = (0.5, 0), (−0.5, 0), proposed in the literatures (Holy et al., Reference Holy, Kubena, Ohlidal, Lischka and Plotz1993, Reference Holy, Pietsch and Baumbach1999; Boer, Reference Boer1995; Daillant and Gibaud, Reference Daillant and Gibaud1999; Fujii, Reference Fujii2010, Reference Fujii2011). Our analysis indicates that (C 1, C 2) = (1, 0) is the most reliable among the proposed values.
A similar procedure was applied to analyze the XRR data of sample B. From the period of the oscillation, the thickness of the SiO2 layer was determined to be 7.8 nm. Using Eqs. (1)–(3), the reflectivity was calculated with various values of σ s . Some examples of the calculated results are compared with the experimental one in Figure 1(b). Because the deposition of the additional SiO2 layer of 2 nm does not change the interface roughness, we used the interface roughness determined for the sample A (σ i = 0.42 nm) in the estimation of the surface roughness of the sample B. Using these values (σ i = 0.42 nm and the thickness 7.8 nm), the reflectivity was calculated for various values of surface roughness σ s . Figure 1(b) shows the comparison between the calculated and experimental results. In contrast to sample A, none of the calculated results can reproduce the experimental one. At θ i > 1.0° the calculated result for σ s = 0.54 nm agrees with the experimental one, while the calculated result deviates from the experimental one at smaller θ i . Conversely, the calculated result for σ s = 1.08 nm agrees with the experimental one at smaller θ i , but it deviates seriously at higher θ i . A possible explanation of the present discrepancy may be that the effective surface roughness measured by XRR depends on the size of the effective probing area on the surface, which is proportional to 1/sinθ i . In general, the surface roughness increases with increasing size of the probing area. As a result, the effective roughness observed at smaller θ i is larger than that at larger θ i in accordance with the present result. Such a θ i -dependence of the effective roughness in XRR has been usually neglected. The present result, however, indicates that it should be taken into account in cases such as sample B, of which the effective roughness depends on the size of the probing area.
Assuming the effective roughness is mainly dictated by refraction Fresnel coefficients, we can account for the incident angle dependence of roughness in XRR simulation via the following new formula for Φ j−1, j as,
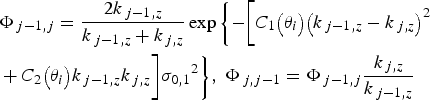 $$\eqalign{& {\Phi _{\,j - 1\comma j}}=\displaystyle{{2{k_{\,j - 1\comma z}}} \over {{k_{\,j - 1\comma z}}+{k_{\,j\comma z}}}} \exp \bigg\{{ - \bigg[{{C_1}\big({{\theta _i}} \big){{\big({{k_{\,j - 1\comma z}} - {k_{\,j\comma z}}} \big)}^2}}}\cr & +{C_2}\big({{\theta _i}} \big){k_{\,j - 1\comma z}}{k_{\,j\comma z} \bigg]{\sigma _{0\comma 1}}^2 } \bigg\}\comma \; {\Phi _{\,j\comma j - 1}}={\Phi _{\,j - 1\comma j}}\displaystyle{{{k_{\,j\comma z}}} \over {{k_{\,j - 1\comma z}}}}}$$
where the parameters C 1(θ i ), C 2(θ i ) depend on the incident angle θ i and play the role of effective parameters for the effective roughness term depending on the incident angle. We typically derive C 1(θ i ), C 2(θ i ) via fitting of experimental results. However, the value of the parameter C 1, C 2 may depend on the structure of the two planes that both run parallel to the surface but which bisect the surface roughness and the interface roughness variability, respectively. More analysis is needed to fully elucidate the details of this new model and its parameters.
From AFM observations, the surface roughness σ s of the SiO2 surfaces of both samples A and B was estimated as 0.17 nm at the area of 1 × 1 µm2 and 0.24 nm at the area of 10 × 10 µm2. These results are different from the XRR analysis. The surface roughness values estimated from AFM observation show smaller values than those of XRR. Likewise, surface roughness σ s are smaller for a probe area of 1 × 1 µm2 than for the area of 10 × 10 µm2. This suggests that the value of determined roughness depends on the size of the area probed and may be different in the XRR measurements. In XRR measurements, the area probed changes with incidence angle. The footprint is large at low angles of incidence, thereby probing a larger area of sample. The area probed shrinks quickly as the incidence angle is raised. The angular dependence of surface roughness because of probe dimensions is a concept that has perhaps been overlooked in modeling of reflectivity data.
IV. CONCLUSION
The surface and interface roughness of SiO2/Si(001) were measured using XRR and AFM. In a new improved XRR formalism, we could not reproduce the observed reflectivity using a constant roughness value that is invariant of the incident angle. AFM results suggested the need of the introduction of the effective roughness term that depends on the incident angle for XRR calculation, thus demonstrating that effective roughness depends on the size of the probing area. This should be taken into account for precise XRR analysis. And it is thought that the value of the parameters C 1, C 2 of refraction Fresnel coefficients depends on the structure of a parallel direction on the surface roughness and the interface roughness. Therefore, the investigation about many samples will be necessary in future. We will continue to refine this theory.



