

Introduction
The mass balance of the Antarctic ice sheet has been one of the main interests of the scientific community because the cryosphere integrates climate variations over a wide range of time scales, making it a natural sensor of climate variability and providing a visible expression of climate change (Jacka and others Reference Jacka2004). The mass balance of the Antarctic ice sheet has been investigated based on three different methods. The mass budget approach compares snow accumulation to ice flow output from the grounded ice sheet (for example Yu and others Reference Yu, Liu, Jezek, Warner and Wen2010). Monitoring changes in surface elevation by employing airborne/satellite laser and radar altimetry data provides mass balance and accumulation at a continental scale (for example Davis and others Reference Davis, Li, McConnell, Frey and Hanna2005). Additionally, determination of the temporal changes in gravity based on satellite data provides an alternative indication of the mass balance of the Antarctic ice sheet (for example Chen and others Reference Chen, Wilson, Blankenship and Tapley2006).
Areas of blue ice, commonly called blue ice areas (BIAs hereafter) by previous studies (for example Bintanja Reference Bintanja1999 and Orheim and Lucchitta Reference Orheim and Lucchitta1990), are interpreted as areas of exposed ice where the surface mass balance is negative by sublimation with a relatively low surface albedo (Bintanja Reference Bintanja1999). The possible use of BIAs as indicators of climate change was introduced by Orheim and Lucchitta (Reference Orheim and Lucchitta1990). They used two optical satellite images to monitor spatial changes in BIAs around Dronning Maud Land during a two year period. They were able to express the potential relationship between the decrease of extent and the increase of accumulation. However, Bintanja and Van den Broeke (Reference Bintanja and Van Den Broeke1995) identified a relatively stable extent of BIAs related to local climate changes for a BIA located near nunataks in Dronning Maud Land based on field surveys. It was also confirmed by Sinisalo and others (Reference Sinisalo, Moore, Van De Wal, Bintanja and Jonsson2003) that BIAs are relatively stable compared to changes in rate of accumulation and possibly temperature, based on 14 years of stake monitoring of the ablation/accumulation rate and the spatial extent of BIAs in Scharffenbergbotnen, Donning Maud Land. On the other hand, Brown and Scambos (Reference Brown and Scambos2004), employing MODIS and Landsat data, studied seasonal and interannual changes of BIAs for three sites located near Byrd Glacier and concluded that BIAs can be climate sensitive when situated on a low slope and with few nearby nunataks, which provide increased climate sensitivity. Recently, GPS measurements obtained between 1996 and 2006 at Horseshoe Valley showed large interannual variability in areas with no clear multiyear trends (Wendt and others Reference Wendt, Casassa, Rivera and Wendt2009).
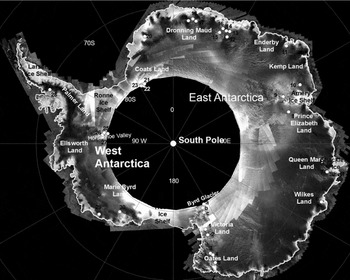
Although substantial studies investigated BIAs as climate indicators, both the stable extent of BIAs (Bintanja and Van den Broeke Reference Bintanja and Van Den Broeke1995; Bintanja Reference Bintanja1999; Sinisalo and others Reference Sinisalo, Moore, Van De Wal, Bintanja and Jonsson2003) and the variable extent of BIAs (Orheim and Lucchitta Reference Orheim and Lucchitta1990; Brown and Scambos Reference Brown and Scambos2004; Wendt and others Reference Wendt, Casassa, Rivera and Wendt2009) are suggested to be related to climate change. Unfortunately, the study sites are limited to a few locations of Antarctica, and a lack of quantitative analysis comparing the temporal changes of BIAs as related to surface mass balance is apparent. The relationship between temporal variations in extent of BIAs and surface mass balance is unclear. This present study investigates 33 BIA sites, including three sites from previous studies (Fig. 1) (Brown and Scambos Reference Brown and Scambos2004), that are distributed over both west and east Antarctica to determine if temporal variations in extent of BIAs are related to surface mass balance using Landsat TM/ETM+ images and radar altimetry based elevation change data (Davies and others Reference Davis, Li, McConnell, Frey and Hanna2005). Additionally, topographic parameters of BIA occurrence such as elevation, slope, and proximity of nunataks, which may control the occurrence of BIAs, are analysed to identify favorable BIA settings for climate change studies.
Location map of study sites overlaid on SAR image mosaic of Antarctica.

Study area and data
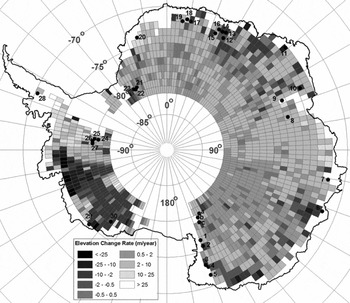
One of the commonly used mass balance measurements, as was briefly mentioned, is the measurement of elevation change by altimetry. Employing ERS-1 and ERS-2 satellite radar altimeter data, Davis and others (Reference Davis, Li, McConnell, Frey and Hanna2005) measured elevation change for 70% of the grounded Antarctic ice sheet from 1992 to 2003. With the correction for isostatic uplift, measurements of ice elevation change from continuous or repeat altimeter surveys provide a direct measure of net mass change (Davis and others Reference Davis, Li, McConnell, Frey and Hanna2005). Based on time series of monthly elevation change averages and an autoregressive model on a long-term trend, the authors estimated the average elevation change (dH/dt) during the 11-year period for the Antarctic ice sheet interior north of 81.6o S at 1o by 2o grid (latitude x longitude) (Fig. 2).
Thirty three study sites of temporal variations in blue ice area extent change overlaid on 1992–2003 rates of elevation change (Davis and others Reference Davis, Li, McConnell, Frey and Hanna2005). Sites a, b, and c are referenced from Brown and Scambos (Reference Brown and Scambos2004).

Because the changes in ice sheet thickness control the existence of BIAs in mountainous areas (Bintanja Reference Bintanja1999), it is assumed if BIAs are sensitive to steady changes in regional elevation for periods of six to twelve years, there should be a noticeable correlation between the elevation change rate and changes in the BIA extent. This present study selected 30 BIA sites with easily identifiable boundaries based on the elevation change rate, geographic distribution, and availability of satellite images (Fig. 2). This study also included three sites from previous studies (Brown and Scambos Reference Brown and Scambos2004) for the analysis (Fig. 2). Of 33 study sites, 11 sites were selected based on the negative changes, for which the extents of BIAs are supposed to be increasing, and 22 sites were selected based on the positive change areas.
Previous studies clearly showed that large reductions in BIAs can occur quickly whereas the increase of a BIA can be expected to take a longer time (Bintanja Reference Bintanja1999; Brown and Scambos Reference Brown and Scambos2004). Because seasonal variations in extent of BIAs caused by snow accumulation events may be large and significant reductions may occur (Brown and Scambos Reference Brown and Scambos2004), the selection of satellite images acquired dates after a snow accumulation event may not satisfy the condition of monitoring steady changes in the mass balance. However, because of two conservative feedback processes of high absorption of solar radiation and a low snow drift transport rate over BIA surfaces (Bintanja Reference Bintanja1999; Bintanja Reference Bintanja2001), the temporary snow accumulation on a BIA can be removed over a longer term. Therefore, the author assumes that it is more appropriate to select satellite images showing the maximum extent for the steady response of BIAs over an elevation change. To satisfy this assumption, the author downloaded over 300 Landsat TM and ETM+ images acquired in austral summer with a maximum overlap of the time periods of the elevation change rate data (Davis and others Reference Davis, Li, McConnell, Frey and Hanna2005). Then, each Landsat image was visually inspected, and the most appropriate Landsat images showing a maximum BIA extent and minimal snow cover on rock exposures near BIAs were selected. As a result, the monitoring period of variations in BIA extent ranged from six to fifteen years (Table 1). The author makes the assumption that any previous elevation change trend before the altimetry measurements was overwritten by a long period (≥ 10 years) of overlap with the altimetry measurements. Additionally, the study sites monitored from 1996 were assumed to follow an 11 year trend of the change rate of elevation.
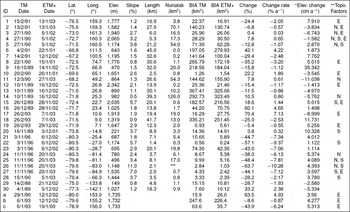
Landsat data acquisition dates, locations, topographic parameters, blue ice extents, percent changes, and elevation change rates of the BIA sites shown in Figure 1.

*Elevation change rate from 1992–2003 (Davis and others Reference Davis, Li, McConnell, Frey and Hanna2005); ** E-High elevation, S – High slope, N-High nunatak impact; *** Small patches in mountain area.
Topographic parameters such as elevation, slope, and proximity of nunataks play important roles in BIA formation and thus influence the response of BIAs to climate change (Bintanja Reference Bintanja1999; Bintanja and Van den Broeke Reference Bintanja and Van Den Broeke1995; Brown and Scambos Reference Brown and Scambos2004). Based on the ICESat digital elevation model (DiMazio 2005), topographic parameters such as elevation and slope were extracted for BIA study sites. The slope of BIAs was calculated based on the BIA topographic unit from the nunatak (if any) to the longitudinal extent of the BIA following a downwind direction. The elevation of the BIA study sites ranged from 149m to 2,342m, and 14 sites were located at elevations higher than 1,500m (Table 1). The slopes of the BIA study sites showed a distribution from 0.5% to 11%. A total of nine BIA study sites were located at a gradient higher than 3%, and the sites were used to represent samples of high slope BIAs in this study (Table 1).
The aerial extent of nunataks for each BIA study site was estimated based on Landsat ETM+ images. Comparing the length of the longitudinal extent of BIA topographic units and the area of nunataks responsible for the BIA occurrence, nine study sites were classified as nunatak impact sites, where the ratios between the length of the BIA topographic unit and the nunatak area were larger than 2km (Table 1). Based on the assertion by Brown and Scambos (Reference Brown and Scambos2004) that their study sites were located at low slopes and far from nunataks, the BIA sites of a, b, and c in Fig. 2 were classified as low slope and low nunatak impact study sites (Table 1).
BIAs, as a result of their low albedo compared to that of snow, can be extracted easily from optical satellite sensors (Winther and others Reference Winther, Jespersen and Liston2001). The spectral characteristics of BIAs are well known and described in Bronge (Reference Bronge1999) and Winther and others (Reference Winther, Jespersen and Liston2001). Moreover, the classification methods using Landsat images are explained in Bronge (Reference Bronge1999), Orheim and Lucchitta (Reference Orheim and Lucchitta1990), Winther and others (Reference Winther, Jespersen and Liston2001), and Brown and Scambos (Reference Brown and Scambos2004). The classification of Landsat images is beyond the scope of this study and is not discussed in this paper. This study combined spectral band ratio of Red/NIR (Bronge Reference Bronge1999) and supervised classification methods for BIA extraction from Landsat images with an additional two rounds of manual modification. The overall quality of image classification shows a kappa coefficient of 0.95.
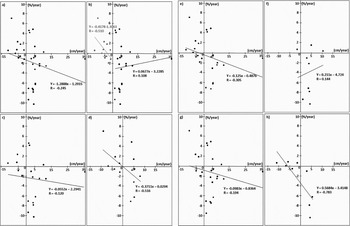
The extent of BIAs classified from Landsat images for study sites are employed to calculate temporal variations of the extent of BIAs in terms of area (Table 1). The extent of BIAs between the two different time periods are converted to percent aerial change to represent change proportion, then the percent aerial change is divided by time difference to calculate rate of percent aerial change (Table 1). The rate of percent aerial change is compared to the rate of change in elevation from 1992 to 2003 for the corresponding location. Based on the two rates of the percent aerial change and the change in elevation, scatter plot diagrams are constructed and Pearson correlation coefficients between the temporal variations of extent of BIAs and the surface mass balance are calculated for different settings of BIAs (Fig. 3).
Correlations between the percentage change rate of BIA extent (%/year, Y axis) and the rate of elevation change for corresponding regions from 1992 to 2003 (cm/year, X axis) for: a) all BIA study sites; b) BIA sites grouped by positive/negative rates of elevation change; c) BIA sites at low elevations; d) BIA sites at high elevations; e) BIA sites at low slopes; f) BIA sites on high slopes; g) BIA sites subject to low nunatak impacts; and h) BIA sites subject to high nunatak impacts.

Results and discussion
This research investigated the temporal variations of extent of BIA in relation to the rate of change in elevation from 1992 to 2003 to determine possible applications of the extent of BIA as a mass balance indicator. To avoid bias resulting from a short period accumulation event and to ensure a valid comparison with change rate of surface elevation data, the BIA sites selected in this study overlap at least six years with the elevation change rate monitoring period and the maximum BIA extent between two different monitoring years. The aerial change of BIA extents mapped from Landsat TM+ and ETM+ may be used as valid tools to study the temporal variation of BIAs with regard to the surface elevation change rate, which indicates the mass balance of the grounded Antarctic ice sheet. By categorising study sites based on different topographic settings, the optimal topographic settings of BIAs for mass balance study may be identified.
Of 33 sites, 72% of the study sites showed a negative relationship, in which an increase in elevation may result in a decrease of BIA extent and a decrease in elevation may result in an increase of BIA extent (Table 1). However, a considerable number of sites (28%) did not follow the negative relationship. Overall, 17 sites showed a decrease in BIA extent from 22 positive elevation change rate sites, and four sites were identified as showing an increase in BIA extent from 11 negative elevation change rate sites. Moreover, the correlation between the percentage change rate of BIA extent and the rate of elevation change was weak, at a Pearson correlation coefficient (r) of −0.245, and no systematic change regarding rate of elevation change was identified (Fig. 3a). This may indicate that a large change in the area of the BIA may not indicate a large change in the mass balance of the Antarctic ice sheet in general, although a change in the BIA extent may be related to the surface mass balance.
Separating the study sites into two different categories of positive and negative rate of elevation change, the trend of increasing BIA extent related to a negative rate of elevation change showed a relatively higher correlation (r = −0.510) than the decrease related to a positive elevation change rate (r = 0.108) (Fig. 3b). The positive rate of elevation change group even showed a positive relationship, which is against the hypothesis of the negative relationship implying a decrease of aerial extent of BIA for positive surface mass balance. Even though 77% of the study sites among the group of positive elevation change showed a decrease in the BIA extent, the magnitudes of aerial change related to the rate of elevation change were very unsystematic (Fig. 3b). The plot indicates that a decrease of aerial extent is largely exaggerated even with small increase in elevation change. This exaggerated aerial decrease of BIAs may be caused by a short duration event of surface accumulation before feedback mechanisms take place to remove the accumulation on ice surface, although the author attempted to avoid such cases. On the other hand, study sites located at the rate of negative elevation change may experience relatively lesser amounts of accumulation events and show more systematic correlation (Fig. 3b).
Nineteen study sites located at elevations lower than 1,500m showed weak correlations (r = −0.120) to the rate of elevation change (Fig. 3c), whereas 14 sites located at higher elevations showed stronger correlations of −0.516 (Fig. 3). The author suspects that BIAs located at lower elevations and near coastal areas were situated in more favorable environments for higher accumulation and sublimation by strong wind erosion and melt/runoff (Genthon and others Reference Genthon, Lardeux and Krinner2007). Therefore, BIAs at lower elevations record greater intensities of interannual variations of accumulation and sublimation (Genthon and others Reference Genthon, Lardeux and Krinner2007; Bintanja Reference Bintanja1999). The BIAs located at lower elevations may respond to short term changes in climate parameters. This higher interannual variability of surface accumulation/sublimation causes difficulties in the image selection for representing long term trends and results in a low correlation between the temporal variations of BIA extent and change rate of surface elevation. On the other hand, the BIAs located at higher elevations show relatively stable sublimation rates (Bintanja Reference Bintanja1999), which may indicate that the BIAs at higher elevations experience relatively low interannual variability. Given the lower interannual variations in mass balance, BIAs at higher elevations may be more appropriate for monitoring long-term trends of surface elevation changes regarding the change in BIA extent and thus show higher correlations. If study sites at higher elevations are grouped by negative rate of surface elevation change, the correlation increases to −0.743 for six study sites.
Both of the study sites in low and high slope topographic units present weak correlations of −0.305 and 0.144, respectively (Figs. 3e, 3f). The study sites at high slopes show positive relationships, which contradicts the general conception of BIA extent and change of surface elevation. These weak correlations may reveal that the slope of a BIA topographic unit is not the critical factor in BIA extent and rate of surface elevation change.
Correlations between the rate of aerial change percentage and the rate of surface elevation change were weak (r = −0.194, Fig. 3g) for 24 study sites at low nunatak impact areas. Brown and Scambos (Reference Brown and Scambos2004) monitored three sites that were in the minimum impact area of nearby nunataks, and they observed interannual area changes of 10–30% and decreases in area over a very short period with a climate induced increase in snowfall or reduced ablation. This suggests that the extent of BIAs at low nunatak impact areas varies largely following short term climate events. Although the distribution of correlation points shows a negative relationship, it can be easily biased and thus shows a weak correlation on long term trends of changes in surface elevation. In contrast, the study sites located at high nunatak impact areas (Type I BIA) (Bintanja Reference Bintanja1999) show the highest correlation (r = −0.783) for the nine monitored study sites (Fig. 3h). These BIAs are located on the lee sides of mountain ranges and nunataks, which act as barriers for snow drifts, with the highest wind speeds over the glacier (Bintanja Reference Bintanja1999). As a result of their topographic settings, these BIAs show relatively stable sublimation rates (Bintanja Reference Bintanja1999; Sinisalo Reference Sinisalo, Moore, Van De Wal, Bintanja and Jonsson2003). Given the relatively low interannual variability, the BIAs at high nunatak impact areas may provide the least amount of biases caused by short term climate events and, therefore, may be useful as an indicator of long term change in surface elevation. Moreover, it was also reported by Bintanja (Reference Bintanja1999) that one critical variable of the extent of these BIAs is the relief of the rock outcrop with regard to the ice level. The area covered by BIAs varies mainly on an ice sheet thinning-thickening time scale, where the BIAs located at nunataks with highest relief are the most stable (Bintanja Reference Bintanja1999). Therefore, it is more appropriate to choose BIAs located at high relief nunataks as mass balance indicators showing the highest correlations and a systematic relationship with the 11 year rate of surface elevation change.
This study provides the first quantitative analysis for determining the systematic relationship between temporal variations in the extent of blue ice areas and a 11 year trend of rate of regional surface elevation change (Davis and others Reference Davis, Li, McConnell, Frey and Hanna2005). The BIA expansion involves snow erosion and sublimation of the snow layers adjacent to the BIA, whereas a decrease in the size of BIAs can occur almost immediately by direct accumulation on the blue ice (Bintanja Reference Bintanja1999). The major limitation of BIA study, as a climate indicator, is the asymmetry in the time scale where a decrease in BIA size may occur over a relatively shorter time scale than an increase in BIA extent. Moreover, the time scales of the two feedback mechanisms removing temporary accumulation vary and are not clearly identified. As a result of the limitations, the temporal variations of BIA extent in general show weak correlations to the rate of elevation change.
Moreover, the complexity of variations of the BIA extent in short term accumulation events and feedback mechanisms hampers the selection of appropriate satellite images representing steady changes in BIA extent. This complexity and challenge in data selection is confirmed by weak correlations of the BIA study group of positive rate of elevation change, whereas the negative rate of elevation change group shows high correlations. The BIAs located at low elevations and far from nearby nunataks show a large range of seasonal and interannual variations in extent as a result of large variations in accumulation and sublimations/melting (Genthon and others Reference Genthon, Lardeux and Krinner2007; Brown and Scambos Reference Brown and Scambos2004). The BIA extent in both cases may be useful in monitoring the BIA response to short term changes in climate parameters. However, BIAs at low elevations or in low nunatak impact areas may not be appropriate for use as long term mass balance indicators, as they show weak correlations in both cases. On the other hand, the BIAs located at higher elevations and close to nearby nunataks are less likely to be hampered by short term variations in climate parameters and are relatively stable (Bintanja Reference Bintanja1999; Sinisalo and others Reference Sinisalo, Moore, Van De Wal, Bintanja and Jonsson2003). Due to the low interannual variations in extent of BIA, those topographic settings provide a more favorable environment to monitoring extent of BIA regarding long term (11 years) changes in surface elevations, which are confirmed by the highest correlations.
On the other hand, this study involves a certain level of uncertainty because of lack of field measurement on meteorological parameters such as surface sublimation and snowdrift erosion other than topographic parameters, which may imply those parameters. In addition, the grid size of the elevation change data (Davis and others Reference Davis, Li, McConnell, Frey and Hanna2005) and the data uncertainty should also be considered. At this stage, the author thinks that it is premature to conclude that there is a clear relationship between surface mass balance and temporal variations of blue ice areas, but the analysis and results presented in this paper contribute to form the basis of future studies to evaluate a model that deals with the physical mechanisms determining BIA sizes.
Conclusion
This study provides the first quantitative analysis for determining the systematic relationship between temporal variations in the extent of blue ice areas and surface mass balance of the Antarctic ice sheet. Six to fifteen years of temporal variations in blue ice extent for 33 study sites in relation to rates of surface elevation change from 1992 to 2003 are investigated. As a result of large interannual variations in the extent of blue ice areas caused by short term events of accumulation/ablation, the temporal variations in extent of blue ice areas generally are not systematic and may not be able to be used as indicators of mass balance of the Antarctic ice sheet. The major difficulties reside in blue ice areas located at low elevations and far from nearby nunataks, which are very sensitive to changes in short term climate parameters. However, blue ice areas located in stable environments, such as, high elevations and close to nearby nunataks may be useful as mass balance indicators, as they show the highest correlations between the percent rate of change in blue ice extent and the rate of surface elevation change.
Moreover, it is more appropriate to monitor the expansion of the extent of blue ice areas with regard to negative change in elevation rather than monitoring the decrease of the extent of blue ice areas with regard to positive change in elevation. Thus, in conclusion, there is probably a systematic linkage between temporal variations in extent of blue ice areas and changes of surface elevation for blue ice areas that are at high elevations, close to nearby nunataks, and experiencing expansion. It is necessary to undertake further study with more reliable in-situ data to determine the relationship.