The Ordovician–Silurian transition was a critical part of Earth's history marked by the extinction of graptolites, large-scale glaciation, global environmental and sea-level change, extensive volcanism and massive plate movement (Brenchley Reference Brenchley1988; Lüning et al. Reference Lüning, Craig, Loydell, Torch, Štorch and Fitches2000, Reference Lüning, Shahin, Loydell, Al-Rabi, Masri, Tarawneh and Kolonic2005; Brenchley et al. Reference Brenchley, Carden, Hints, Kaljo, Marshall, Martma and Nõlvak2003; Chen et al. Reference Chen, Rong, Li and Boucot2004; Saltzman & Young Reference Saltzman and Young2005; Metcalfe Reference Metcalfe2006; Yan et al. (Reference Yan, Chen, Wang, Wang and Chu2008a, Reference Yan, Li, Yong, Xiao, Wang and Xiang2008b); Fan et al. Reference Fan, Peng and Melchin2009; Yan et al. Reference Yan, Chen, Wang and Wang2009; Delabroye & Vecoli Reference Delabroye and Vecoli2010; Cooper et al. Reference Cooper, Sadler, Hammer and Gradstein2012; Melchin et al. Reference Melchin, Mitchell, Holmden and Štorch2013; Ran et al. Reference Ran, Liu, Jansa, Sun, Yang, Ye and Zhang2015; Zhou et al. Reference Zhou, Algeo, Shen, Hu, Gong, Xie and Gao2015; Algeo et al. Reference Algeo, Marenco and Saltzman2016; Li et al. Reference Li, Jahn, Zhao, Dai, Li, Suo, Guo, Wang, Liu, Lan, Zhou, Zheng and Wang2017a, b; Men et al. Reference Men, Mou, Ge and Wang2020). However, most of the reports about these changes are about the North China block and some stable cratonic blocks, while there are few reports about orogenic belts (Ran et al. Reference Ran, Liu, Jansa, Sun, Yang, Ye and Zhang2015; Lei et al. Reference Lei, Dashtgard, Wang, Li, Feng, Yu, Zhao and Du2019; Men et al. Reference Men, Mou, Ge and Wang2020). Moreover, the trigger mechanism for these changes remains unclear. Many assumptions have been made about those changes (Chen et al. Reference Chen, Rong, Li and Boucot2004, Reference Chen, Fan, Melchin and Mitchell2005; Wang et al. Reference Wang, Yan and Li2008; Su et al. Reference Su, Huff, Ettensohn, Liu, Zhang and Li2009; Ran et al. Reference Ran, Liu, Jansa, Sun, Yang, Ye and Zhang2015; Lei et al. Reference Lei, Dashtgard, Wang, Li, Feng, Yu, Zhao and Du2019; Men et al. Reference Men, Mou, Ge and Wang2020). The North Qilian Orogen, which forms the northern part of the Proto-Tethys Ocean along the northern margin of eastern Gondwana, is positioned to test some of these hypotheses. The strata of the late Hirnantian to Rhuddanian interval in the North Qilian Orogen, named the Zhongbao Formation and the Mayinggou Formation, consists mainly of chert, mudstone, sandstone and limestone (Du et al. Reference Du, Zhu and Gu2006; Yan et al. Reference Yan, Chen, Wang, Wang and Chu2008a, Reference Yan, Chen, Wang and Wangb; Bai et al. Reference Bai, Wang, Zhu and Xie2016). The Ordovician–Silurian lithostratigraphy was regarded as a special lithofacies resulting from a change of oxygen-rich oceanic conditions to anoxic oceanic conditions occurring across the Ordovician–Silurian boundary (Wang et al. Reference Wang, Yan and Li2008; Liu et al. Reference Liu, Ma, Jansa, Huang, Zeng and Zhang2013; Ran et al. Reference Ran, Liu, Jansa, Sun, Yang, Ye and Zhang2015; Ge et al. Reference Ge, Mou, Wang, Men, Chen and Hou2018; Men et al. Reference Men, Mou, Ge and Wang2020). The occurrence of siliceous successions locally up to 60 m thick in the eastern part of the North Qian Belt provides important indications of the tectonic environment at that time (Bai et al. Reference Bai, Wang, Zhu and Xie2016). The origin of siliceous in the North Qilian Orogen has been debated for years. Qian et al. (Reference Qian, Zhang, Sun and Wang2001) believed that the Late Ordovician chert in North Qilian Orogen were formed in a back-arc basin which was close to the continental environment. Xu et al. (Reference Xu, Zhao, Xia and Xia2003) interpreted the chert as the sedimentation which deposited in an island arc tectonic environment. Du et al. (Reference Du, Zhu and Gu2006) interpreted the Upper Ordovician chert as an archipelagic ocean deposit. Yan et al. (Reference Yan, Chen, Wang, Wang and Chu2008a, Reference Yan, Chen, Wang and Wangb) believed that the cherts in North Qilian were formed in a continental margin environment. The Shihuigou Section of the North Qilian Orogen is the stratigraphic division of the Zhongbao Formation in the Ordovician, which is an ideal place to study the tectonic evolution of the North Qilian Orogenic Belt across the Ordovician–Silurian transitional boundary.
This study aims to assess the petrological, mineralogical, sedimentology and geochemistry of the cherts from the Upper Ordovician–Silurian transition, and deduce their provenance and palaeoenvironments.
1. Geological background
The North Qilian Orogen is hypothesised to have been located along the northern margin of Gondwana during the Late Ordovician to Early Silurian (Fig. 1a; Li et al. Reference Li, Jahn, Zhao, Dai, Li, Suo, Guo, Wang, Liu, Lan, Zhou, Zheng and Wang2017a, b). During the Early Palaeozoic, the North Qilian Ocean was located between the Alax block and the Central Qilian block, and was part of the Proto-Tethys Ocean (Zhang et al. Reference Zhang, Yu, Li, Yu, Lin and Mao2015; Li et al. Reference Li, Jahn, Zhao, Dai, Li, Suo, Guo, Wang, Liu, Lan, Zhou, Zheng and Wang2017a, b) (Fig. 1a). The North Qilian Orogen extends north-westward for over 1000 km (Song et al. Reference Song, Niu, Su and Xia2013). The northern part of the North Qilian Orogen is cut by the Zoulangnanshan Fault. The southern part of the North Qilian Orogen is cut by the Central Qilian Fault. The south-eastern margin of the North Qilian Orogen is in contact with Qinling Orogen, which is also the part of the Central Orogenic Belt of China (Li et al. Reference Li, Kusky, Wang, Zhang, Lai, Liu, Dong and Zhao2007; Zheng et al. Reference Zheng, Griffin, Sun, O'Reilly, Zhang, Zhou, Xiao, Tang and Zhang2010; Dong & Santosh Reference Dong and Santosh2016). The western part of the North Qilian Orogen is cut by the Altyn Tagh Fault (Zhang et al. Reference Zhang, Yu and Mattinson2017) (Fig. 1b). From N to S, the North Qilian terrane consists of a back-arc basin, island arc, subduction complex, fore-arc basin and subduction oceanic crust debris (Zuo & Liu Reference Zuo and Liu1987; Xu et al. Reference Xu, Xu, Zhang, Li, Zhu, Qu, Chen, Chen and Yang1994; Yu et al. Reference Yu, Zhang, Del Real, Zhao, Hou, Gong and Li2013; Guo et al. Reference Guo, Gao, Li, Xu, Huang, Wang, Li, Zhao and Li2016). Several volcanic and granitic belts, ophiolite belts, fore-arc accretionary wedges and some other basic tectonic units were developed in the North Qilian Orogen. It has the characteristics of a typical accretive orogenic belt (Zuo & Wu Reference Zuo and Wu1997; Hall Reference Hall2002; Xia et al. Reference Xia, Xia and Xu2003; Song et al. Reference Song, Niu and Zhang2009).
(a) Tectonic model of the northern margin of Greater Gondwana and the Proto-Tethys Ocean during the Late Ordovician–Early Silurian (modified after Li et al. Reference Li, Zheng, Xiong, Zhou and Xiang2018). (b) Simplified geological map showing the distribution of Palaeozoic granitoids in the North Qilian and the Alax (Song et al. Reference Song, Niu, Su and Xia2013; Zhang et al. Reference Zhang, Yu and Mattinson2017). (c) Geological sketch map of Yongdeng area (Xu et al. Reference Xu, Xu, Zhang, Li, Zhu, Qu, Chen, Chen and Yang1994). Abbreviations: QL = North Qilian; YZ = Yangtze Craton; CA = Cathaysia Block; BJ = Bureya–Jiamusi Block; NQL = North Qinling; CAL = Central Altyn; IC = Indochina Block; OL = Oulongbuluke; QD = Qaidam Block; LS = Lhasa terrane; SI = Sibumasu terrane; NQT = North Qiangtang terrane; SP = Songpan-Ganze terrane; SQT = South Qiangtang terrane.

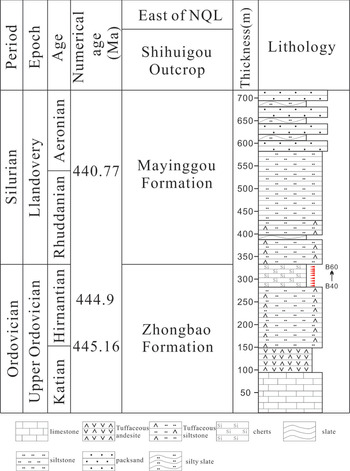
As the first named location of the Ordovician Zhongbao Formation, Shihuigou outcrop [SHP 36°51′29″N, 103°13′35″E] in Yongdeng County of the North Qilian Orogen is an ideal place for the study of the Upper Ordovician–Lower Silurian tectonic evolution of the Orogen. Shihuigou area in Yongdeng County is located in the eastern part of the North Qilian Orogen (Fig. 1c). Upper Ordovician to Lower Silurian strata in the Shihuigou area include the Zhongbao and Mayinggou formations (Fig. 2). Their ages are well constrained by a basalt date and a biostratigraphic date (Feng Reference Feng1992; Xia et al. Reference Xia, Xia and Xu1996, Reference Xia, Xia and Xu2003; Xu et al. Reference Xu, Zhao, Xia and Xia2003). The outcrop layer in the study area is mainly composed of Zhongbao Formation volcanic rock, pyroclastic rock, carbonate rock and chert, Mayinggou Formation clastic rocks and Devonian lacustrine clastic rocks (Hou et al. Reference Hou, Mou, Wang and Tan2018a, Reference Hou, Mou, Wang, Tan, Ge and Wangb) (Fig. 2).
Stratigraphic section of each sample of the Upper Ordovician–Lower Silurian in the Shihuigou Section in the North Qilian Orogen. Chronostratigraphic subdivision after Chen et al. (Reference Chen, Rong, Fan, Zhan, Mitchell, Harper and Wang2006) and Zhan & Jin (Reference Zhan and Jin2007).

2. Samples and experimental methods
In the Shihuigou outcrop, 20 chert samples (Fig. 2) were collected from strata deposited during the Hirnantian age and comprise part of the Zhongbao Formation. All samples were stored in plastic bags to ensure as little contamination as possible. X-ray diffraction (XRD) was used to determine compositions.
XRD analysis of whole-rock in samples was performed in the CNNC (China National Nuclear Corporation) Beijing Research Institute of Uranium Geology. XRD was performed using a Panalytical X'Pert PRO X-ray diffractometer equipped with a curved graphite monochromator and a copper (Cu) target. The analytical procedures were based on the Chinese National Standard SY/T 5163-2010 (Technical 2010). First, 1–2 g of the chert samples were crushed and prepared on oriented glass slides by a smear technique for powder X-ray analysis. The XRD results were then subjected to quantitative mineralogical analysis after drying with ethylene glycol and steam saturation at 50 °C for 48 h. The major, trace and rare earth element analysis was conducted in the laboratory of the CNNC Beijing Research Institute of Uranium Geology. The samples were crushed and ground to smaller than 200 mesh in an agate mortar for geochemical analysis. X-ray fluorescence spectrometry (AB-104L, PW2404) was used to identify oxides of major elements. The analytical uncertainty is generally less than 2 %. Using an inductively coupled plasma-mass spectrometer (ICP-MS), we analysed 20 trace elements (including rare earth elements (REEs)) in 20 samples according to the method described in the Chinese National Standard DZ/T 0223-2001 (2001). The analytical procedure is described as follows. Firstly, powders (25 mg) were digested in high-pressure-resistant beakers containing a mixture of hydrofluoric acid (HF)–nitric acid (HNO3) (1:1), heated for 36 h at 80 °C and evaporated. Then, after the solutions were evaporated to dryness, 1.5 mL of HNO3, 1.5 mL of HF and 0.5 mL of perchloric acid (HCLO4) were added. The beakers containing the solutions were then capped for digestion in a temperature oven at 190 °C for at least 48 h. Lastly, the solutions were diluted to a volume of 50 mL with 1 % HNO3 for analysis. The trace elements were measured with a Thermo Scientific ELEMENT XR ICP-MS instrument at 20 °C and under 30 % relative humidity. The analytical uncertainty is generally less than 5 %.
3. Results
3.1. Petrology
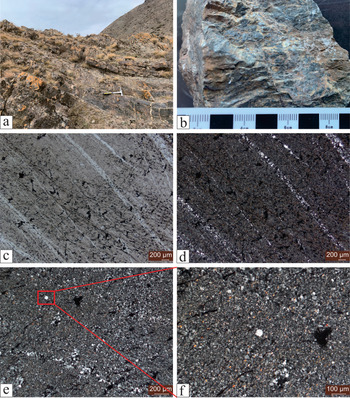
The chert in the Zhongbao Formation are a medium–thick layer. The rocks are black or grey, of extreme hardness and with a tendency to break along conchoidal fractures when struck with a hammer (Fig. 3a, b). Radiolarians were found as a zooplankton throughout the ancient oceans. The original siliceous skeletons of radiolarians were dissolved and rarely preserved during diagenesis. Radiolaria tests in cherts are usually not well preserved due to strong silicification and calcification (Fig. 3c, d), but are occasionally well preserved (Fig. 3e, f). Well-preserved radiolarians can be clearly seen by their original siliceous spurs and categorised into the spherical morphotypes based on outlines (Fig. 3e, f). Some of the laminae have a clear contact between two different laminae, which may indicate a change of terrigenous input (Fig. 3c, d). The aforementioned petrographic study indicates that radiolarian chert was deposited in an environment characterised by the occasional input of fine-grained terrigenous clastic, suggesting deposition in an environment near an exposed land mass, maybe from the Central Qilian block (Fig. 1).
Macrophotographs#and photomicrographs of chert texture in Shihuigou Sections from the Zhongbao Formation. (a, b) Macroscopic characteristics of chert. (c, d) Microscopic characteristics of chert. (e, f) Radiolaria tests scattered in chert from Shihuigou Section.

The XRD results show that the chert samples consist of quartz, clay minerals and feldspar (Table 1). Quartz is the main clast, with a content of 85–100 %, which commonly exists in the chert. Feldspar is distributed in samples SHP-B51, SHP-B53, SHP-B54 and SHP-60, whose content varies from 1 % to 4 %. All the XRD data are consistent with the petrological characteristics of the chert.
Mineral compositions of chert from the Shihuigou (SHP) section (X-ray diffraction).

3.2. Geochemistry characteristics
3.2.1. Major elements
The concentrations of major elements and trace elements ratios in the Zhongbao Formation cherts are listed in Table 2. Twenty chert samples from the Zhongbao Formation were high in silica (81.83–97.29 %, average 92.03 %), and low in other elements. This value would identify this group in the so-called pure cherts. The silicon dioxide (SiO2) content showed a negative Spearman rank correlation with the most major elements (Table 2). This phenomenon is attributed to the so-called SiO2 dilution effect, in part due to the transformation of the radiolarians with the dilution of other major elements and additional silica (Garbán et al. Reference Garbán, Martinez, Márquez, Rey, Escobar and Esquinas2017; Men et al. Reference Men, Mou, Ge and Wang2020). The chert samples from the Zhongbao Formation show similarity in their low content of magnesium oxide (MgO) (0.098–1.03 %, average 0.32 %), sodium oxide (Na2O) (0.024–0.105 %, average 0.05 %) and titanium dioxide (TiO2) (0.03–0.185 %, average 0.09). Aluminium oxide (Al2O3) and iron(III) oxide (Fe2O3) are present as minor components, with Al2O3 content ranging from 0.82 % to 6.08 %, with an average of 2.46 %, and Fe2O3T content ranging from 0.23 % to 5.14 %, with an average of 2.03 %. High content of Fe2O3T is maybe related to abundant iron (Fe) sulphides. Al2O3 exhibits a strong positive correlation with potassium oxide (K2O) (R = 0.98), MgO (R = 0.78) and TiO2 (R = 0.92) in the Zhongbao Formation (Table 3), thereby indicating that the cherts are controlled by common chemical processes.
Representative major element contents (wt%) from the Zhongbao Formation in the Shihuigou (SHP) Section. Abbreviations: CaO = calcium oxide; MnO = manganese(II) oxide; FeO = ferrous oxide; P2O5 = phosphorus pentoxide; LOI = loss on ignition.

The correlation coefficients of major element content of chert in the Shihuigou Section.

3.2.2. Minor and trace elements
Table 4 show the trace elements in chert samples from the Zhongbao Formation. Trace element concentrations of cherts from the Zhongbao Formation are significantly lower than their Clarke value (Table 4) (Tao et al. Reference Tao, Yan and Lu1986). Generally, titanium (Ti) and yttrium (Y) concentrations of chert increase progressively from the oceanic ridge, oceanic basin to continental margin, while vanadium (V), nickel (Ni) and Cu concentrations decrease gradually (Murray et al. Reference Murray, Ten Brink, Gerlach, Russ and Jones1991; Murray Reference Murray1994; Xu et al. Reference Xu, Zhao, Lan, Wu, Xiao and Zhang2020). The V concentrations of the above 20 samples are 4.68–99.2 × 10⁻⁶ ppm, and their V/Y and Ti/V ratios range from 1.30 to 6.36 (average 2.48) and from 9.85 to 43.49 (average 30.85), respectively, which is consistent with the continental margin source (Fig. 4) (Murray et al. Reference Murray, Ten Brink, Gerlach, Russ and Jones1991; Xu et al. Reference Xu, Zhao, Lan, Wu, Xiao and Zhang2020). Niobium (Nb), thorium (Th) and rubidium (Rb) concentrations of the cherts are mainly derived from the continent, and do not dissolve in seawater (Kato et al. Reference Kato, Nakao and Isozaki2002), so the concentrations of these elements in the chert indicate the extent of impact of terrigenous material. The Nb, Th and Rb concentrations show a positive correlation with terrigenous major elements Al2O3 and TiO2 (Fig. 5).
V/Y versus Ti/V diagram for the Shihuigou outcrop cherts. Adapted from Murray et al. (Reference Murray, Ten Brink, Gerlach, Russ and Jones1991) and Xu et al. (Reference Xu, Zhao, Lan, Wu, Xiao and Zhang2020).

Variation diagrams of major oxides and minor elements for Zhongbao Formation chert.

Representative minor and trace element contents (ppm) from the Zhongbao Formation in the Shihuigou Section. Abbreviations: Ga = gallium; Sr = strontium; Cs = caesium; Ba = barium; Hf = hafnium; Ta = tantalum; W = tungsten; U = uranium; Ni = nickel.

REE analytical data (Table 5) of the Shihuigou Sections (20 in total) are shown as Post-Archean Australian shale (PAAS)-normalised plots in Figure 6. The total REE concentrations in the chert range from 17.61 × 10⁻⁶ ppm to 154.03 × 10⁻⁶ ppm, with an average of 57.11 × 10⁻⁶ ppm, which are obviously lower than that in the PAAS average (183 × 10−6 ppm; Taylor & McLennan Reference Taylor and McLennan1985) and the North American shale composite (NASC) (173 × 10−6 ppm; Gromet et al. Reference Gromet, Dymek, Haskin and Korotev1984); this reflects that the chert were exposed to seawater within shorter periods and small amount of earth elements were absorbed because of high depositional rates. The PAAS-normalised REE of the chert present a flat distribution curve without conspicuous differentiation between light and heavy REEs (Fig. 6). The chert samples showing negative or small positive europium (Eu) anomalies (Eu/Eu* in the 0.89–1.28 range with an average of 1.05), and negative or no cerium (Ce) anomalies (Ce/Ce* in the 0.72–1.03 range with an average of 0.89). Shields & Stille (Reference Shields and Stille2001) reported that diagenesis could cause REE patterns to become progressively Eu-depleted and Ce-enriched. The absence of no Ce anomalies, the small positive Eu anomalies and a negative correlation between Ce/Ce* and DyN/SmN((Dy/4.68)/(Sm/5.55)) ratios have not been observed in cherts (Fig. 7), indicating that the REE patterns and Ce anomalies of the studied cherts have not shifted during the diagenetic processes (Webb et al. Reference Webb, Nothdurft, Kamber, Kloprogge and Zhao2009; Wen et al. Reference Wen, Fan, Tian, Wang and Hu2016).
PAAS-normalised REE distribution patterns of Late Ordovician chert from the Shihuigou Section (normalisation values after Mclennan Reference McLennan, Hemming, McDaniel and Hanson1993).

The absence of a Ce/Ce correlation with DyN/SmN implies that the REE patterns and Ce/Ce were not significantly altered during the diagenetic processes.

Representative rare earth element contents (ppm) from the Zhongbao Formation in the Shihuigou Section. Abbreviations: La = lanthanum; Pr = praseodymium; Nd = neodymium; Sm = samarium; Gd = gadolinium; Tb = terbium; Dy = dysprosium; Er = erbium; Tm = thulium; Yb = ytterbium; Lu = lutetium.

4. Discussion
4.1. Origin of the cherts
The clastic composition and chemical composition of the sedimentary rocks can provide important information for crustal evolution and the interaction between atmosphere and hydrosphere. Al2O3/TiO2, Eu/Eu*, zirconium (Zr)/TiO2, Cr/Th and the CIA (Chemical index of alteration) have been successfully applied to the study of the provenance (McLennan et al. Reference McLennan, Taylor and Erikkson1983; Fedo et al. Reference Fedo, Nesbitt and Young1995, Reference Fedo, Eriksson and Krogstad1996). Some similar geochemical ratios have been used in the provenance and sedimentary environment of the chert (Murray et al. Reference Murray, ten Brink, Jones, Gerlach and Russ1990; Murray Reference Murray1994; Girty et al. Reference Girty, Ridge, Knaack, Johnson and Al-Riyami1996; Owen et al. Reference Owen, Armstrong and Floyd1999; Suigtani et al. Reference Suigtani, Yamamoto, Wada, Binu-Lal and Yoneshige2002).
Sedimentary recycling and sorting can lead to enrichment of some minerals like zircon (McLennan et al. Reference McLennan, Hemming, McDaniel and Hanson1993). The bivariate cross-diagrams of Th/scandium (Sc)–Zr/Sc (Fig. 8) were applied to estimate the degree of sedimentary recycling in the cherts and their mineral compositions. Zr is concentrated in dense minerals; the Zr/Sc ratio may provide a measure of sedimentary recycling and sorting (Basu et al. Reference Basu, Sharma and DeCelles1990). Th/Sc showed the overall positive correlation with Zr/Sc for first-cycle sediments, depending on the nature of the source rocks, whereas Zr/Sc ratios showed the considerable variation with the Th/Sc ratio in mature or recycled sediments (McLennan et al. Reference McLennan, Hemming, McDaniel and Hanson1993). The samples from the Shihuigou outcrop are clustered along the primary compositional trend. The samples generally occur along the magmatic compositional variation trend of rocks, indicating that the rocks did not undergo obvious sedimentary sorting and recycling. The Zr/Sc changes appear to be due to compositional variations. So, the geochemical date of the chert samples can be used to identify the provenance.
Th/Sc versus Zr/Sc diagram excludes sedimentary recycling and confirms affinity for continental sources.

Research shows that the contents of TiO2, Fe2O3, Th, Se and the REE in the chert are not affected by diagenesis, contact metamorphism and regional metamorphism (Girty et al. Reference Girty, Ridge, Knaack, Johnson and Al-Riyami1996). The silicon (Si)/Si + aluminium (Al) + Fe + calcium (Ca) ratio has been proposed by Ruiz-Ortiz et al. (Reference Ruiz-Ortiz, Bustillo, Molina, Hein and Obradovic1989) to determine the source of silica in chert samples. Si/Si + Al + Fe + Ca values of the Zhongbao Formation chert samples range from 0.88 to 0.98, with an average value of 0.95 (Table 2). This indicates that most of the SiO2 in cherts is of biogenic origin. The Al–Fe–manganese (Mn) diagram has been used for classification of the depositional environments of chert (Adachi et al. Reference Adachi, Yamamoto and Sugisaki1986; Yamamoto Reference Yamamoto1987). On this diagram (Fig. 9), due to extremely low Mn content, most of the analysed chert samples plot close to the Al–Fe line. Most analyses plot in the non-hydrothermal area. Based on the above results, along with petrographic characteristics, we believe that a hydrothermal origin can be excluded. In addition to the supply of the hydrothermal siliceous detritus, other sources of contribution cannot be excluded, such as the input of biogenic siliceous detritus and terrigenous clastics. The geochemical content of Fe, Ti and Al shows that the North Qilian Orogen has Al/Ti ratios intermediate to continental shale (NASC), and the Fe/Ti ratios of the Zhongbao Formation cherts plot above the mixing line between NASC and Felsic volcanic. The element ratios are close to those of NASC (Fig. 10). Our results demonstrate that the Zhongbao Formation sample is of terrigenous origin. Continental detrital contamination can lower the Y/holmium (Ho) ratios of chemically precipitated sediments because of detritus commonly displaying uniform and low Y/Ho ratios (Nozaki et al. Reference Nozaki, Zhang and Amakawa1997). Twenty chert samples of the Zhongbao Formation with low Y/Ho ratios (average of 26.40) indicate significant detritus contamination. These observations are in good consistency with the Fe/Ti ratios. In order to ensure the reliability of the continental affinity of the chert of the Zhongbao Formation, the Y/Ni and the chromium (Cr)/V elemental ratios can be used to identify the mafic sources (Hiscott Reference Hiscott1984). From the discriminant figure (Fig. 11), all of the chert samples plot close to PAAS.
Al–Fe–Mn diagram of this study showing samples from chert in the Zhongbao Formation. Hydrothermal and non-hydrothermal fields are from Adachi et al. (Reference Adachi, Yamamoto and Sugisaki1986).

Log–log plot of Al/Ti versus Fe/Ti ratio from Shihuigou Section chert. NASC data are from Gromet et al. (Reference Gromet, Dymek, Haskin and Korotev1984). Data for Palaeozoic basalt, andesite and felsic rock are from Condie (Reference Condie1993). The ratio for the Shihuigou Section cherts is close to that of the NASC.

Cr/V versus Y/Ni diagram. Ultramafic sources indicated by low Y/Ni and high Cr/V ratios. Curves model shows mixing between PAAS and granite endmember. North Qilian Orogen samples are distributed close to the PAAS endmember.

The geochemical date of the chert can be influenced by many processes such as different sources, transport, sorting and diagenesis (Armstrong-Altrin et al. Reference Armstrong-Altrin, Nagarajan, Balaram and Natalhy-Pineda2015; Madhavaraju Reference Madhavaraju2015). The mineral reactions occurring during diagenesis may influence chemical tools frequently used to constrain the provenance, weathering and depositional history of the sediment (McLennan et al. Reference McLennan, Hemming, McDaniel and Hanson1993). In order to infer the source of the cherts, several major and trace elements-based discrimination diagrams have been proposed (Floyd & Leveridge Reference Floyd and Leveridge1987; Roser & Korsch Reference Roser and Korsch1988; Basu et al. Reference Basu, Sharma and DeCelles1990; McLennan et al. Reference McLennan, Taylor, McCulloch and Maynard1990, Reference McLennan, Hemming, McDaniel and Hanson1993; Plank & Langmuir Reference Plank and Langmuir1998). For instance, the K2O/Rb ratio has been used to estimate volcanic contributions to rock composition. A low K2O/Rb ratio is characteristic of ancient and highly weathered provenance (McLennan et al. Reference McLennan, Taylor, McCulloch and Maynard1990). Most of the chert samples have a low K2O/Rb ratio (Fig. 12), which implies they source from a volcanoclastic-rich sediment.
K2O versus Rb diagram showing that the samples from Shihuigou Section cherts are affected by weathering.

All of the above facts reflected that the origin of the cherts are mainly biogenic siliceous detritus and terrigenous clastics.
4.2. Depositional environment
The chemical compositions of chert are chiefly determined by the biogenic silica derived from radiolarians and sponge spicules, which are modified by the incorporated clastic lithogenic materials and the hydrogenous component (Kunimaxu et al. Reference Kunimaxu, Shimiuz, Takahashi and Yabuki1998). The normalised (Lan)/(Cen) ratios in chert provide a means of recognising its environment of formation (Murray et al. Reference Murray, ten Brink, Jones, Gerlach and Russ1990, 1992; Murray Reference Murray1994). Cherts with (Lan)/(Cen) ratios 0.5–1.5 correspond to sediments deposited in a continental margin, while cherts with ratios 1.0–2.5 were deposited chiefly on the deep oceanic floor, with ratios higher than 3.5 corresponding to sediments deposited at a mid-ocean ridge (Murray et al. Reference Murray, Buchholtzten Birnk, Gerlach, Russ and Jones1992; Armstrong et al. Reference Armstrong-Altrin, Nagarajan, Madhacaraju, Rosalez-Hoz, Lee, Balaram, Cruz-Martinez and Avila-Ramirez2013). In all Zhongbao Formation cherts the ratios are usually 0.5–1.5 (Table 5). The Ce content of the cherts are influenced by their dielectric properties, terrigenous supply and their deposition rate (Murray et al. Reference Murray, ten Brink, Jones, Gerlach and Russ1990, 1992; Murray Reference Murray1994; Zhang et al. Reference Zhang, Yu and Mattinson2017; Men et al. Reference Men, Mou, Ge and Wang2020). Cherts with a Ce/Ce* value of 0.79–1.54 correspond to sediments deposited in a continental margin, while cherts with a Ce/Ce* value lower than 0.29 were deposited in a pelagic environment (Murray Reference Murray1994). The Ce/Ce* value of the Zhongbao Formation cherts is usually 0.72–1.03 (average = 0.89) (Table 5). Different from the obvious Ce negative anomaly (<0.29) in the ocean basin, the Zhongbao Formation cherts Ce/Ce* value have a weak Ce negative anomaly, which is close to the Ce anomaly characteristics of a continental margin basin (Murray Reference Murray1994). These cherts also indicate a strong input of material related to terrigenous detrital sediments. Murray (Reference Murray1994) presented chemical depositional criteria using non-diagenetic reset ratios, such as the REE ratios (Lan/Cen) and the Al2O3/(Al2O3 + Fe2O3) ratio. In the Fe2O3/TiO2–Al2O3/(Al2O3 + Fe2O3) and Lan/Cen–Al2O3/(Al2O3 + Fe2O3) diagram, the Al2O3/(Al2O3 + Fe2O3) ratios are given to be 0.05–0.4 at ridge-proximal, 0.4–0.7 at pelagic and 0.55–0.9 at continental margin for submarine cherts (Fig. 13a); the Lan/Cen ratios are 0.5–1.4, 1–2.5 and 3–4 formed at continental margin, pelagic and ridge-proximal, respectively (Fig. 13b). Applying the aforementioned major and trace element ratios, most Zhongbao Formation cherts fall within the fields of the area near the continental margin field.
Discrimination diagrams for geological settings of the cherts. (a) Diagram of Fe2O3/TiO2 and Al2O3/(Al2O3+Fe2O3); (b) Diagram of Lan/Cen and Al2O3/(Al2O3+Fe2O3).

4.3. Formation model for cherts
The Late Ordovician was the beginning of the first of the five big Phanerozoic extinction events, which is also upheaval in Earth systems – a prolonged ‘Hot-house’ climate through the Early Ordovician, changing to ‘Ice-house’ conditions in the Late Ordovician. In the Late Ordovician, there have many characteristics, such as rapid migration of tectonic plates, extensive volcanicity events, strong fluctuations in eustatic sea level, oceanic turnover, global glaciation and mass extinction at the end of the period (Cooper et al. Reference Cooper, Sadler, Hammer and Gradstein2012; Ran et al. Reference Ran, Liu, Jansa, Sun, Yang, Ye and Zhang2015). The North Qilian Orogenic Belt has been considered as a representative oceanic suture zone and one of the northern orogenic collages of the Proto-Tethys Ocean in the Late Ordovician (Song et al. Reference Song, Niu, Su and Xia2013; Zhang et al. Reference Zhang, Yu, Li, Yu, Lin and Mao2015; Li et al. Reference Li, Jahn, Zhao, Dai, Li, Suo, Guo, Wang, Liu, Lan, Zhou, Zheng and Wang2017a). Intensified volcanic ash eruptions occurred, as shown by numerous basalts, and tuffs beds present in the North Qilian Orogen, including our sections (Wang Reference Wang2013; Li et al. Reference Li, Zhang, Ellis and Shao2017b; Wang et al. Reference Wang, Wu, Li and Chen2018). Massive volcanic ashes fall into the ocean, which stimulate the abundance of phytoplankton.
Although a hydrothermal origin for the Zhongbao Formation radiolarian cherts has been excluded, biosiliceous deposition has still been debated for years (Xia et al. Reference Xia, Xia and Xu2003; Xu et al. Reference Xu, Zhao, Xia and Xia2003; Du et al. Reference Du, Zhu and Gu2006; Yan et al. Reference Yan, Xiao, Wang and Li2007; Bai et al. Reference Bai, Wang, Zhu and Xie2016). In modern-day marine basins, Zhang et al. (Reference Zhang, Yu and Mattinson2017) conducted two microcosm experiments in the low-nutrition and low-chlorophyll western Pacific Ocean, and found that volcanic ash stimulated the abundance of heterotrophic bacterioplankton and the bloom of phytoplankton. Chen et al. (Reference Chen, Zhang, Zhang, Xiang and Lu2008) reported that submarine volcanic activity initiated the abundance of radiolaria, which also contains a lot of volcanic glass clasts in the South China Sea. There is a similar phenomenon that has been observed by Hamme et al. (Reference Hamme, Webley, Crawford, Whitney, DeGrandpre, Emerson and Peña2010). He provided the surface sediments for the North Pacific with the largest phytoplankton blooms after ash fell, indicating that its formation is mainly related to the submarine volcanic activity. The radiolarians are heterotrophs that feed on algae and bacteria by using the pseudopodial net (Dennett et al. Reference Dennett, Caron, Michaels, Gallager and Davis2002). The continuous southward collision and accretion of the Alax Block to the Central Qilian Block formed a fore-arc basin on the North Qilian Orogen (Yan et al. Reference Yan, Xiao, Wang and Li2007, Reference Yan, Xiao, Windley, Wang and Li2010; Xiao et al. Reference Xiao, Brian and Yong2009; Hou et al. Reference Hou, Mou, Han, Wang and Tan2020). The cohesion and collision between the North Qilian Orogen and its peripheral blocks continued to be intensified, which caused massive volcanic activity (Du et al. Reference Du, Zhu, Han and Gu2004, Reference Du, Zhu and Gu2007; Yan et al. Reference Yan, Xiao, Wang and Li2007, Reference Yan, Xiao, Windley, Wang and Li2010; Xiao et al. Reference Xiao, Brian and Yong2009; Song et al. Reference Song, Niu, Su and Xia2013; Hou et al. Reference Hou, Mou, Han, Wang and Tan2020). The volcanic activity provides nutrients for the algae and the bacteria. A large number of algae and bacteria provide nutrients for radiolarians, which provide massive biogenic sources for Late Ordovician chert. In the chert of the Zhongbao Formation, volcanic detritals could be identified from the radiolarian cherts in the North Qilian Orogen (Xia et al. Reference Xia, Xia and Xu2003; Xu et al. Reference Xu, Zhao, Xia and Xia2003; Du et al. Reference Du, Zhu and Gu2006; Yan et al. Reference Yan, Chen, Wang, Wang and Chu2008a, Reference Yan, Chen, Wang and Wangb), which support correlation between volcanic spasms and opaline accumulation rates (Miskell et al. Reference Miskell, Brass and Harrison1985; Zhou & Kyte Reference Zhou and Kyte1992). Tuffaceous rocks exist in the upper and lower layers of the chert (Fig. 2). This evidence of a correlation between tuffs and cherts supports the notion that volcanogenic silica provided favourable conditions for radiolarian propagation in this study. In addition, the radiolarian cherts are extensively present in the eastern and western margins of the North Qilian Orogen (Xia et al. Reference Xia, Xia and Xu2003; Xu et al. Reference Xu, Zhao, Xia and Xia2003; Du et al. Reference Du, Zhu and Gu2006; Yan et al. Reference Yan, Chen, Wang, Wang and Chu2008a, Reference Yan, Chen, Wang and Wangb), which suggests that abundance of chert biota has causal links with increased volcanogenic silica supply (De Wever et al. Reference De Wever, Azéma and Fourcade1994).
Based on the field geological observation, the lithologic observation under the microscope, geochemical analysis and the tectonic setting of this study area at the Ordovician–Silurian transition, we constructed the formation model for the studied cherts (Fig. 14). This model shows that the Late Ordovician cherts were sourced from the continental shelf brought about by changes in subduction and collision of the Alax Block to the Central Qilian Block. The subduction and collision led to the water deepening, forming anoxic bottom conditions (Fig. 14). In this context, we find that the number of radiolarians in the Shihuigou outcrop of the Zhongbao Formation is small. The explanation is that the Shihuigou area was in a relatively deep, anoxic water column condition close to the subsidence centre (Xia et al. Reference Xia, Xia and Xu2003; Xu et al. Reference Xu, Zhao, Xia and Xia2003; Du et al. Reference Du, Zhu and Gu2006; Yan et al. Reference Yan, Chen, Wang, Wang and Chu2008a, Reference Yan, Chen, Wang and Wangb), and most of the radiolarian may have dissolved under anoxic conditions accompanied by sulphate-reducing bacteria. To the phenomenon above, Bak & Sawlowicz (Reference Bak and Sawlowicz2000) concluded that pyrite replaced silica skeletons during their journey through the anoxic water column. Reolid (Reference Reolid2014) also found this phenomenon in Lower Toarcian marls and marly limestone deposits from the South Iberia palaeomargin. We can only speculate that the end of the ice age and the continuous subduction of the North Qilian Orogen and its peripheral blocks led to the North Qilian ocean to deepen, which made the radiolarian dissolve under anoxic conditions accompanied by sulphate-reducing bacteria. However, this inference needs to be tested by additional studies in the future.
(a) Sketch of tectonic evolution of the NW margin of the North Qilian Orogen during the Late Ordovician–Early Silurian. (b) Model for the deposition of the Zhongbao Formation chert in this study area.

5. Tectonic significance
Similar to other typical subduction-accretionary orogenic belts (e.g., the central Asian Orogenic Belt), the early Palaeozoic North Qilian Orogenic Belt was likely an arc–continent collision event, which underwent a set of subduction, accretion, collision and crustal thickening events, followed by extension and thinning of the previously thickened crust. The Late Ordovician was a time of upheaval in Earth systems (Xu et al. Reference Xu, Xu, Zhang, Li, Zhu, Qu, Chen, Chen and Yang1994; Xia et al. Reference Xia, Xia and Xu1996, Reference Xia, Xia and Xu1998, Reference Xia, Xia and Xu2003; Zhang et al. Reference Zhang, Sun and Zhou1997, Reference Zhang, Xu, Xu and Li1998; Song et al. Reference Song, Niu, Su and Xia2013). The Ordovician–Silurian transition in the North Qilian Orogen was affected by Oceanic turnover, mass extinction at the end of the Ordovician and eustatic sea-level fluctuations, modified by local plate tectonics because of the low palaeolatitude and shelf environment embraced by orogenic uplifts (Xiao et al. Reference Xiao, Brian and Yong2009; Yuan & Yang Reference Yuan and Yang2015; Li et al. Reference Li, Jahn, Zhao, Dai, Li, Suo, Guo, Wang, Liu, Lan, Zhou, Zheng and Wang2017a, b). The tectonic setting of the Late Ordovician–Early Silurian is controversial. Xu et al. (Reference Xu, Xu, Zhang, Li, Zhu, Qu, Chen, Chen and Yang1994), Feng & He (Reference Feng and He1995) and Zhang et al. (Reference Zhang, Sun and Zhou1997) interpreted the strata as sediments in a relic basin. Xia et al. (Reference Xia, Xia and Xu2003) and Du et al. (Reference Du, Zhu, Han and Gu2004) interpreted the Zhongbao Formation as a foreland basin fill from the presence of Ordovician remnant-flysch. Xiao et al. (Reference Xiao, Brian and Yong2009), Gehrels et al. (Reference Gehrels, Yin and Wang2003) and Zuo & Liu (Reference Zuo and Liu1987) interpreted the Zhongbao Formation as an arc-related basin fill from its sandstone and detrital mode. However, the petrology and geochemistry of volcanic clastics from Silurian sandstones indicate that the sediments were fore-arc basin fill (Xiao et al. Reference Xiao, Brian and Yong2009; Yuan & Yang Reference Yuan and Yang2015). The volcanic rocks and the ophiolite assemblages in the North Qilian Orogen at the Ordovician period indicates the existence of the ocean basin (Du et al. Reference Du, Zhu and Gu2006). The Ordovician stratum are mainly composed of basalt, andesite and pyroclastic rocks. The volcanic lithofacies in the study area are mainly flow facies, while eruptive facies are developed locally. The volcanic rocks are mainly produced as block and pillow lavas. The volcanic rock extends 800 km from E to W, with a maximum thickness of more than 5000 m and a minimum thickness of less than 1000 m. The ophiolite in Qilian Yushigou, Sunan Bianmagou, Dacadaban and the deep subduction complexes in Qilian Qingshuigou represent the subduction complex assemblages of Ordovician oceanic trench–arc systems (Zuo & Liu Reference Zuo and Liu1987; Feng & He Reference Feng and He1995, Reference Feng and He1996; Xia et al. Reference Xia, Xia and Xu1996, Reference Xia, Xia and Xu1998, Reference Xia, Xia and Xu2003; Zhang et al. Reference Zhang, Sun and Zhou1997; Du & Guang Reference Du and Guang2003; Du et al. Reference Du, Zhu, Han and Gu2004). Therefore, during the Ordovician, a typical active continental margin of a trench–arc–basin system was developed in the North Qilian Orogen. The Shihuigou outcrop in the eastern part of the North Qilian orogen was a volcanic island arc belt (Fig. 14) (Du et al. Reference Du, Zhu and Gu2006).
Radiolarians are found in the Ordovician chert of the Shihuigou Section. Radiolarians are characterised by long spines, slender, thin shells and a dense shell line, which indicates a deep-water environment (Wu Reference Wu1986; Feng Reference Feng1992). However, in the Late Ordovician there developed massive stucco limestone containing blue-green algae, crinoid stems and molluscs in the Shihuigou Section, which indicates that there exists a shallow-water sedimentary environment (Du et al. Reference Du, Zhu and Gu2006). The contents of Fe, Mn and Al and the ratios of Al/(Al + Fe + Mn) in the chert samples of the Shihuigou Section indicate that the cherts are biogenic in origin, and we can see the radiolarians in the chert cast sections (Fig. 3), which is consistent with the geochemical signature of the chert. The ratios of (Lan)/(Cen), and the Ce/Ce* values of the chert, reflected a continental margin environment. Ce/Ce* values imply that there is a weak negative anomaly in Ce. In combination with the judging of the chert formation model, we can know that the chert was formed in a deep-water environment, while, at the same time, the chert was also influenced by the continental provenance. This implies that the tectonic setting of the Late Ordovician chert was not a typical continental margin. All of the above facts reflect that in the Late Ordovician the tectonic setting of the North Qilian Orogen was not a typical deep-water basin, nor a typical continental margin, but a multi-island deep-water basin, which was closed to the mainland.
6. Conclusions
Based on the petrographic and geochemical compositions of the chert from the Zhongbao Formation in the Shihuigou Section of the North Qilian Orogen, the following conclusions can be drawn.
The radiolarians in the rock thin section, the Al–Fe–Mn diagram plotting at the non-hydrothermal area and the Si/Si + Al + Fe + Ca ratios have shown the biogenic origin in chert. The geochemical features and the petrographic signatures have shown that the chert was also influenced by terrigenous origin. Sedimentary recycling was not identified during chert deposition, showing no clastic fraction that came from the older sediments. The terrigenous and the biogenic silica constitute the main source of chert in the Late Ordovician.
The deposition of the Late Ordovician chert is mainly affected by tectonic collision and volcanic ash events. During the Late Ordovician–Early Silurian transition, the cohesion and collision between the North Qilian Orogen and its peripheral blocks continued to be intensified, which caused massive volcanic activity. The volcanic activity provides nutrients for the algae and the bacteria. A large number of algae and bacteria provide nutrients for the radiolarians, which provide massive biogenic sources for Late Ordovician chert. The end of the ice age and the continuous subduction of the North Qilian Orogen and its peripheral blocks led to the deepening of the North Qilian Ocean, which resulted in a large area of hypoxia in the Late Ordovician Zhongbao Formation and depositional accommodation for the preservation of chert.
The chert was deposited near the continental margin field, and at the same time, chert was formed in the anoxic deep-water water environment. Therefore, in the Late Ordovician, the tectonic setting of the North Qilian Orogen was not a typical deep-water basin, nor a typical continental margin, but a multi-island deep-water basin, which was closed to the mainland.
7. Acknowledgements
This study was financially supported by the National Natural Science Foundation of China (project number 41772113). We thank the journal reviewers for their very constructive and helpful comments, which helped to improve the manuscript.