INTRODUCTION
U.K. household spending on durable goods in real terms has increased dramatically in recent years, but it has not been matched by a corresponding rise in real expenditure on other goods and services. Hence, the United Kingdom has experienced considerable changes in the composition of consumer expenditure in recent years, which also has been a feature of the U.S. economy. This has important policy implications because consumer spending, which is a key element of aggregate demand, can be influenced by monetary policy through the monetary transmission mechanism. Specifically, the Bank of England varies the short-term government bond repo rate in their attempt to meet the U.K. government's inflation target. Because monetary policy generally affects all interest rates in the same direction, but often by different magnitudes, consumers will adjust their expenditure decisions on durable goods, nondurables, and services, as well as monetary assets, in response to changes in the relative prices or user costs of these goods and assets. Clearly, how monetary policy affects consumption through the monetary transmission mechanism will depend on the differential impact that the repo rate has on the relative price/user cost of goods and assets, and also on the degree of substitution between the various categories of consumption goods and monetary assets.
Because the Bank of England is concerned about the impact of monetary policy on consumer expenditure in the context of inflation targeting, they have recently begun to focus on the composition and determinants of expenditure across durables, nondurables, and services [see Hamilton and Morris (2002) and Power (2004)]. These studies typically assume that expenditure on goods and services is independent from consumer's financial decisions. Furthermore, the degree of substitution between durables and nondurable goods is often assumed to be constant or equal to unity as in Power (2004). The former assumption is rather surprising, given that theoretical work on money demand typically stresses strong links between money and consumption. The traditional role of money as a means of exchange, for example, implies a complementary relationship in demand in the sense that an increase in the demand for consumption goods implies an increased demand for money. This is epitomized in the cash in advance models of Lucas and Stokey (1983, 1987) and Cooley and Hansen (1989). In contrast, the asset demand approach of Friedman (1956) asserts that monetary assets are likely to be substitutes for a wide range of both financial and real assets, including durable goods.
It is the consumer, however, who determines if monetary assets, durable goods, nondurables, and services are substitutes or complements in demand and, hence, this is an empirical issue. In addition, the decision to purchase durable goods is based on the user cost of durable goods relative to the price of other goods and the user cost of monetary assets. Consequently, for the Bank of England to determine how monetary policy will affect consumer spending, the policy maker requires estimates of the substitution between goods and assets, which may well vary over time. It is also important that the elasticities are estimated from monetary and consumption aggregates that are consistent with index number theory and consumer optimization, as in Barnett (1980, 1987).
This study extends the current literature by constructing aggregates for both monetary and consumer goods that are consistent with optimal consumer choices and index number theory, estimating the substitution over time between monetary assets, durable goods, nondurables, and services, and examining the consequent implications for U.K. monetary policy. We follow the nonparametric approach established by Swofford and Whitney (1987, 1988) to test whether data are consistent with utility maximization. This approach has been applied to U.K. data by Patterson (1991), Drake (1997), Drake, Fleissig, and Swofford (2003) and Elger, Jones, Edgerton, and Binner (2005).1
Studies using U.S. data include Swofford and Whitney (1987, 1988), Barnett, Fisher, and Serletis (1992), Belongia and Chalfant (1989), Fleissig and Swofford (1996), Fisher and Fleissig (1997), and Jones, Dutkowsky and Elger (2005).
The failure of simple sum aggregates as reliable indicators for policy has been shown by Fisher, Hudson, and Pradhan (1993) and Handcock (2005). The BOE published its Divisia M4 in 1994 and Federal Reserve Bank of St. Louis published its Monetary Service Index in 1997 [Anderson, Jones, and Nesmith (1997)].
DATA
The quarterly data consist of 25 variables that cover the period 1977:1 through 2005:3 and relate to the U.K. household sector. Unlike many previous studies, we use disaggregated consumption data consisting of 10 components of services expenditure and nine components of nondurables expenditure. In addition, we compute the net stock of durable goods and consider five categories of monetary assets.3
The ONS data are from 1977.1 to 2005.3 and consist of: Nondurables: food and nonalcoholic beverages; alcoholic beverages; tobacco; household utilities (water, electricity, gas, other fuels, etc); furnishings and household equipment; health; transport; recreation and culture; miscellaneous goods and services. Services: clothing and footwear, household utilities (water, electricity, gas, other fuels, etc); furnishings and household equipment; health; transport; communications; recreation and culture; education; restaurants and hotels; miscellaneous goods and services. Disaggregated data are not available for durables goods as no relevant depreciation rates are published. No data on average life lengths or depreciation rates on semidurables are available and, hence, these are omitted from the analysis.

where
is the price of durables,
is the one period inflation rate, and Rt the one period discount rate, which is benchmark rate of interest used in the user cost of monetary assets discussed later.
Liquidity service flows from monetary assets are assumed to be proportional to the real per household stock of monetary asset holdings. We utilize the household sector component asset and interest rate series produced by the Bank of England and, hence, the simple-sum aggregate and Divisia index are consistent with those produced by the Bank of England.4
Data on household sector holdings of monetary assets were obtained on a break adjusted basis from the BOE. The asset categories are: notes and coins; non-interest-bearing sight deposits; interest-bearing sight deposits; bank time deposits; building society deposits (BSD); and correspond broadly to the official M4 money aggregate adopted after the abandonment of £M3 (approximately M4 less BSD) targeting in the 1980s. Annual percentage interest rate data were converted into quarterly returns by dividing by 400. Cash individual savings accounts were introduced by the government in 1999.2 and are not available over most of the sample, so they are omitted from the analysis.
The interest rate series reflect the rates paid to the household sector on the component assets, such as bank interest bearing sight and time deposits. The own rates of return on notes and coins and non-interest bearing sight deposits are taken to be zero but the opportunity cost of holding these assets is not zero. Details of the own rates of return for interest bearing assets are discussed by Fisher, Hudson, and Pradhan (1993) and the Bank of England (2005). The user cost of monetary assets is derived using the approach developed by Barnett (1978) and Donovan (1978), and we follow the methodology of the Bank of England (2005) in respect of using the envelope approach to determine the benchmark rate of return.5
The opportunity cost of the simple sum aggregate is calculated as expenditure (five monetary assets multiplied by their user costs) divided by the simple sum of the monetary assets.
CONSUMER OPTIMIZATION
In a consumer optimization, the agent gains utility from both consumer goods and the service flows from monetary assets, as in Samuelson and Sato (1984), Barnett, Fisher, and Serletis (1992), Fisher and Fleissig (1997), Fleissig and Swofford (1996), Fisher, Fleissig, and Serletis (2001), and Drake, Fleissig, and Swofford (2003). Hence, the utility function consists of vectors of service flows from the 24 variables from the ONS and the Bank of England:

To evaluate if the utility function is consistent with optimal consumer behavior, it is often tested for consistency with the Generalized Axiom of Revealed Preference (GARP) using the nonparametric procedure of Varian (1982). The data violate revealed preference over the sample 1977.1–2005.3, as in Drake and Fleissig (2006). Additional testing established that the data are consistent with GARP over the period 1992.4–2005.3, which implies that there exists a utility function over this sample that rationalizes the data. This sample corresponds with the introduction of U.K. inflation targeting in October 1992 after the exit of sterling from the European exchange rate mechanism in September 1992. Hence, our aim is to analyze substitution between monetary assets and goods over this most recent monetary policy regime.
The elasticities of substitution can be estimated using the U.K. official monetary and consumption aggregates. The drawback of using the official aggregates is that they fail to satisfy statistical index number theory and microeconomic aggregation theory. In particular, Diewert (1976, 1978) linked index number theory and aggregation theory with his superlative index approach. The importance of using superlative indexes has been shown by Barnett (1980, 1982, 1987), who first demonstrated the shortcomings of using the simple sum monetary aggregates instead of Divisia monetary aggregates. Thus, we construct superlative indexes for monetary assets, nondurables, and services using a Divisia index. The intention is to examine for any potential differences in the results based on the official U.K. aggregates and Divisia aggregates. It is important to note in this context that no official Divisia aggregates of consumption goods are published.
It is also important to note that superlative indices of monetary assets and goods should be used in conjunction with a well-specified econometric model to minimize potential violations of what Chrystal and MacDonald (1994) have called the Barnett critique in monetary economics. Thus, we use the Fourier flexible functional form, which is evaluated for violations of regularity conditions, as discussed by Barnett (2002), Barnett and Pasupathy (2003), and Serletis and Shahmoradi (2005).
ESTIMATION OF THE DEMAND SYSTEM AND SUBSTITUTION
The goal of the demand systems approach is to derive and estimate demand share equations and elasticities of substitution from the unknown indirect utility function. In our study, the indirect utility function is approximated using the Fourier flexible form, which has been used in money demand studies by Ewis and Fisher (1985), Fisher (1992), Barnett, Fisher, and Serletis (1992), and Fisher and Fleissig (1997). The Fourier flexible form can approximate the levels and partial derivatives of a continuous utility function globally and give unconstrained estimates of substitution.6
The Fourier flexible form is dense in a Sobolev norm and can asymptotically approximate the levels and partial derivatives of a data generating function accurately, Gallant (1981). A seminonparametric function refers to the use of a truncated series expansion that is dense in a Sobolev norm; see El Badawi, Gallant, and Souza (1983).
Some examples of monetary studies using locally flexible forms include the translog for U.S. data by Ewis and Fisher (1984), Serletis (1987, 1988), and Drake (1992) for U.K. data, and the Almost Ideal Demand System to analyze U.K. data by Barr and Cuthbertson (1991).

where
and {b}, {ujα}, and {wjα} are the parameters to be estimated, x} and p are vectors of the quantities and user costs of nondurables, services, durable stock, and monetary assets, and v = p/p′x is a vector of expenditure normalized user costs. A multi-index, kα, is an n vector of integers denoting partial differentiation of the utility function. The parameters A and J determine the degree of the Fourier polynomials and are determined by empirical testing. The Fourier share equations are

The system of equations is estimated by assuming additive errors which is preferable to multiplicative errors [McElroy (1987)]. Because the budget shares sum to unity the disturbance covariance matrix is singular and Barten (1969) shows that unique maximum likelihood estimates can be obtained by dropping any equation. In the initial estimates, there was positive serial correlation which is a common result, especially in the monetary literature and is also found by Serletis (1988), Fleissig and Swofford (1996, 1997), and Fisher and Fleissig (1997). We follow the approach in these studies and use a first-order autoregressive process
where R = [Rij] is a matrix of unknown parameters and εt is a nonautocorrelated vector disturbance term with constant covariance matrix. Berndt and Savin (1975) show that results will be invariant to which equation is deleted in the estimation by constraining the diagonal coefficients of R to be equal and setting the remaining coefficients to zero. The number of terms included in the Fourier is determined by A and J and the nonlinearity of the data. The upward F-test of Eastwood (1991) was used to determine the degree and number of parameters used for the Fourier polynomials.
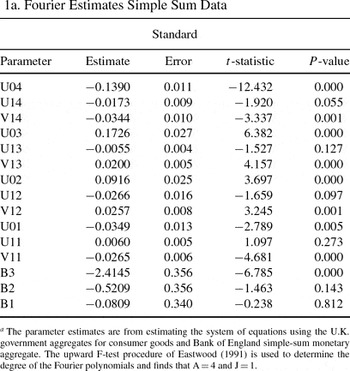
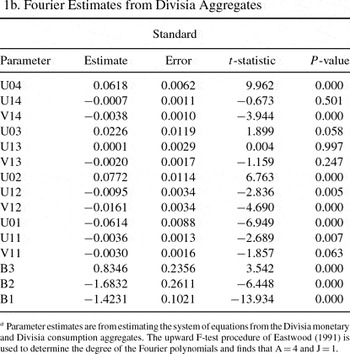
The Fourier flexible form fits the data well giving high R-squares, low mean square errors, and with most of the parameters statistically significant. The full set of parameter estimates is fairly extensive, and the parameter estimates using the ONS/Bank of England and Divisia aggregates are in the Appendix. This study estimates and analyzes Morishima elasticities of substitution between consumer goods and monetary assets, which now will be discussed.
When there are more than two variables, Blackorby and Russell (1989) show that the Allen-Uzawa calculation is incorrect. They show that the Morishima elasticity of substitution
, where si is the share of expenditure from variable i and
are the Allen-Uzawa elasticities of substitution, can be nonsymmetric and gives the correct measure of substitution. The Morishima measure shows that changes in the optimal quantity ratio (xi/xj) in response to changes in relative prices (pi/pj) depend on whether the price change is in the ith or jth coordinate direction and has been used extensively in the monetary literature [Davis and Gauger (1996), Fisher and Fleissig (1997), Drake, Fleissig, and Swofford (1996), and Fisher, Fleissig, and Serletis (2001)].
The possibility of finding nonsymmetric elasticities of substitution is particularly appropriate when analyzing substitution between goods and money. Specifically, changes in the Bank of England's repo rate, to the extent that it affects longer term rates (and, hence, the benchmark rate), will affect both the user cost of durables and the user cost of monetary assets, but not necessarily to the same extent. Hence, any nonsymmetry in substitution between monetary assets and durable goods could have implications for the consumption element of the monetary transmission mechanism.
ESTIMATED SUBTITUTION BETWEEN GOODS AND ASSETS
The focus is on the Morishima estimates of substitution between durables, nondurables, services, and monetary assets, and on the contrasts between estimates from the ONS/Bank of England and Divisia aggregates. Although it is the agent who determines whether categories of consumption goods and monetary assets are substitutes or complements in demand, empirical results may be misleading when using official U.K. consumption and monetary aggregates. Hence, by contrasting the two sets of results, we can ascertain the potential bias in results from using ONS/Bank of England data rather than Divisia aggregates.
Before examining the elasticities of substitution, we evaluate the regularity conditions of the Fourier flexible form. Based on the Divisia data set, the regularity conditions are satisfied as there are no violations of monotonicity, curvature restrictions and all of the estimated shares are positive. Thus, regularity conditions discussed by Barnett (2002), Barnett and Pasupathy (2003), and Serletis and Shahmoradi (2005) are satisfied when the Fourier flexible form is estimated using the Divisia data.8
There were a few violations of monotonicity based on the official U.K. aggregates.
U.K. Monetary and Consumption Aggregates
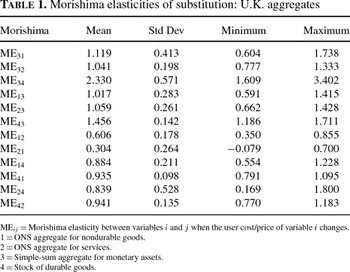
The summary statistics for the Morishima elasticities estimated using the conventional monetary and consumption data are shown in Table 1. The estimates show evidence of both substitution and complementarity in demand for goods and monetary assets. The largest degree of substitution (max 3.402; mean 2.330) is between monetary assets and durable goods (ME34). Services and nondurables (ME21) have the largest degree of complementarity in demand (min − 0.079; mean 0.304).

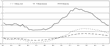
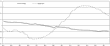
To gain further insight into the results, the estimated substitution between monetary assets and the consumption goods, when changes in the relative user cost/price are a result of changes in the user cost of monetary assets, are displayed in Figure 1. It is evident that monetary assets are substitutes in demand for services, nondurables, and durables. In addition, substitution between monetary assets and durable goods is about twice as large as substitution between monetary assets and nondurable goods or services. It is also clear that there is considerable temporal variation in the estimated elasticities. All the Morishima elasticities exhibit a trend decline before 1997, before increasing markedly between 1997 and 2002. This increase is particularly apparent in the case of the substitution between monetary assets and durable goods (ME34), which increased from 1.6 to 3.4 over this period.

Substitution for simple sum aggregates: changes in the user cost of money.
Divisia Monetary and Consumption Aggregates
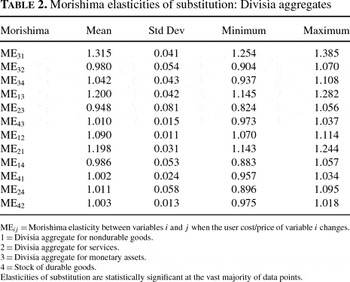
The Morishima elasticities between goods and assets estimated from the Divisia aggregates are shown in Table 2, and differ considerably from the corresponding estimates from the conventional U.K. data. Based on the Divisia aggregates, all assets and goods are unambiguously substitutes in demand. Because there is no evidence of complementarity in demand between monetary assets and goods, these results highlight the potential bias in estimates from using the official aggregated data. Thus, using aggregates that are inconsistent with optimal consumer behaviour can have misleading implications for monetary policy.

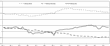
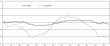
Using the Divisia data, we analyze the estimated elasticities between monetary assets and consumption goods, when changes in the relative user cost/price are a result of changes in the user cost of monetary assets. Although monetary assets and goods are always substitutes in demand, Figure 2 shows that substitution between monetary assets and nondurable goods exceeds substitution involving services and durables.

Substitution for Divisia aggregates: changes in the user cost of money.
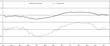
It is also apparent from Charts 1 and 2 that, although money and durable goods are substitutes in demand using the Divisia aggregates, substitution is considerably overstated using the conventional U.K. aggregates. Finally, it is clear from the contrast between Figures 1 and 2 that elasticities based on Divisia aggregates suggest that the degree of substitution between monetary assets and services is experiencing a trend decline over the whole of the sample period. In contrast, the elasticities based on conventional aggregates suggest that, notwithstanding the considerable temporal variation, the degree of substitution between monetary assets and services has actually increased over the sample period. This marked contrast between the two sets of elasticities can be seen more clearly in Figure 3. Specifically, substitution between services and money estimated from the official U.K. aggregates are consistently lower over the sample 1993.1–1999.1, and thereafter exceed the corresponding elasticities estimated from Divisia aggregates over the sample 1999.1–2005.3.

Substitution services and money: changes in the user cost of money.
The results from Table 2 and Figure 2 have important implications in the context of the monetary transmission mechanism. These estimates suggest that monetary policy that increases benchmark yields and the user cost of money will tend to produce a substitution away from monetary assets and into consumption goods, and, particularly, nondurable goods. Furthermore, these consumption substitution effects will tend to offset, at least to some degree, the attempts by the monetary authorities to exert a contractionary impact on consumer expenditure via increases in interest rates. However, it is important to recognize that these offsetting impacts may be relatively modest, even in the case of nondurables, where the degree of substitution with monetary assets is most pronounced. The reason is that any increase in the official repo rate by the Bank of England will tend to have a limited impact on the user cost of money. As short-term interest rates tend to move together, the increase in the repo rate will generally causes an increase in both the benchmark rate and the own rate on interest bearing monetary assets.
It is important to note, however, that this may not apply in the context of durable goods. Any increase in interest rates (associated with contractionary monetary policy, for example) will generally increase the user cost of durables by more than the user cost of monetary assets. Furthermore, the fact that the mean Morishima elasticities are very similar (ME34 = 1.042, ME43 = 1.010) suggests that the substitution from durables to monetary assets will tend to dominate in the context of any policy induced increase in interest rates. Clearly, this will reinforce any credit channel effects in the monetary transmission mechanism emanating from either the availability or cost of credit, which will tend to impact most significantly on durables expenditure. Hence, the results presented in this paper give a new perspective on the importance typically attached by central banks to durable goods expenditure in the context of the transmission mechanism of monetary policy and the policy of inflation targeting.
Substitution between Durables and Nondurables
Given the dramatic recent increase in the real share of durables expenditure (based on official ONS data) a good deal of attention has been focused on the degree of substitution between durables and nondurables in both the United Kingdom and the United States. However, the boost in durable goods spending in constant price terms has not been mirrored by an increase in the current price expenditure share. This is typically attributed to the large decline in the relative price of durable goods, a feature of both the U.K. and U.S. economies. For the United Kingdom, the user cost for durable goods also has decreased in recent years, whereas the stock of durables has increased. As the recent analysis conducted by the Bank of England (Power, 2004) recognizes, this explanation relies on the untested assumption that substitution between durables and nondurables is equal to unity. Power argues, for example, that
There is little or no U.K. micro literature on the elasticity of substitution between durable and nondurablespending. But the U.S. literature suggests an elasticity of substitution around 1. Such an elasticity implies that a 1% rise in the relative price of durable goods will cause demand to shift away from durable goods by 1%. As a result, the nominal expenditure share of durable goods is unaffected by relative price movements. (p. 25)
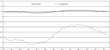
Our study not only provides estimates of substitution between durables and nondurables but also allows this substitution to vary over time in response to changing economic conditions. It is evident from Figure 4 that, although there is some temporal variation, substitution between durables and nondurables have been close to unity over the sample based on the Divisia aggregate for nondurable goods. This is consistent with the findings in the U.S. literature, and with the assumption made by Power (2004). Ogaki and Reinhart (1998), for example, estimate an elasticity of 1.17 for the United States. However, there are clear differences between the estimated elasticities based on the conventional and Divisia aggregates. In particular, whereas the latter elasticities have remained reasonably stable over time, the former have exhibited considerable volatility, ranging from a low of 0.791 to 1.095. Hence, in the context of the policy issues being addressed by the Bank of England, substitution based on conventional U.K. aggregates can produce extremely misleading results.

Substitution nondurables and durables: changes in the user cost of durables.
Substitution between Services and Other Goods
Given the Bank of England's recent focus on consumer expenditure, we now examine substitution between services and other consumer goods. As Figure 5 indicates, services and nondurables are stronger substitutes in demand, when the estimates are based on Divisia aggregates compared to the substitution between services and durables.

Substitution Divisia aggregates: changes in the price of services.
Once again, there is a marked contrast in substitution derived from the different aggregates. It is clear from Figure 6 that for services and nondurables the use of conventional U.K. aggregates results in Morishima elasticities, which erroneously suggest these goods are either modest substitutes or complements in demand in the early part of the sample period. Furthermore, although the estimated degree of substitution does increase somewhat during the late 1990s, it is clear from Figure 6 that this is considerably understated during the whole of the sample period relative to the Divisia estimates.

Substitution services and nondurables: changes in the price of services.
CONCLUSION
This paper provides new evidence on the substitutability between U.K. monetary assets and consumption goods (nondurables, services, and the stock of durables), and substitution between the latter. Although numerous studies estimate substitution between monetary assets, there is a dearth of U.K. studies that analyze substitution between money and consumption. This is somewhat surprising in the light of the recent asset price inflation and increase in consumer indebtedness, especially given the importance of consumption in the monetary transmission mechanism and the recent Bank of England focus on the components of consumer spending, particularly expenditure on durable goods.
In this study, we utilize monetary and consumption data that are empirically consistent with utility maximizing behavior. We use a superlative index to construct Divisia aggregates for monetary assets, nondurables, and services. Although this approach is well established for monetary aggregates, it has not been widely used in the context of consumer goods, where aggregates for consumer data such as nondurables simply reflects the summation of the expenditure on all the relevant subcomponents. In addition, elasticities of substitution are estimated from the Fourier flexible form to limit the potential problems of the Barnett Critique of Chrystal and MacDonald (1994). Furthermore, the Fourier estimates based on the Divisia data satisfy the regularity conditions, an important issue recently highlighted by Barnett (2002), Barnett and Pasupathy (2003) and Serletis and Shahmoradi (2005). In contrast, there are violations of the regularity conditions using the official U.K. aggregates.
The results confirm that conventional aggregates can produce biased and highly misleading measures of substitutability. In contrast, estimating substitution from Divisia aggregates provides elasticities that are likely to be more accurate and therefore more relevant for monetary policy and issues relating to the monetary transmission mechanism. More specifically, the evidence of temporal variability and the fact that the substitution between monetary assets and goods differs across the categories of durables, nondurables, and services, suggests that the traditional monetary/interest rate transmission mechanism may be more complex than has hitherto been appreciated. Second, evidence of substitution away from monetary assets and into services and especially nondurable goods, in response to an increase in interest rates and user costs (and vice versa), suggests that the traditional interest rate channel of monetary policy, whereby increases in interest rates are assumed to reduce interest sensitive expenditures on consumption and investment, may be undermined to some degree. The impact of this effect may well be limited, however, and depends on the extent to which increases in official repo rates cause increases in the user cost of money.
In the case of durable goods expenditure, however, our results suggest that any credit channel effects in the monetary transmission mechanism will tend to be reinforced by the tendency for increases in official repo rates to result in a substitution away from durable goods and into monetary assets. Hence, our results reinforce the importance of durable goods expenditure in the context of both the monetary transmission mechanism and the policy of inflation targeting.
APPENDIX
All estimation was performed using the nonlinear LSQ procedure from International TSP 4.4 with convergence set at 0.00001. Multiple starting values and multi-indexes were used to ensure convergence to the global optimum. Budget shares from the Divisia data are the same as from the actual data.