Nomenclature
-
 $U$
-
upper compartment
-
$L$
-
lower compartment
-
$rel$
-
relative
-
$V$
-
separation velocity
-
$a$
-
acceleration
-
$\alpha$
-
angular acceleration
-
$J$
-
moment of inertia
-
$\omega$
-
angular velocity
-
$\textbf{M}$
-
torque
-
$F$
-
force
-
$s$
-
displacement
-
$r_i$
-
actual value of the deviation parameter
-
$\mu_i$
-
mean deviation
-
$\sigma_i$
-
standard deviation
-
$f$
-
maximum force deviation of springs
-
$\Delta F_i$
-
working force deviation relative to reference spring
-
$\theta_i$
-
force line angle deviation
-
$f_{i,final}$
-
spring residual force deviation


Abbreviations
- Adaboost
-
adaptive boosting
- ADAMS
-
Automated Dynamic Analysis of Mechanical Systems
- ADRC
-
active disturbance rejection control
- RSM
-
response surface method
- SIASE
-
Shanghai Institute of Aerospace Systems Engineering
1.0 Introduction
All types of space shuttles in service still need to be delivered by a carrier into a predetermined orbit after launch [Reference Wang, Nie and Chen1]. Once on orbit, the separation between the shuttle and the carrier is critical to help save fuel and other resources and increase the efficiency and success of the mission, but this process is uncertain and uncontrollable [Reference Hou, Li, Li and Tang2]. There are variables in the performance of the separation device, and once the motion attitude of the separated upper and lower modules is beyond the regulation range of the control system, the whole separation mission will face a great safety risk [Reference Cui, Zhao, Yan, Guo and Li3]. Shown in Fig. 1, the combination of reusable spacecraft complish the seperation mission on orbit. The separation system contains seven sets of active and passive separation thrust resistance, including four sets of separation springs that generate separation thrust, two sets of separation breakers that generate separation thrust before providing separation resistance and one set of separation plugs that provide separation resistance throughout.
It is therefore evident that the study of the dynamics of the spacecraft separation system and the investigation of the reliability and impact of the energy storage device within the separation system [Reference Yue, Yang and Lu4] have been pivotal areas of research within the field of aerospace engineering. Hu X et al. used a multi-island genetic algorithm to optimise the design of separation springs with the objective of separation accuracy [Reference Hu, Chen, Zhao and Yao5]. B. N. Rao et al. systematically described the application of rigid body dynamics in inter stag. The mechanical characteristics of the separation process were dynamically simulated and analysed, providing a basis for the optimised design of the separation system [Reference Rao, Jeyakumar, Biswas, Swaminathan and Janardhana6]. Saman Saki et al. developed an optimised adaptive soft-switching multi-model predictive control strategy for spacecraft attitude control under a wide range of operating conditions, improving the robustness and control accuracy of the system [Reference Saki, Bolandi and Mousavi Mashhadi7]. Wei-Jie Li et al. reviewed the development of on-orbit servicing technologies and discussed key challenges and recent progress in their technical implementation, in particular the application of separation and docking technologies [Reference Li, Cheng and Liu8]. Ding et al. studied the shock mitigation technology during the spacecraft-rocket separation process through numerical simulation and experiment, and the results show that the optimally designed separation mechanism can effectively reduce the shock load and ensure the safety of the separation process [Reference Ding, Zhao, Wang, Sun and Chen9]. Fu et al. proposed a quasi-smooth mode control strategy based on neural network for spacecraft attitude manoeuvre control, which ensures the robustness of the system under the specified performance index [Reference Fu, Liu, Cao and Li10]. Hou et al. designed and experimentally verified a disturbance force application unit to simulate spacecraft separation, and the test results verified the effectiveness and accuracy of the unit in simulating the separation process [Reference Hou, Sun, Li and Tang11]. Lyu et al. investigated a T-S fuzzy attitude control strategy based on intermediate observers, and proposed a hybrid non-fragile control method for the input saturation problem, which improved the attitude control performance of the flexible spacecraft [Reference Lyu, Liu and Yue12]. Hu et al. explored the application of active disturbance rejection control (ADRC) in multi-body spacecraft separation, and ensured the safety and stability of the separation process through a composite control strategy [Reference Hu, Wu, Zhao, Song and He13].
Separation mission of reusable spacecraft on orbit.

At present, the research methods employed to determine the optimal design of the separation system are inadequate, as they fail to provide a comprehensive study of the separation process as a whole. The existing theoretical models lack sufficient complexity, and the environmental conditions under which the system operates are not sufficiently considered. Furthermore, the study of the key parameters of the separation system is inadequate. Luo et al. investigated the autonomous separation dynamics of a spaceborne multi-rigid body system with uncertain parameters, providing theoretical analysis and practical guidance for complex separation systems [Reference Luo, Sun, Wen and Jin14]. Teng et al. put forth a composite optimisation method for the position of the separation spring, integrating angular velocity and external moment [Reference Teng and Jin15].
In order to verify the reliability of the separation performance, parameter sensitivity analyses are carried out with the post-separation spacecraft attitude parameters as the evaluation target.
For example, Cui D et al. used the nonlinear response surface method (RSM) to point out the structural parameters in the rigid envelope [Reference Cui, Zhao, Yan, Guo and Li3] that are significantly sensitive to the spacecraft separation dynamics, but the response surface method itself is a class of agent modelling methods, which approximates the implicit limit state function through polynomials, and is unable to solve the decoupling analysis of the whole spacecraft separation dynamics in the presence of high-dimensional variable parameters effectively. However, the separation process takes place in a highly complex mechanical environment, and in addition to errors in the release efficiency of the energy storage system, errors such as the mass properties and mechanical characteristics of the separation module are also important factors affecting the separation attitude [Reference Hou, Li, Li and Tang2].
The advantage of the Monte Carlo method lies in its suitability for solving problems involving multiple continuous random variables (high dimensions). The Monte Carlo method, based on the gambler’s theory, is a statistical simulation algorithm that randomly samples input parameters to form a sample set, providing approximate solutions through a large number of simulations. Theoretically, the larger the sample size, the closer the results are to the true value.
Adaptive boosting (Adaboost) is an iterative algorithm that employs a training set to train and aggregate multiple weak classifiers into a stronger final classifier. The Adaboost algorithm itself is implemented by varying the distribution of the data, which is based on the correctness of the classification of each sample in the training set and the overall classification of the last sample in the training set. The overall classification accuracy of the last sample determines the weights for each sample. The updated dataset with revised weights is then transmitted to the lower classifier for training purposes. The resulting classifiers are subsequently integrated to form the final decision classifier. The majority of research on the Adaboost algorithm, as well as its applications, is currently focused on classification problems. However, there have also been some emerging applications in regression problems in recent years. In terms of its applications, the Adaboost series is primarily employed in the resolution of two-class problems, multi-class single-label problems, multi-class multi-label problems, large class single-label problems, and regression problems. It learns with the full training sample. The Adaboost classifier enables the exclusion of superfluous features from the training data, thereby focusing attention on the most pertinent elements [Reference Merler, Caprile and Furlanello16–Reference Tsao and Chang18].
2.0 Problem formulation
The evaluation indexes of the separation motion of the upper and lower modules mainly include the relative separation speed, module separation overload, module angular velocity and relative distance. In order to express the above indexes, it is necessary to define the co-ordinate system related to each rigid body of the separation system, in which is the centroid co-ordinate system of modules, and the base co-ordinate system is the centroid co-ordinate system of the lower module. The spacecraft attitude is described by the relationship between the three axes of the spacecraft body co-ordinate system and the three axes of the orbit co-ordinate system, both of them are right-handed orthogonal co-ordinate systems, and co-ordinate systems are given in Fig. 2. X-axis direction as the positive direction of separation.
Coordinate systems of separation motion.

In Fig. 3, red circles represent seven sets of forces, from 1 to 4 are separation springs, 5 and 6 are separation disconnectors, and the separation plug is 7. Because of the deviation between separation springs and the asymmetrical layout of forces, the dissociative motion state of modules might be disturbed. In fact, the mission will be decided failure if the separate velocity can not reach the stated objective that was set for entering orbit, or collision happened between upper and lower module.
Forces distributed on contact surface of modules.

In deriving the kinetic equations, the upper and lower compartment modules are considered as homogeneous rigid bodies. The nonlinear model of separation system of reusable spacecraft contains input and output relationship of multiple parameters. According to the dynamics of the spatial motion multi-rigid body system, where the descriptive equations for the main parameters are as follows Newton-Euler equations [Reference Aslanov, Kruglov and Yudintsev19]:
-
1) Relative separation speed between modules
 \begin{align}{V_{rel}} = {V_U} - {V_L} \\[-24pt] \notag \end{align}
 ${V_U}$
,
 ${V_L}$
are the centre-of-mass velocities of the upper and lower module, the upper module velocity
 ${V_U}$
for example:
 \begin{align}{V_U} = \int\limits_0^t {{a_U}dt} \end{align}
 ${a_U}$
is the centre-of-mass acceleration of the upper module:
 \begin{align}{a_U} = {\dot V_U} = \frac{{{F_U}}}{{{m_U}}} \\[-30pt] \notag \end{align}
 \begin{align}{F_U} = \sum\limits_{i = 1}^7 {{f_i}} \end{align}
-
2) Angular acceleration of separation of the upper module
 \begin{align}{J_U} \cdot {\dot \omega _U} + {\omega _U} \times \left( {{J_U} \cdot {\omega _U}} \right) = {{\bf{M}}_U} \\[-25pt] \notag \end{align}
 \begin{align}{\alpha _U} = {\dot \omega _U} = \frac{{{{\bf{M}}_U}{\rm{ - }}{\omega _U} \times \left( {{J_U} \cdot {\omega _U}} \right)}}{{{J_U}}} \\[-30pt] \notag \end{align}
 \begin{align}{{\bf{M}}_U} = \sum\limits_{i = 1}^7 {{{\bf{M}}_{U,i}}} \\[-30pt] \notag \end{align}
 \begin{align}{{\bf{M}}_{U,i}}={r_{U,i}} \times {f_i} \\[-25pt] \notag \end{align}
 \begin{align}{r_{U,i}}={D_{U,i}}{\rm{ - }}{C_U} \\[-25pt] \notag \end{align}
 \begin{align}{\omega _U} = \int\limits_0^t {{\alpha _U}dt} \\[-25pt] \notag \end{align}
-
3) Overload of separation of lower module
 \begin{align}{a_L} = {\dot V_L} = \frac{{{F_L}}}{{{m_L}}} \\[-25pt] \notag \end{align}
 \begin{align}{{\rm{g}}_L} = \frac{{{a_L}}}{G} \\[-25pt] \notag \end{align}
-
4) Relative distance between upper and lower module
 \begin{align}\Delta s = {s_U} - {s_L} \\[-25pt] \notag \end{align}
 \begin{align}{s_U} = \int_0^t {{V_U}d} t \\[-25pt] \notag \end{align}
 \begin{align}{s_L} = \int_0^t {{V_L}d} t \end{align}
Using the dynamics simulation technology of Automated Dynamic Analysis of Mechanical Systems (ADAMS) software, we import the simplified combined model of the separated system into it and directly solve the attitude parameters after separation. We mainly focus on the overall separated attitude of the upper and lower modules, and perform Boolean operations on the upper and lower modules separately after importing into ADAMS to reduce the number of parts in the overall model. In ADAMS, in addition to the local coordinate system of the part, there is a global coordinate system that coincides with the above coordinate system.
3.0 Dynamic simulation of spacecraft separation event
The upper and lower modules are separated by a series of components, including springs, a separation plug and disconnectors. The seven sets of external forces, as well as the contact surfaces that may generate contact between the upper and lower modules, were set up using the ADAMS built-in dynamics model and the mathematical and displacement function statements in the runtime function.
The separating direction of the upper module is positive, i.e. in the direction of the X-axis, and the force between the upper and lower modules mainly consists of the spring force generated by the four sets of springs, which is a positive separating thrust for the upper module and a reaction force of opposite magnitude and direction for the lower module.
There are two sets of disconnectors between the upper and lower modules. The disconnectors provide a thrust to the upper module at the beginning of the separation section, 0–0.01 m, and a resistance to the upper module at the end of the separation section, 0.01–0.0442 m, and the forces acting on the lower module are equal in magnitude and opposite in direction.
In addition to the above seven sets of external forces, there is a separating plug between the upper and lower modules, which produces a separating resistance on the upper module when the relative displacement distance between the upper and lower modules reaches 0.01, with a value of 80 N, which rapidly decreases to 0 after the displacement increment reaches 0.002 m.
It is the work of this section to transform the force under the above conditions into a time-varying function and to introduce the numerical model of the separation system for calculation. In addition, it should be noted that the disconnectors and seperation plugs do not have a deviation from the line of force.
According to Figs. 4 and 5, it can be analysed that the initial force of the separation spring acting on the upper module is 2102 N, i.e., the preload is 2102 N. The force decreases linearly from 0 to 0.1073 s, and the value is 533.5 N at 0.1073 s. The spring force no longer decreases after that, and it can be concluded that its time of action is 0.1073 s, and it is 0.1073 s for the ideal working condition.
Upper module separation attitude.

Lower module separation attitude.

It can be seen that the separation spring separation thrust has a large influence on the separation attitude of the upper and lower modules, and the asymmetric spring layout has a cross-strong external moment on its Y-axis, which generates a certain angular acceleration and angular velocity, and then generates angular displacement. And the angular velocity, relative velocity, and separation overload between the upper and lower modules can be used as the evaluation indexes of the separation performance to analyse the reliability and parameter sensitivity of the spacecraft separation dynamics performance.
4.0 Numerical analysis simulation results
After the verification of model accuracy and reasonableness, this section brings a new method to assess the reliability and sensitivity analysis of spacecraft whole star separation performance based on Monte Carlo method.
Model with deviation parameter
 \begin{align} f{({r_i})_{({r_{i\min }} \le x \le {r_{i\max }})}} = \int\limits_{{r_{i\min }}}^{{r_{i\max }}} {\frac{1}{{\sqrt {2\pi } \cdot {\sigma _i}}}{e^{ - \frac{{{{({r_i} - {\mu _i})}^2}}}{{2{{({\sigma _i})}^2}}}}}d{r_i}} \end{align}
Where
 ${r_i}$
is the actual value of the deviation parameter,
 ${\mu _i} $
and
 ${\sigma _i} $
are the mean and standard deviation, respectively, assuming that the upper and lower limits of the inputs are
 ${r_{i\min }} $
and
 ${r_{i\max }} $
, respectively. then its mean value can be derived, which is:
 \begin{align}{\mu _i} = \frac{1}{2}({r_{i\min }} + {r_{i\max }}) \end{align}
According to the principle of
 $3\sigma $
, the standard deviation can be found to be:
 \begin{align}{\sigma _i} = \frac{1}{6}({r_{i\min }} - {r_{i\max}}) \end{align}
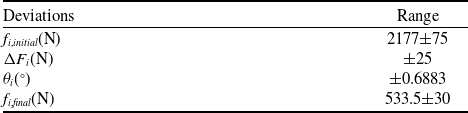
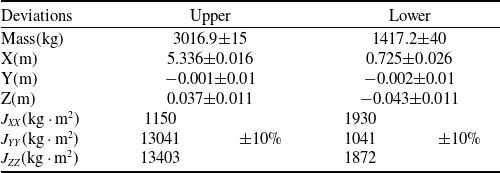
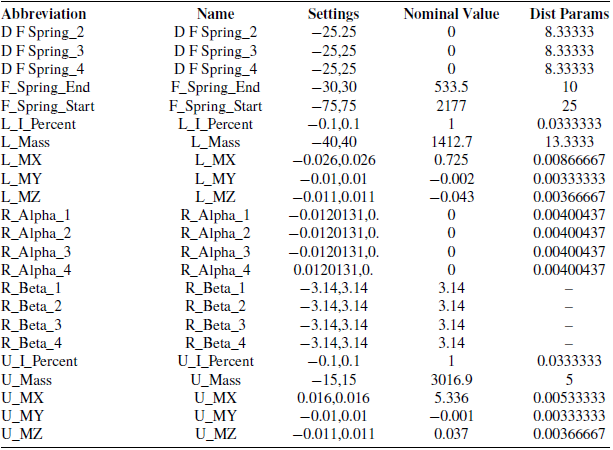
The deviation parameters are specified in Tables 1 and 2, starting with the internal deviations of the separation system.
Internal deviations of the separation system

*The variable distribution probabilities all follow a normal distribution
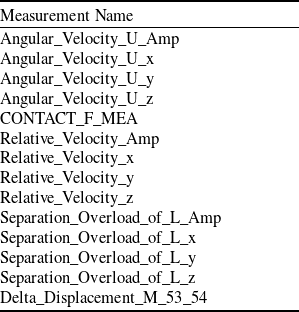
Measurement objects are established for the performance indicators that are to be observed and collected, and they can be observed during the simulation process, with the specific names corresponding to those shown in the Table 3.
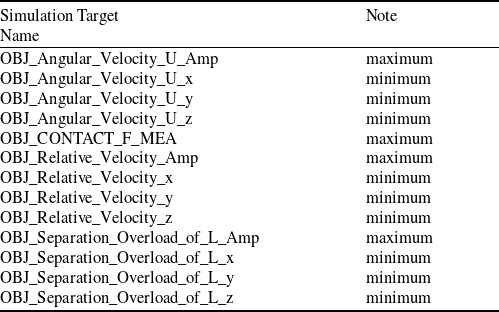
Establish the simulation target that needs to collect data, the name of the simulation target, and the type of data to be collected during the simulation as shown in the Table 4.
Deviation of quality characteristics

*The variable distribution probabilities all follow a normal distribution
Measurement objects

Simulation target

The last step in setting up the simulation test is to create a simulation script. Due to the large number of model components, simulation model variables and simulation objectives, the calculation process is complex, so after several rounds of comparison, the optimal script termination time and step size were finally determined, where the termination time is 0.2 s and the step size is 0.01 s.
A key step in the design of the experiment within ADAMS insight is the setting of the sampling parameters, where the variables set in the previous section are added to the experimental influences and a random sample is set.
A normality test on the sample set generated by ADAMS found that the random sample data set generated by the set variables followed a normal distribution.
Separation parameters meet the performance index calculation
After completing the experimental design, the simulation test is run. This simulation test is a total of 3000 rounds of cycle, time 4 hours and 47 minutes. After each simulation, the programme will automatically collect the simulation target parameters are specified as follows:
Overview of angular velocity

Overview of relative velocity

Distribution of relative separation velocity data between upper and lower modules.

Normality test for relative separation velocity between upper and lower modules.

Relative separation speed between modules
The performance index of the relative separation velocity between the upper and lower modules is ≮0.4 m/s. According to the simulation model, it can be inferred that the main source of angular velocity is the spring group, disconnector and separating plug fixed between the upper and lower modules, and the thrust resistance generated between the two compartments at the stage of separation, as shown in the scatter diagram of angular velocity amplitude generated after randomly hitting the target 3,000 times, Table 5 is a overview of angular velocity, Figs. 6 and 7 describe the data distribution:
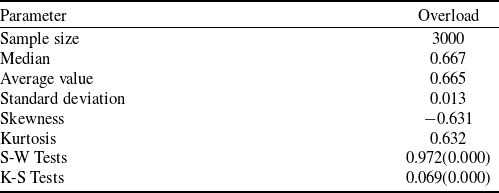
According to the results measured by the simulation target of the relative separation velocity between upper and lower modules, it can be seen that the relative separation velocity between upper and lower modules is mainly distributed in the x-direction, and the data show a spindle-shaped distribution, with less on both sides and more in the middle, mainly concentrated near 0.667 m/s.
The data are further tested and analysed for normality.
It can be seen that the relative separation speed data between upper and lower modules basically conforms to a normal distribution. The specific data are shown in the Table 6.
Random target shooting calculations show that the relative separation amplitude between the upper and lower modules is in the range of [0.612,0.707], and its performance specification is ≮0.4 m/s, so it satisfies the performance specification.
Angular acceleration of separation of the upper module
The upper module separation angular velocity performance index is required to be ≯1.2 deg/s. According to the simulation model, it can be inferred that the main source of its angular velocity is the y-direction tilting force brought by the asymmetric design of the spring, and the angular velocity dataset generated after 3,000 times of random target hitting is shown in Fig. 8.
Distribution of separation angular velocity data for the upper module.

Upper module separation angular velocity normality test.

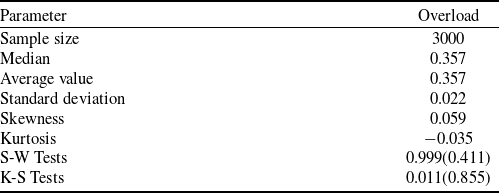
According to the results of the separation angular velocity of the upper module, it can be seen that the separation angular velocity of the upper module is mainly distributed in the y-direction, and the data show a spindle-shaped distribution, with less on either side and more in the middle, mainly concentrated around 0.357 deg/s.
The data are further checked and analysed for normality in Fig. 9.
It can be seen that the separation angular velocity data of the upper module basically conforms to the normal distribution. The specific data are shown in the Table 5.
Random target shooting calculations show that the upper module separation angular velocity amplitude range is [0.282,0.43], while its performance specification is ≯1.2 deg/s, so it meets the performance specification. The overview of Overhold is shown in Table 7.
Overload of separation of lower module
The separation overload performance index of the lower modules is required to be ≯0.7 g, and according to the simulation model, it can be assumed that the overload mainly comes from the spring group, disconnector and separation plug fixed between the upper and lower modules, and the thrust resistance to the two compartments in the separation stage, as shown in Fig. 10. The separation overload data set of the lower modules generated after 3,000 times of random target hits.
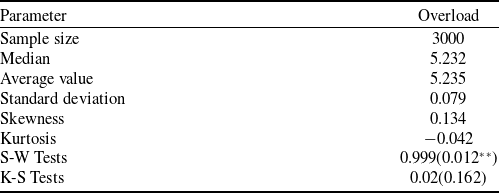
According to the results of the lower module separation overload simulation target, it can be seen that the lower module separation overload is mainly distributed in the x-direction, and the data show a spindle-shaped distribution, with fewer on both sides and more in the middle, which is mainly concentrated around 5.228 m/s2.
The data are further tested and analysed for normality in Fig. 11.
Random target calculations show that the lower module separation overload amplitude is in the range [4.51,5.997], while its performance specification is ≯0.7 g (6.86 m/s2), so it meets the performance specification.
Collision analysis
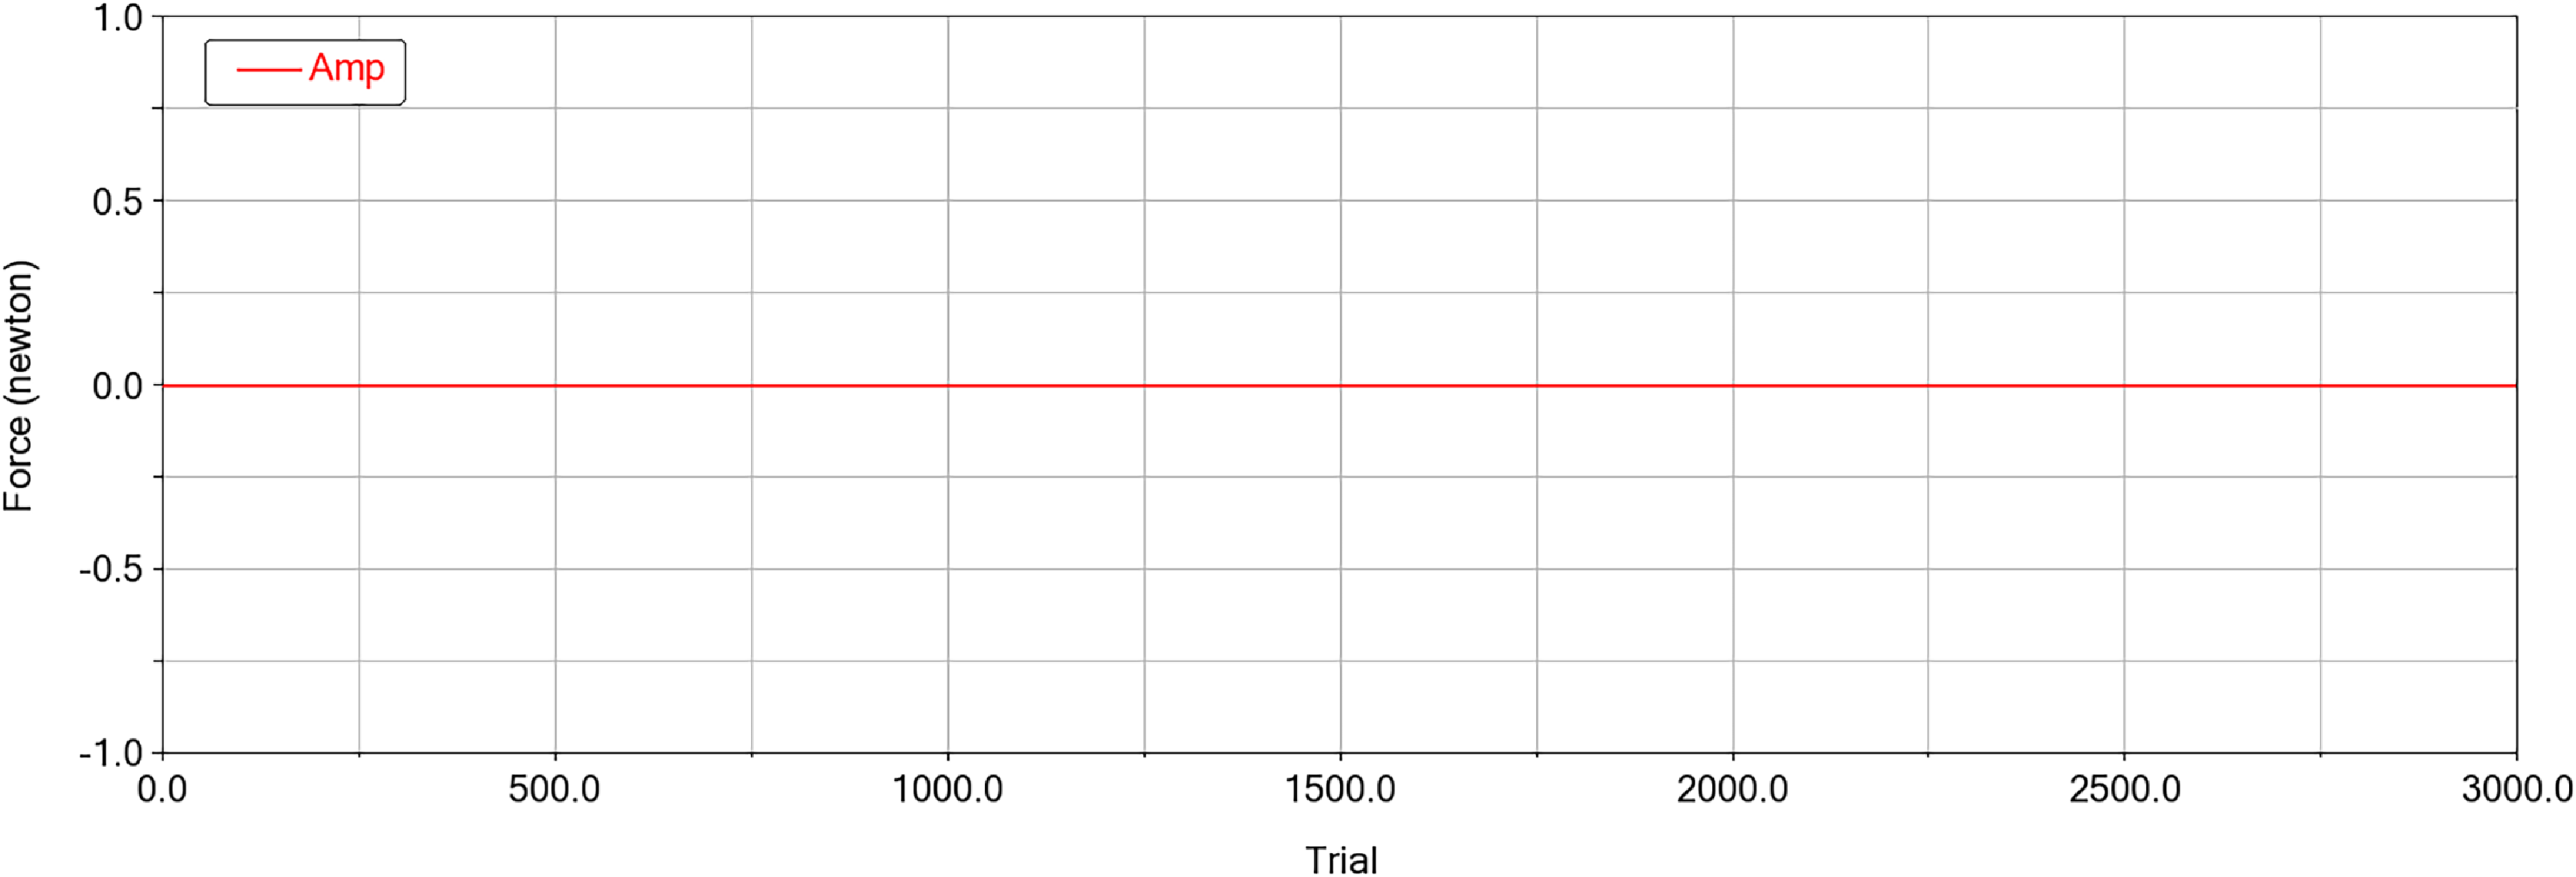
In this paper, the safety and success of the separation process is assessed by measuring whether or not the contact force is generated between the main components of the upper and lower modules.
From the above Fig. 12 it can be concluded that the contact force between the upper and lower modules was always 0 during the simulation of the 3000 rounds. Therefore, it was judged that all simulated rounds were safely and successfully separated.
It can be seen in Fig. 13 that the on-orbit separation performance of the separation system fully meets the design requirements and its reliability reaches 100%.
Lower module separation overload data distribution.

Lower module separation overload normality test.

Upper and lower modules collision detection.

Separation performance distribution.

Adaboost regression algorithm steps.

Dynamic change of separation gap
The core of reliability assessment for separation based on the separation gap between upper and lower cabin modules lies in analysing whether the gap between modules during the separation process meets the requirements of collision-free and smooth separation, which necessitates the integration of multi-dimensional data to quantify the correlation between the gap and reliability.
5.0 Parameter importance analysis based on adaboost regression
The Adaboost regression algorithm gives a high weight to learners with a low error rate and a low weight to learners with a high error rate, combining the weak learners and the corresponding weights to generate strong learners. The difference between the regression and classification algorithms is that the error rate is calculated in a different way. Classification problems generally use a 0/1 loss function, while regression problems generally use a squared loss function or a linear loss function.
Overview of overload

The AdaBoost algorithm can be used not only for classification tasks but also for regression tasks. In this section, the parameter set of separation dynamics formed by ADAMS simulation is used to analyse the degree of influence of error inputs obeying normal distribution on the performance of the spacecraft separation system based on Adaboost regression.
Suppose there is a dataset that consists of m samples as follows:
 \begin{align} D = \big\{ {\left( {{x_1},{y_1}} \right),\left( {{x_2},{y_2}} \right), \ldots ,\left( {{x_m},{y_m}} \right)} \big\} \end{align}
Among them,
 ${x_i} \in {{\bf{R}}^d} $
, means each sample data has d features,
 $ {y_i} $
is the target value. The specific steps of the AdaBoost regression algorithm are as follows in Fig. 14.
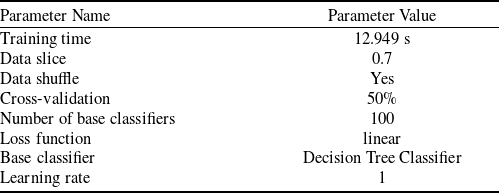
Take relative velocity as an example. The model parameters are set as Table 8.
Regression model parameterisation

The existing separation performance data is sliced and reorganised for training and testing through three steps: data slicing, data shuffling and cross-validation.
In the following Fig. 15, the prediction evaluation metrics of the cross-validation set, the training set and the test set are shown to measure the prediction effect of Adaboost through quantitative metrics. Among them, the evaluation metrics of the cross-validation set can continuously adjust the hyperparameters to get a reliable and stable model. Tables 9–11 shows the module assessment results of seperation parameter.
From the analysis results in Fig. 16, it can be seen that the maximum preload of the separation spring has a significant effect on the separation overload of the lower module and the relative separation speed of the two modules, which are 60.50% and 46.70%, respectively, followed by the mass of the lower module, which is 37.60% and 22.70%, respectively; the variables that have significant effects on the angular speed of the upper module separation are the Z-axis coordinates of the centre of mass of the upper module and the rotational moment of inertia of the upper module, which are 22.20% and 22.20%, respectively. 22.20% and 29.40%, respectively.
Adaboost regression prediction.

6.0 Conclusions
This paper analyses the reliability and design variable sensitivity of the spacecraft separation system by using Monte Carlo methods. The kinematics and dynamics of the separation system are investigated, the actual model and separation of the upper and lower modules are analysed using numerical analysis and simulation models, and the separation dynamics model of the upper and lower modules, which contains 23 groups of variables and 12 groups of targets, is built in the ADAMS multibody dynamics software. The study demonstrates that the relative separation velocity amplitude between the upper and lower modules is in the range of [0.612,0.707] m/s, the upper module separation angular velocity amplitude range is [0.282,0.43] deg/s, the lower module separation overload amplitude is in the range [4.51,5.997] m/s and all simulations show that the separation process is collision-free.
Module assessment results of relative velocity

Module assessment results of angular velocity

Module assessment results of separation overload

Parameter sensitivity distribution.

It can be concluded that the maximum preload of the separation spring, the mass of the lower module, the Z-axis coordinates of the centre of mass of the upper module and the moment of inertia of the upper module have a great influence on the separation dynamics of the spacecraft, and the design and manufacture should focus on reducing their error ranges, so as to obtain a more accurate evaluation of the performance of the separation system.
7.0 On-orbit validation
In December 2024, the reusable spacecraft studied in this article, developed by the Shanghai Institute of Aerospace Systems Engineering (SIASE), was released on orbit for separation and successfully operated, and the actual measured values of the angular velocity of the spacecraft and the overload of the lower module during the separation process fell within the prediction intervals of the Monte Carlo stochastic target. They also met the design specifications for separation performance. During the actual on-orbit separation mission, the assembled body has a trace initial angular velocity in the pitch, roll and yaw directions, which is input into the model built in this paper, and the output results still have stability and reliability.
Acknowledgments
This study was supported by a grant from the Postgraduate Research & Practice Innovation Program of Jiangsu Province (SJCX25_0161), ‘Separation System of Heavy Launch Vehicle Interstage with Non-Fireworks Low Impact Belt Connection’. And Open Project of National Key Laboratory of Aerospace Mechanism (2025ASM-ZN10), ‘Research on preload gradual release or stepwise release technology’.
Appendix
Random sampling setup for variables obeying normal distribution