Implications
The aim of this study was to increase the current knowledge on nutritional values of sugarcane (SC) products and by-products. Our results provide original data especially for digestibility values of nutrients and energy values of SC juice and ground SC. In particular for ground SC, our results suggest that the digestive utilisation of nutrients and energy was closely dependant on changes in the individual feeding behaviour. From this point of view, additional studies are warranted to test if the genotype (local v. exotic breeds) could affect the digestive utilisation of ground SC. Data obtained in this study should also allow practical feed formulation of mixed diets for pig production from chemical characteristics of these SC products. In particular, these data should be essential to define a dynamic model to analyse the bio-technical and socio-economic interactions in mixed farming systems based on the use of SC as an energy source in the diet. However, SC products, particularly juice and ground SC that contains juice, are easily fermentable stuffs. Therefore, care must be taken to avoid fermentation of these materials, as it would alter their nutritional value.
Introduction
Cereal grains which are the basis of livestock production in the more-developed countries face a competing demand to feed the increasing human population (Preston, Reference Preston1995). This scenario will give opportunities to alternative feeds that can replace cereals in livestock diets. Sugarcane (SC) is a perennial tropical crop with a high-energy yield per unit area (80 tons dry matter (DM)/ha; Preston and Leng, Reference Preston and Leng1989). In several tropical countries (Cuba, Dominican Republic, Costa Rica, Guadeloupe, Vietnam), many studies and development of feeding strategies for pig production have been based on the use of this local resource and/or its by-products. Most studies were focused on the growth performance obtained when pigs were fed SC-based diets, especially as juice or molasses but also as ground cane stalks (Preston et al., Reference Preston, MacLeod, Lassota, Willis and Velazquez1968; Gonzàlez et al., Reference Gonzàlez, Gonzàlez, Ojeda, Machado and Ly2006; Xandé et al., Reference Xandé, Despois, Giorgi, Gourdine, Archimède and Renaudeau2009). The determination of digestible and metabolisable energy (ME) values of these SC products is a first step to their evaluation as feedstuffs for pig feeding. However, there is little information on nutritional values of SC products available that can allow practical feed formulation of mixed diets. Regarding those products, digestive utilisation of SC molasses in pigs is the most described in the literature (Ly and Preston, Reference Ly and Preston1969; Christon and Le Dividich, Reference Christon and Le Dividich1978; Bayley et al., Reference Bayley, Figueroa, Ly, Maylin and Perez1983). In contrast, little is published about the digestive utilisation of nutrients and energy of SC juice and ground SC stalks.
In SC production area, small scale farmers traditionally use whole or chopped SC as a feeding source for pigs (Bravo et al., Reference Bravo, Lasso, Esnaola and Preston1996). The Caribbean native pigs, that is, Creole (CR) pigs are well-known for their rusticity and according to their low nutrient requirements (Renaudeau et al., Reference Renaudeau, Bocage and Noblet2006), they are likely to have comparative advantages over ‘exotic’ high-performance genotypes, when the feeding system is based on unconventional feedstuffs such as SC products and by-products.
The objectives of our study were: (1) to measure the in vivo total tract digestibility of dietary energy or nutrients of SC final molasses, SC juice and ground SC stalks in growing CR pigs, (2) to measure in vivo the effect of increased inclusion rates of SC juice or ground SC stalks in the diet, on total tract digestibility values in growing CR pigs.
Material and methods
Care and use of animal were performed according to the certificate of authorisation to experiments on living animals, number A-971-18-01 (issued by the French ministry of agriculture to the head of the experiment unit).
Experimental design and animal management
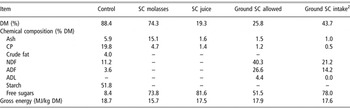
Nutritional values of SC products (final molasses, juice and ground cane stalks) were studied on a total of 24 castrated CR pigs at the experimental facilities of the Institut National de la Recherche Agronomique in Guadeloupe (latitude 16°N, longitude 61°W). The experiment was conducted in two replication of 12 pigs each. Within each replication, three blocks of four littermates were chosen where each littermate was randomly assigned to one dietary treatment. All in all, 6 replicates per dietary treatments were obtained. At about 30 kg BW, pigs were moved to individual digestibility cages in an open front experimental room. Climatic parameters were not controlled and followed those of the outdoor conditions. Nutritional values of SC products (final molasses, SC juice and ground SC) were studied in three consecutive experimental trials. The first trial was designed to measure the effect of a constant rate (23% on a DM basis) of incorporation of SC products (SC molasses, SC juice and ground SC) in a control soybean meal-corn diet (19.8% DM of CP and 16.6 MJ DE/kg DM; DE, digestible energy) on feed digestibility. The second and the third trials were designed to determine the effects of increasing rates of inclusion of SC juice and ground SC on digestibility of nutrients and energy. Within each trial, pigs were adapted to the diet for 10 days before total collection of faeces and urine for 8 days. During the adaptation and the collection periods, the amount of feed offered daily was 35 g DM/kg per BW. The basal diet was a commercially available pig-grower feed in pellet form (Table 1). The molasses were also produced commercially (Gardel SA, Moule, Guadeloupe, French West Indies). Twice a week, 1 ton of fresh SC was delivered to our experimental facilities, cleaned and milled for juice production or ground in small size particles (less than 1 cm). The SC juice and the ground SC were stored at 4°C to prevent any fermentation reactions. The average chemical composition of the SC products is presented in Table 1. For each experimental trial, one littermate was fed with the control diet and the other three littermates were fed with an experimental diet in which a constant (trial 1) or a gradual amount (trials 2 and 3) of the control diet was replaced by a SC product. The experimental diets were prepared by mixing molasses, SC juice or ground SC with the basal diet (8, 8 and 13 g DM/day per kg BW; trial 1), various amounts of SC juice with basal diet (8, 16 and 24 g DM/day per kg BW; trial 2), and various amounts of ground SC with basal diet (13, 26 and 39 g DM/day per kg BW; trial 3) just before feeding. For ground SC, the following protocol was applied for the distribution of the diet: first, the control diet was distributed and once it was completely consumed, the ground SC was distributed. According to Xandé et al. (Reference Xandé, Despois, Giorgi, Gourdine, Archimède and Renaudeau2009), with a ground SC diet pigs show a specific ‘sucking-spitting’ feeding behaviour and the DM extraction rate, that is, DM intake/DM offered, of ground SC averaged 62%; this ratio was taken into account in order to allow a constant DM intake of SC products (i.e. 8 g DM/day per kg BW; trial 1) or a similar variation of DM intake from ground SC in trial 3 than from SC juice in trial 2 (8, 16 and 24 g DM/day per kg BW). Between each experimental trial, each littermate was randomly assigned to one dietary treatment. All animals had free access to water from one individual low-pressure nipple drinker.
Chemical composition of the control diet and the SC productsFootnote 1

SC = sugarcane; DM = dry matter.
1 Mean chemical composition measured on a total of 18, 6, 24 and 24 samples for the soybean meal-corn control diet, SC molasses, SC juice and ground SC, respectively.
2 Average values calculated from results obtained during trials 1 and 3 according to the difference between measured values of ground SC allowed and refusals.
Measurements
All the pigs were weighed at the beginning and at the end of the adaptation period, and at the end of the collection period. Every morning, any feed refusal and spillage were collected. Samples of allowed feed and refusals were dried at 103°C for 24 h to measure the DM content. One sample of the control diet was also taken daily and pooled at the end of the sampling period for DM determination and further chemical analyses. Samples of molasses, SC juice and ground SC were daily and individually collected, stored at −20°C and pooled at the end of the collection period. One representative sample of SC products was dried at 65°C for 96 h for further chemical analyses. During the 8-day collection period, faeces and urine were daily and individually collected and stored at 4°C. Urine was collected into a flask containing sulphuric acid (0.1 Nitrogen (N); 10% v/v) in order to avoid ammonia losses during collection and storage. Faeces and urine were separately weighed, homogenised and sub-sampled at the end of the collection period for analysis (digestibility sample). One faeces sample was heat dried (48 h at 103°C) for DM determination and the second was freeze-dried for further chemical analyses.
Chemical analyses
The diet samples were analysed for DM, ash, organic matter (OM), crude protein (CP, N × 6.25), ether extract (EE) and starch, according to the AOAC methods (AOAC, 1990), for free sugars according to Tollier and Robin (Reference Tollier and Robin1979) and for gross energy (GE) content using an adiabatic bomb calorimeter (IKA, C5000, Staufen, Germany). Dry faecal samples were analysed for DM, ash, EE and CP and fresh samples of urine for N. Cell wall components (NDF, ADF and ADL) in diet samples were determined according to the Van Soest and Wine method (Reference Van Soest and Wine1967).
Calculations and statistical analyses
From the results of the digestibility trial, apparent digestibility coefficients (DC) of DM, OM, CP, ash, EE, free sugars and energy were calculated for each pig. In the case of ground SC, it was expressed relative to allowance or intake quantities. DE content was estimated as the difference between measured GE and estimated energy loss in faeces (Noblet, personal communication).Footnote 1 ME content of diets was calculated as the difference between DE and energy loss in urine estimated from N loss (g/day) according to the equation of Le Goff and Noblet (Reference Le Goff and Noblet2001).Footnote 2 N retained was obtained as the difference between N intake and N losses in faeces and urine.
In a first approach, we statistically controlled that measurements performed in trials 2 and 3 were not affected by the dietary treatment offered in trials 1 and 2, respectively. For that purpose, we used the MIXED procedure of SAS (1997) with an unstructured variance co-variance matrix. According to Wald Z test (SAS Institute, 1997), the covariance estimates were not significantly different from zero. We concluded there was no correlation between two successive measurements carried out on the same animal, suggesting that the adaptation period allowed suppressing the remnant effects. Then, in a second approach, we analysed the results obtained for each trial independantly using an ANOVA (Proc GLM, SAS Institute, 1997) including the effects of diet, replicate, block within replicate and the interaction between diet and replicate. Comparison of means was performed according to the PDIFF option using Tukey test for contrasts (SAS Institute, 1997). In trial 1, the digestive utilisation of SC products was calculated according to the difference method (Noblet and Shi, Reference Noblet and Shi1994). Assuming that energy and nutrient digestibility of the control diet was constant in the experimental diets, we calculated DC of energy and dietary chemical fractions of SC products from the rate of incorporation in feed and the DC of control and mixed (control + SC products) diets. For trials 2 and 3, linear or quadratic regressions between DC measured on complete diet and rate of incorporation of SC juice or ground SC were calculated. According to that chemical composition of allowed and intake feed for dietary treatments including ground SC, DC of ground SC were calculated on a intake basis (method 1) and allowance basis (method 2).
Results
General aspects and chemical composition of the dietary ingredients
One pig fed diet 4 (control + ground SC) was removed during the first replicate of trial 1 after 5 days of sampling period because of leg problems, which had consequences on its daily consumption. For trial 2, this pig was replaced by a littermate pig with a similar initial BW. The results obtained with another pig fed diet 2 (control + molasses) during the second replicate of trial 1 were removed from the ANOVA because of 2 days of diarrhoea observed after the 5th day of sampling period. This pig was successfully treated and then used in the following two trials. For both replicates, sampling period in trial 3 lasted only 7 days instead of 8 days for practical reasons (day off in the first replicate), and weather reasons (tropical hurricane in the second replicate).
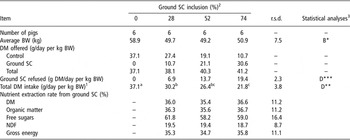
As shown in Table 1, ground SC refusal composition was obviously different from allowed ground SC composition, with a chewed aspect (trial 1 and 3). With ground SC, pigs showed a peculiar feeding behaviour: they chew the cane stalks to extract the juice and then spit out most of the fibrous residue. In connection with a ratio intake/allowance for ground SC DM of 50.8%, the composition of DM intake from ground SC was different from the DM composition of ground SC offered; NDF and ADF contents decreased from 40.3% to 21.2% and from 26.6% to 14.2%, respectively, while free sugar contents increased from 51.5% to 78.0%. In addition, the amount of ground SC refusals linearly increased when ground SC allowance increased from 0% to 74% of total feed offered (trial 3; Table 6). Then, expressed as a percentage of ground SC allowance, DM extraction rate from ground SC (DM intake/DM allowed) was maintained constant and averaged 36%. In SC products, measured GE was numerically lower in SC molasses than in SC juice and ground SC allowed and intake (15.7 v. 17.7 MJ/kg DM, respectively).
Effect of SC products on total tract digestibility of energy and nutrients (trial 1)
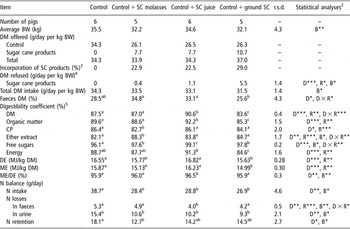
According to the experimental design, there was no statistical difference for average BW and total DM intake (P > 0.05) between diets (33.6 kg BW and 33.1 g DM/day per kg BW, respectively) during the first trial (Table 2). In this trial, the faeces DM was not affected by the inclusion of SC products in the control diet (P > 0.05). The incorporation of molasses did not significantly affect the total tract digestibility of DM, OM and energy when compared with the control diet. However, DC of CP was lower (82.7% v. 86.4%; P < 0.01) and DC of EE and sugars were higher than in the control diet (88.3% v. 82.1%, P < 0.05; and 97.6% v. 96.1%, P < 0.001, respectively). In comparison with the control treatment, the inclusion of SC juice in the diet increased DC of DM, OM, free sugars and energy (P < 0.001). For the experimental diet in which a fraction of the control diet was replaced by ground SC, DC of nutrients and energy were calculated on nutrients or energy intake basis; when compared to the control diet, the DC of DM, OM and energy were significantly reduced (83.6% v. 87.5%, 85.3% v. 89.6% and 84.6% v. 88.7%, respectively; P < 0.05). The ME/DE ratio was not affected (P > 0.05) by inclusion of molasses or ground SC in the control diet; it averaged 96.0%. This ratio was significantly higher (P < 0.01) with SC juice treatment (i.e. 96.5%). According to their low N content, daily N intake in diets with SC products was lower than with the control diet (28.0 v. 38.7 g/day; P < 0.01). Whatever the dietary treatment, < 50% of N intake was retained.
Effect of feeding diets containing SC products on digestibility of nutrients, ME and N retention in CR pigs (trial 1; least square means)Footnote 1

SC = sugarcane; r.s.d. = residual standard deviation; ME = metabolisable energy; CR = Creole; DM = dry matter; DE = digestible energy; D = diet; R = replicate; B = block within replicate; D × R = diet × replicate; NS = not significant.
1 Diets were prepared by mixing molasses, SC juice or ground SC with the control diet.
2 Levels of significance: *P < 0.05, **P < 0.01, ***P < 0.001. Within a line, least square means with different superscripts differed (P < 0.05) according to the dietary treatment.
3 Expressed as percentage of total DM allowed.
4 No control diet was refused whatever the dietary treatment.
5 Digestibility coefficients of nutrients = digested nutrients or energy expressed as a percentage of nutrient or energy intake.
Estimated DC of nutrients and energy of SC products using the difference method are presented in Table 3. The DC of OM and energy of molasses averaged 84.4% and 83.6%, respectively. The corresponding values for SC juice were equal to 99.3% and 99.0%, respectively. The DC calculated for ground SC offered or consumed differed significantly with lower values for ground SC offered. On average, DE values of the control diet, molasses, SC juice and ground SC intake and offered were 16.55, 13.11, 17.34, and 12.31 and 5.72 MJ/kg DM, respectively.
Estimated apparent digestibility coefficients of SC products according to the difference method

SC = sugarcane; DE = digestible energy; ME = metabolisable energy.
1Values calculated according to the difference method: digestibility coefficients (DC) of energy and organic matter and CP of SC products were calculated from the rate of incorporation in feed and the DC of control and mixed (control + SC products) diets and expressed as a percentage of nutrient or energy offered.
2Values calculated according to the difference method and expressed as a percentage of nutrient or energy intake.
3DC of free sugars was found 100% whatever the SC product considered.
Effect of gradual increase of SC juice on total tract digestibility of energy and nutrients (trial 2)
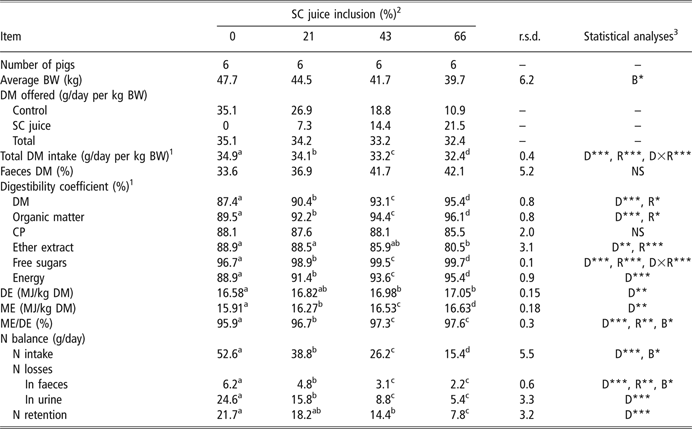
The effects of a gradual increase in the rate of incorporation of SC juice (trial 2) on total tract digestibility of nutrients and energy are presented in Table 4. There was no statistical difference in average BW (P > 0.05) between diets. SC juice incorporation in diet increased from 0 to 66 g/100 DM between diets 1 and 4, respectively. The response of SC juice incorporation rate on DC was linear and the quadratic effect was not significant (P > 0.05). Despite an important numerical increase (33.6% to 42.1% between diets 1 and 4), faeces DM was not affected by the level of SC juice. The gradual decrease of N retained from diet 1 to 4 was related to the dilution of the N source from control diet with the progressive inclusion of SC juice. Except for CP and EE, the gradual inclusion rate of SC juice from diet 1 to diet 4 increased the DC of all components (P < 0.001). The DC of energy increased from 88.9% to 95.4%. In contrast, the DC of EE significantly decreased (P < 0.01) from 88.9% to 80.5% between diets 1 and 4. The ME/DE ratio increased from 95.9% to 97.6%, respectively, between diets 1 and 4.
Effect of feeding diets including various levels of SC juice on digestibility of nutrients, ME and N retention in CR pigs (trial 2; least square means)Footnote 1
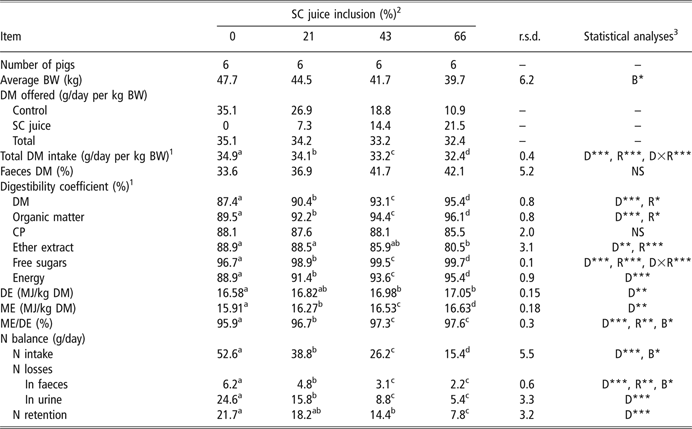
SC = sugarcane; r.s.d. = residual standard deviation; ME = metabolisable energy; CR = Creole; r.s.d. = residual standard deviation; DM = dry matter; DE = digestible energy; D = diet; R = replicate; B = block within replicate; D × R = diet × replicate; NS = not significant.
1 Diets were prepared by mixing molasses, SC juice or ground SC with the control diet.
2 Diet 1 was 35 g DM/day per kg BW of control diet and diets 2, 3 and 4 were a mix of 8, 16 and 24 g DM/day per kg BW of SC juice with control diet, respectively.
3 Levels of significance: *P < 0.05, **P < 0.01, ***P < 0.001. Within a line, least square means with different superscripts differed (P < 0.05) according to the dietary treatment.
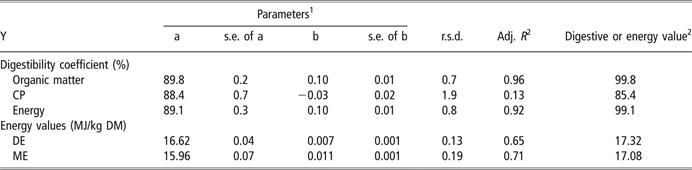
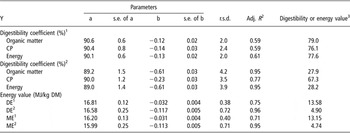
According to the regression analysis of the DC of the nutrients or energy with the rate of SC juice inclusion, each 1% increase of SC juice inclusion rate resulted in a linear increase of 0.10% of the DC of OM and energy (Table 5). In contrast, the digestibility of CP was not affected by SC juice levels in diet. From these relationships, DC of nutrient and energy of SC juice can be calculated; they averaged 99.8%, 85.4% and 99.1% for OM, CP and energy, respectively. These values are similar to the values obtained in trial 1, (i.e. 99.0% for energy). Each 1% increase of SC juice inclusion rate resulted in a linear increase of 0.007 and 0.011 MJ/kg DM of DE and ME, respectively; average DE and ME values of SC juice obtained by regressions were then 17.32 and 17.08 MJ/kg DM, respectively.
Relationship between incorporation rates of SC juice in the diet and digestibility coefficients of energy and nutrients (trial 2)
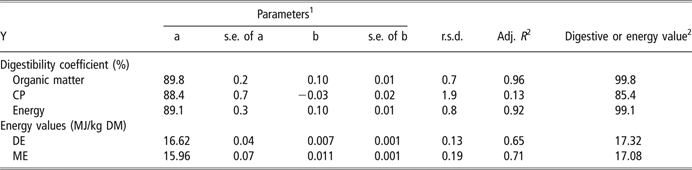
SC = sugarcane; Y = digestibility coefficient values or energy value; a = digestibility coefficient or energy value of control diet; b = the linear variation of digestibility coefficient or energy value with the increase of SC juice; r.s.d. = residual standard deviation; DM = dry matter; DE = digestible energy; ME = metabolisable energy.
1Nutritional and energy values calculated using the regression analysis with the following model: Y = a + b × (SC juice incorporation rate), with Y, a and b. Incorporation rate = SC juice intake/total intake (g DM/g DM).
2Calculated from the regression equation for a 100% incorporation rate of SC juice in the diet.
Effect of gradual increase of ground SC on total tract digestibility of energy and nutrients (trial 3)
The effects of a gradual increasing rate of incorporation of ground SC (trial 3) on nutrient intake and extraction rate are presented in Table 6. Average BW was not significantly affected (P > 0.05) by ground SC incorporation level. The total DM intake was significantly reduced between diets 1 and 4 in connection with the increase of ground SC refusals. Expressed in g/100 g ground SC intake, the nutrient extraction rate was not influenced by the increase of ground SC incorporation rate. As a consequence, the amount of daily nutrient or energy intake from ground SC linearly increased with the rate of ground SC incorporation.
Effect of feeding diets including various levels of ground SC on intake and extraction rate of nutrients in CR pigs (trial 3; least square means)Footnote 1

SC = sugarcane; CR = Creole; r.s.d. = residual standard deviation; DM = dry matter.
1 Diets were prepared by mixing molasses, SC juice or ground SC with the control diet.
2 Diet 1 was 35 g DM/day per kg BW of control diet and diets 2, 3 and 4 were a mix of 13, 26 and 39 g DM/day per kg BW of ground SC with control diet, respectively.
3 Levels of significance: *P < 0.05, **P < 0.01, ***P < 0.001. Within a line, least square means with different superscripts differed (P < 0.05) according to the dietary treatment.
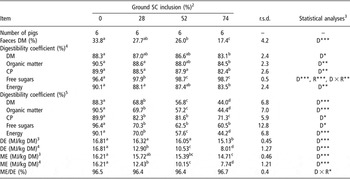
As the chemical composition of ground SC refusals differed from that of ground SC allowance with an increase of fibre content and a decrease of soluble free sugars, the DC was calculated on ground SC allowance basis or on actual ground SC intake. The increase of ground SC inclusion in the diet from 0% to 74% resulted in a linear decrease (P < 0.05) of faecal DM from 33.8% to 17.4% and in a linear reduction (P < 0.05) of DM, OM and energy digestibility coefficients (Table 7). In contrast, with a progressive inclusion of ground SC, the free sugars DC increased when expressed on an intake basis (96.4% v. 98.7%; P < 0.001). The regression analysis of the nutrients DC with incorporation rate of ground SC in the diet is presented in Table 8. Whatever the expression of the DC, a linear decrease of the DC was shown for OM, CP and energy. Each 1% increase of ground SC incorporation rate resulted in a 0.12% and 0.13% linear decrease of the DC of OM and energy, respectively, when expressed as a percentage of energy intake (method 1). The average DC of energy, DE and ME values were lower when method 2 was used instead of method 1 (28.2% v. 77.6%, 4.90 v. 13.58 MJ/kg DM and 4.74 v. 13.15 MJ/kg DM, respectively).
Effect of feeding diets including various levels of ground SC on digestibility of nutrients, ME and N retention in CR pigs (trial 3; least square means)Footnote 1

SC = sugarcane; r.s.d. = residual standard deviation; ME = metabolisable energy; CR = Creole; DM = dry matter; DE = digestible energy; D = diet; R = replicate; D × R = diet × replicate.
1 Diets were prepared by mixing molasses, SC juice or ground SC with the control diet.
2 Diet 1 was 35 g DM/day per kg BW of control diet and diets 2, 3 and 4 were a mix of 13, 26 and 39 g DM/day per kg BW of ground SC with control diet, respectively.
3 Levels of significance: *P < 0.05, **P < 0.01, ***P < 0.001. Within a line, least square means with different superscripts differed (P < 0.05) according to the dietary treatment.
4 Digestibility coefficient values expressed as percentage of nutrient or energy intake.
5 Digestibility coefficient values expressed as percentage of nutrient or energy offered.
Relationship between incorporation rates of allowed ground SC in the diet and digestibility coefficients of energy and nutrients

SC = sugarcane; Y = digestibility coefficient values of nutrients or energy expressed as a percentage of nutrient or energy intake; a = digestibility coefficient of control diet; b = the linear variation of digestibility coefficient with the increase of ground SC incorporation rate; DM = dry matter; DE = digestible energy; ME = metabolisable energy.
1Parameters estimated from the following model: Y = a + b × (ground SC incorporation rate), with Y, a and b. Incorporation rate = ground SC intake/total intake (g DM/g DM).
2Parameters estimated from the following model: Y = a + b × (ground SC incorporation rate), with Y, a and b. Incorporation rate = ground SC allowance/total allowance (g DM/g DM).
3Calculated from the regression equation for a 100% incorporation rate of ground SC in the diet.
Discussion
Nutritional and energy values of SC juice
The chemical composition of SC juice determined in this study is similar to the values published in Brazilian tables (Rostagno, Reference Rostagno2005). Total soluble sugars represented the main part of the identified OM (i.e. 83%). In these sugars, sucrose is the predominant carbohydrate (about 90%) and fructose and glucose represent less than 10% (Meade and Chen, Reference Meade and Chen1977). The non-sugar OM in SC juice (i.e. 17.0%) is represented by chlorophyll, tannins, wax and fibre (Meade and Chen, Reference Meade and Chen1977). In our experiment, these non-sugars OM content in SC juice was about 16.8 g/100 g DM.
Our results show that OM and energy digestibility of SC juice is close to 100% according to its high content of water soluble sugars, which are known to be entirely digestible (Noblet et al., Reference Noblet, Bontems and Tran2003). Logically, total tract digestibility of energy of the diet is linearly enhanced as more as the inclusion rate of SC juice in the diet is increased. This result also suggests that SC juice does not interact with the control corn-soybean meal diet. However, our DE and ME values for SC juice (17.3 and 17.1 MJ/kg DM) are higher than those calculated in the Brazilian tables (15.9 and 15.2 MJ/kg DM; Rostagno, Reference Rostagno2005) despite a GE value similar to ours (17.1 v. 17.5 MJ/kg DM). In fact, in Brazilian tables, DE and ME values were not measured but estimated from the chemical composition of SC juice. From that, it can be suggested that equations used to estimate energy values of SC juice in those tables underestimate the actual values. Our results also show a higher DC of OM for the SC juice than in the Brazilian tables (99.5% v. 93.4%; Rostagno, Reference Rostagno2005).
Nutritional and energy values of final SC molasses
The chemical composition of molasses is closely dependant on the technological process applied for the extraction of raw sugar. Bayley et al. (Reference Bayley, Figueroa, Ly, Maylin and Perez1983) showed that the range for ash and soluble sugars contents in Cuban commercial conditions was from 5.7 to 16.3 g/100 DM and from 46 to 76 g/100 DM, respectively. In our study, the SC molasses contained 15.1 g/100 g DM of ash and 71.0 g/100 g DM of soluble sugars (sucrose, fructose and glucose). During the crystallisation processes, non-sugars OM were concentrated in molasses and represented more than 13% of the total OM. The DC of OM and energy are lower in molasses than in SC juice (−15%). This result can be related to the high ash content that increases endogenous energy losses (Noblet and Shi, Reference Noblet and Shi1994) and the low digestibility of the non-sugars OM in molasses. Comparing the digestive utilisation of SC molasses with a mixture of soluble sugars representative of sugars composition of molasses, Bayley et al. (Reference Bayley, Figueroa, Ly, Maylin and Perez1983) showed a reduced DC of energy with SC molasses. In fact, Figueroa et al. (Reference Figueroa, Maylin, Ly, Pérez, Carrillo and Bayley1990) showed that the non-identified OM in SC molasses is poorly digested, which considerably reduces the dietary DE density of this material. In this study, the DC for N was higher than the value reported in the INRA tables (68.1% v. 40.0%; Sauvant et al., Reference Sauvant, Perez and Tran2002). However, these values should be used with caution according to the low accuracy of the N digestibility due to both low N content in molasses and possible effects of molasses products (minerals) on digestion and transit (Brooks, Reference Brooks1967; Christon and Le Dividich, Reference Christon and Le Dividich1978). The mechanism by which protein digestibility was depressed by molasses is not fully understood. Christon and Le Dividich (Reference Christon and Le Dividich1978) reported that the depressive effect of molasses on N retention in rat is mainly related to an excretion of endogenous N in faeces. They concluded that this high endogenous N losses could be explained an abrasive effect of ash and minerals like potassium (K).
The energy DC (83.6%) is similar to the value reported in the French tables (85%; Sauvant et al., Reference Sauvant, Perez and Tran2002). The DE values of molasses (13.1 MJ/kg DM) are in accordance with Bayley et al. (Reference Bayley, Figueroa, Ly, Maylin and Perez1983) study (13.6 MJ/kg DM) and with French (Sauvant et al., Reference Sauvant, Perez and Tran2002; 12.7 MJ/kg DM) and Brazilian (Rostagno, Reference Rostagno2005; 13.5 MJ/kg DM) feeding tables.
Nutritional and energy values of ground SC stalks
The DM of faeces was reduced when inclusion of ground SC increased. Similarly, Henry and Etienne (Reference Henry and Etienne1969) reported lower faeces DM when increasing levels of pure cellulose were included in growing pig’s diet. According to these latter authors, the increase of faecal DM is directly related to the high water holding capacity of fibre.
To our knowledge, no study has been published on the digestive utilisation of energy and nutrients of SC ground stalks in growing pigs. Our results show that DC and energy values of ground SC vary with the method used for their calculations (intake v. allowance basis). In fact, only one part of ground SC allowed was effectively consumed because the pigs chew the cane stalks to extract juice and spit out most of the fibrous residue (Mederos et al., Reference Mederos, Figueroa, Garcia, Aleman, Martinez and Ly2004). This peculiar feeding behaviour could be considered as an adaptation to increase the energy extraction rate in ground SC. In fact, with this feeding behaviour, pigs avoid very bulky intakes and subsequent low energy intakes. As a result, the chemical composition of the actual ground SC intake widely differed from that of ground SC allowed: it contained a lower fibre and higher free sugar contents. From that, two expressions of nutrients and energy DC were needed to characterise the nutritional value of ground SC (intake v. allowance basis). In our work, the chemical composition of ground SC intake was maintained constant at a level of about 60% whatever its incorporation rate. This suggests that the feeding behaviour remains comparable whatever the level of proposed ground SC. In contrast, Bravo et al. (Reference Bravo, Lasso, Esnaola and Preston1996) showed that sugar extraction rate decreased from 85.4% to 68.8% when ground SC allowance increased from 17 to 51 g DM/day per kg BW. In this latter study, SC particle size averaged 3 cm. According to Mederos et al. (Reference Mederos, Figueroa, Garcia, Aleman, Martinez and Ly2004), the juice extraction rate was more efficient in 3 cm sized ground SC particles than in milled SC. Thus, it can be assumed that the small size of ground SC particles used in the present experiment could have limited the ability of the pigs to extract juice from ground SC. From a practical point of view, this result suggests that grinding conditions and/or particle size could influence the sugar extraction rate and then the energy value of ground SC. However, other criteria such as the SC variety (hard v. smooth stalk), the pigs BW and/or breed could also affect the sugar extraction rate. According to Bravo et al. (Reference Bravo, Lasso, Esnaola and Preston1996), the efficiency of sugar extraction by the pigs appeared to be higher than when the juice was extracted mechanically with a 3 roll-mill (Vencedora Magtron, Joaçaba, SC 89600-000, Brazil). All in all, in a small scale farming system context, we have to take into account this point for the global efficiency of the production system.
From our observations, the coefficient of variation for the extraction rate of nutrients and energy from ground SC within each dietary treatment was high (> 30%) suggesting important between-animal variability. In addition, energy digestibility was negatively correlated with NDF extraction rate (r = −0.42; P = 0.08) suggesting that a large between-pig variability exists in the ability to suck and spit ground SC and in the ability to ingest dietary fibre from the ground SC. In consequence, the digestive utilisation of nutrients and energy from ground SC was closely dependant on the inter-individual feeding behaviour variations.
In comparison with the other SC products, the energy DC of ground SC was lower mainly because of its high dietary fibre content. The reduced digestibility of high fibre diets is explained by low digestibility of the fibre fraction and possible negative interactions with the other nutrients (Le Goff et al., Reference Le Goff, van Milgen and Noblet2002). From the latter authors, each extra 1% increase in NDF content decreases by one percentage point the DC of energy in growing pigs. From that, it can be suggested that the reduced energy DC related to the inclusion of ground SC in the experimental diet could be related to its high consecutive fibre content. In addition, the negative effect of dietary fibre on energy DC was emphasised by the high ADF content of ground SC.
In our experimental conditions, the actual DM and energy intake from ground SC represented less than 40% and 35% of DM and energy allowance, respectively. First, it can be suggested that time dedicated for the sugar extraction chewing would limit the ability of the pigs to increase their feeding level (Xandé et al., Reference Xandé, Despois, Giorgi, Gourdine, Archimède and Renaudeau2009). Second, in connection to their high water holding capacity, dietary fibre increases gut fill and satiety. From that, it can be also suggested that the low DM and energy intake from ground SC was related to the high dietary fibre content. According to the net energy (NE) system, the metabolic utilisation of high fibre diets is accompanied by an increase of heat expenditure and a decrease of retained energy (Noblet et al., Reference Noblet, Shi, Fortune, Dubois, Lechevestrier, Corniaux, Sauvant and Henry1994). From that, it can be expected that the NE/ME ratio would be much lower for ground SC than for juice in connection with a high-energy expenditure connected to chewing activity. Then, the low growth performance obtained in our previous study with pigs fed ground SC (i.e. 200 g/day; Xandé et al., Reference Xandé, Despois, Giorgi, Gourdine, Archimède and Renaudeau2009) is mainly related to the fact that a small part of energy allowed in ground SC (about 25%) was available for growth purposes.
Acknowledgements
This work was supported by the Guadeloupe Region and the European funds (FSE FEOGA). The authors gratefully acknowledge C. Anais, K. Benony, M. Bructer, E. M. Giorgi, K. A. Racon and F. Silou for their technical assistance, Y. Jaguelin, M. Baucal, S. Calif, T. Etienne and G. Saminadin for the laboratory analysis.