The mode of autograft failure after the Ross operation has been studied extensively.Reference Solymar, Südow and Holmgren 1 – Reference Bekkers, Klieverik, Raap, Takkenberg and Bogers 7 Early autograft failure is most often attributed to technical problems and associated with the more demanding subcoronary implantation technique. Reports of progressive autograft dilatation and subsequent late autograft failure led to the widespread use of aortic reinforcement techniques, such as the placement of Dacron® (Meadox Medicals Incorporation, Oakland, New Jersey, United States of America) or Goretex® (W.L. Gore and Assoc, Flagstaff, Arizona, United States of America) strips around the annulus and sinus of Valsalva. These techniques have significantly reduced the incidence of autograft failure in adults.Reference Charitos, Hanke and Stierle 8 , Reference Sievers, Stierle and Charitos 9
In children, the major advantage of the Ross operation is the growth potential of the autograft. Whether reinforcement strategies are beneficial in children remains unclear. How the autograft grows or dilates in developing children is also an open question. This study was performed to test the hypothesis that autografts in growing children can grow in association with somatic growth, followed by passive dilation after the cessation of somatic growth, potentially leading to late autograft insufficiency. We analysed autograft growth and dilatation in children who underwent the Ross operation and examined the relationship of these factors to autograft failure.
Subjects and methods
Study design and patient population
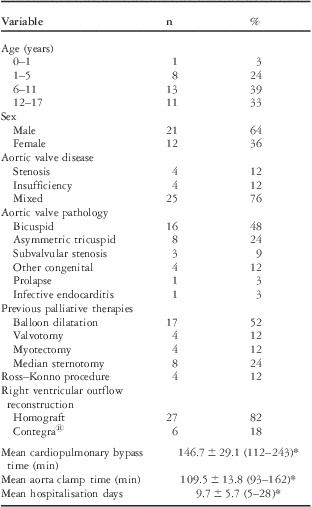
This was a retrospective cohort study performed at a single centre. A local database covering the period from 1993 through 2010 was screened. We identified 33 patients, including 21 boys and 12 girls, who were younger than 18 years when they underwent the Ross operation without aortic reinforcement. Data on these patients were analysed. The mean age at the Ross operation was 9.9 ± 4.7 years. Aortic valve disease involved a bicuspid aortic valve in 16 patients, an asymmetric tricuspid valve in eight patients, subvalvular stenosis in three patients, and endocarditis in one patient. No patient had connective tissue diseases such as Marfan's syndrome or Turner's syndrome. Before the Ross operation, 25 patients had previously received palliative treatments for aortic valve disease, including balloon dilatation in 17, open aortic valvotomy in four, subvalvular myomectomy in four, and median sternotomy in eight. The mean hospital stay was 9.7 ± 5.7 days (Table 1). Autograft annulus size expressed as Z score, long-term survival with freedom from autograft insufficiency of grade 2 or higher, and autograft reoperation were analysed on the basis of morphometric data, including weight and height, and periodic transthoracic echocardiography. Mean follow-up was 8.8 ± 4.4 years (range from 1.25 to 17.9 years). Informed consent was obtained from all patients or their parents or legal guardians, and the study protocol was approved by the local ethics committee.
Pre-operative characteristics and operative data of 33 patients.

*Mean ± standard deviation
Clinical evaluations
Baseline clinical data on all patients, including demographic characteristics, medical history, operation records, body measurements, and echocardiographic findings, were collected by retrospectively reviewing the patients’ records. Body surface area (m2) was calculated by multiplying 0.007184 by weight (kg)0.425 and height (cm)0.725 according to the DuBois and DuBois formula.Reference DuBois and DuBois 10
Echocardiography
Echocardiographic examinations were performed by experienced cardiologists or laboratory technicians, using transducers of appropriate size (from 2.5 to 7.5 MHz). A Philips iE33 echocardiography system (Royal Philips Electronics N.V., Amsterdam, The Netherlands) was used for patients up to 18 years of age. Philips iE33, GE Vivid 7, and GE Vivid 9 systems (General Electric Company, Fairfield, Connecticut, United States of America) were used to follow up adults. Pulmonary autografts were measured in the parasternal long-axis view. Annulus size was defined as the distance between the attachments (hinge points) of the semilunar leaflets during systole. Pressure gradients (mmHg) at the aortic valve or pulmonary autograft were calculated by multiplying the peak flow velocity in metres per second by 4 according to the modified Bernoulli equation.
At higher speed, more than 2.5 m/s, continuous wave Doppler ultrasound was needed. The severity of pulmonary autograft regurgitation was evaluated semi-quantitatively by colour Doppler mode and graded on a scale of 1 (minor) to 4 (severe).
Surgical procedures
The Ross procedure was performed with total aortic root replacement in all patients with the use of standard techniques for paediatric cardiopulmonary bypass with bicaval cannulation, moderate hypothermia, cold crystalloid cardioplegia, and topical cooling. Autologous pulmonary valves were harvested in a scalloped manner, leaving 4 to 5 mm below the attachment of the cusps, and were implanted into the aortic position with continuous 5/0 polypropylene sutures. Subsequently, both coronary ostia were anastomosed to their respective sinuses with continuous polypropylene sutures. Extended root replacement – Ross–Konno procedure – was performed in four patients (12%) who had subvalvular stenosis or a small aortic annulus. Right ventricular reconstruction was performed with a homograft in 27 patients (82%) and with a Contegra bovine jugular valved conduit® (Medtronic Incorporation, Minneapolis, Minnesota, United States of America) in six patients (18%). The mean cardiopulmonary bypass time was 146.7 ± 29.1 min, and the mean aorta clamp time was 109.5 ± 13.8 min (Table 1).
Statistical analysis
All statistical analyses were performed with Stat View J-5.0 (SAS Institute Incorporation, Cary, North Carolina, United States of America). Differences in baseline characteristics were analysed with Student's t-test. Continuous variables are expressed as means ± standard deviation, with ranges when appropriate. Categorical variables are expressed as frequencies and percentages and were compared with the use of the chi-square test. Survival curves for freedom from autograft insufficiency or reoperation were constructed using the Kaplan–Meier method. Survival was defined as the interval from the Ross procedure to an event – autograft insufficiency or reoperation – or the last follow-up, at which time data were censored. p-Values of <0.05 were considered to indicate statistical significance.
Z scores for measured autograft annulus diameters were calculated on the basis of predicted values and standard deviations derived from regression analysis of data from more than 2000 healthy infants and children in central Europe.Reference Kaupmann, Weithoff and Stolz 11 Predicted aortic valve diameter (mm) was calculated by multiplying 19.443 by (body surface areas)0.4578. The Z score was calculated by dividing measured value minus predicted value by standard deviation.
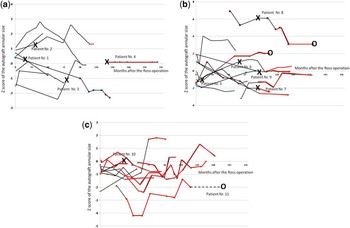
Two-period, moving average trend lines of Z scores were constructed using scattergrams created with Excel Software 2007 (Microsoft Corporation, Redmond, Washington, United States of America) and are presented according to age group. Black lines represent the Z score trends during somatic growth, and red lines represent the trends after the cessation of somatic growth. “X” indicates the time of autograft insufficiency development, and “O” represents the time of autograft reoperation.
Results
Pre-operative characteristics and operative variables are shown in Table 1. No patient had autograft stenosis with a pressure gradient exceeding 20 mmHg or autograft insufficiency of grade 2 or higher during the early post-operative period.
Z score analyses of pulmonary autograft diameter
Patients aged between 0 and 5 years at Ross operation
Of the nine patients, six were still growing at the last follow-up. Z scores in eight patients remained between −2 and 2 or subsequently normalised to within this range by the last follow-up. There were four patients (patients 1, 2, 3, and 4) who had autograft insufficiency 1.3, 2.5, 6.2, and 9.4 years after the Ross operation with Z scores at this time of 0.3, 1.3, −1.3, and 0.1, respectively. Autograft insufficiency developed in three of these four patients while they were still growing. Patient 4 had autograft insufficiency despite a stable Z score. No patient required autograft reoperation (Fig 1a).
(a) Time course of Z scores in patients aged between 0 and 5 years. Of the nine patients, six were still growing at the last follow-up. Z scores in eight patients remained between −2 and 2 or subsequently normalised to within this range by the last follow-up. Four patients (Patients 1, 2, 3, and 4) had autograft insufficiency 1.3, 2.5, 6.2, and 9.4 years after the Ross operation with Z scores at this time of 0.3, 1.3, −1.3, and 0.1, respectively. Autograft insufficiency developed in three of these four patients while they were still growing. Patient 4 had autograft insufficiency despite a stable Z score. No patient required autograft reoperation. Patients’ numbers correspond to the numbers in Table 2. The black lines represent the time course of Z score during somatic growth; the red lines indicate the time course of Z score after the cessation of somatic growth. “X” represents the time of autograft insufficiency development. (b) Time course of Z scores of patients aged between 6 and 11 years. Somatic growth had stopped in seven of the 13 patients at the last follow-up. In eight patients, Z scores remained between −2 and 2 or subsequently normalised to within this range by the last follow-up. Autograft insufficiency developed in five patients (Patients 5, 6, 7, 8, and 9) 0.7, 5.4, 7.6, 7.7, and 7.8 years after the Ross operation, and the Z scores at that time were −1.1, 1.1, −2.0, 6.1, and −0.1, respectively. All of these patients had autograft insufficiency when they were still growing. Patient 5 had autograft insufficiency as early as 8.7 months after the Ross operation (Z score, −1.1) and subsequently received the David operation. Patient 8 had autograft insufficiency 7.7 years after the Ross operation, with an extremely high Z score of 6.1. The patient subsequently underwent heart transplantation for valvular cardiomyopathy. Patients’ numbers correspond to the numbers in Tables 2 and 4. The black lines represent the time course of Z scores during somatic growth; the red lines indicate the time course of Z scores after the cessation of somatic growth. “X” represents the time of autograft insufficiency development, and “O” represents the time of autograft reoperation. (c) Time course of Z scores of patients aged between 12 and 17 years. Somatic growth had stopped in 10 of the 11 patients at the last follow-up. In all patients, Z scores remained between −2 and 2 or subsequently normalised to within this range by the last follow-up. Only one patient (Patient 10) had autograft insufficiency 2.9 years after the Ross operation, and the Z score at that time was 0.1; somatic growth had already stopped. Patient 11, who had an extremely low Z score, underwent ascending aorta replacement for an aortic aneurysm 14.7 years after the Ross operation, without the development of autograft insufficiency. No Z score was obtained during the period indicated by the black broken line in Patient 11. Patients’ numbers correspond to the numbers in Tables 2 and 4. The black lines represent the time course of Z scores during somatic growth; the red lines indicate the time course of Z scores after the cessation of somatic growth. “X” represents the time of autograft insufficiency development, and “O” represents the time of autograft reoperation.

Patients aged between 6 and 11 years at Ross operation
Somatic growth had stopped in seven of the 13 patients by the last follow-up. In eight patients, Z scores remained between −2 and 2 or subsequently normalised to within this range at the last follow-up. Autograft insufficiency developed in five patients (patients 5, 6, 7, 8, and 9) 0.7, 5.4, 7.6, 7.7, and 7.8 years after the Ross operation, and the Z scores at that time were −1.1, 1.1, −2.0, 6.1, and −0.1, respectively. All of these patients had autograft insufficiency while they were still growing. Patient 5 had autograft insufficiency as early as 8.7 months after the Ross operation (Z score, −1.1) and subsequently received the David operation. Patient 8 had autograft insufficiency 7.7 years after the Ross operation, with an extremely high Z score of 6.1. The patient subsequently underwent heart transplantation for severe heart failure due to autograft insufficiency (Fig 1b).
Patients aged between 12 and 17 years at Ross operation
Somatic growth had stopped in 10 of the 11 patients at the last follow-up. In all patients, the Z scores remained between −2 and 2 or subsequently normalised to within this range by the last follow-up. Only one patient (Patient 10) had autograft insufficiency 2.9 years after the Ross operation, and the Z score at that time was 0.1; somatic growth had already stopped. Patient 11, who had an extremely low Z score, underwent ascending aorta replacement for an aortic aneurysm 14.7 years after the Ross operation, without the development of autograft insufficiency (Fig 1c).
Autograft insufficiency
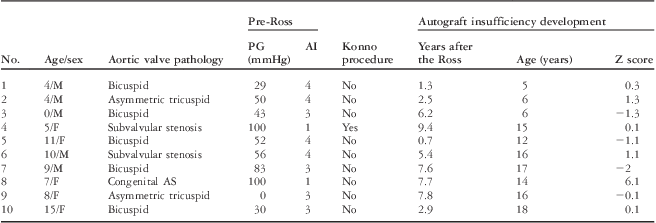
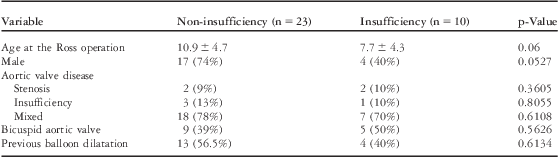
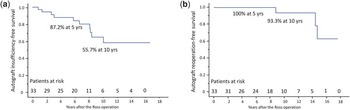
Pulmonary autograft insufficiency of grade 2 or higher occurred in 10 patients 5.1 ± 2.6 years after the Ross procedure. All patients in whom autograft insufficiency developed are listed in Table 2. The mean Z score at the development of autograft insufficiency was −0.1 ± 1.1 (range from −2.0 to 6.1). There were no significant differences in clinical characteristics between patients with and those without autograft insufficiency (Table 3). The proportions of patients who remained free of autograft insufficiency at 5 and 10 years were 87.2% and 55.7%, respectively (Fig 2a). In contrast, autograft stenosis with a pressure gradient exceeding 20 mmHg did not occur in any patient.
Patients who developed autograft insufficiency after the Ross operation.

AI = aortic insufficiency; AS = aortic stenosis; F = female; M = male; PG = pressure gradient
Comparison of patient characteristics between patients who developed and those who did not develop autograft insufficiency.

(a) Kaplan–Meier analysis of freedom from autograft insufficiency. (b) Kaplan–Meier analysis of freedom from autograft reoperation.

Autograft reoperation
Autograft reoperation was performed in three patients (Table 4). One of the patients (Patient 11) did not have autograft insufficiency. The proportions of patients who remained free of autograft reoperation at 5 and 10 years were 100% and 93.3%, respectively (Fig 2b).
Patients who underwent autograft reoperation after the Ross operation.

AI = aortic insufficiency; AS = aortic stenosis; Asc. aorta = ascending aorta; F = female; HTX = heart transplantation; M = male; PG = pressure gradient
Discussion
The Ross operation has been demonstrated to have low early and late mortality despite the technically demanding procedure.Reference Hraska, Krajci and Haun 12 – Reference Stewart, Becker, Hillman, Lundt and Mavroudis 16 An autologous pulmonary valve has major advantages over prosthetic valves, including better haemodynamic performance, avoidance of anticoagulant therapy, low thromboembolic and haemolytic complications, and freedom from prosthetic valve sounds. Autologous pulmonary valves are therefore widely used in children and adolescents with aortic valve disease. However, an autologous pulmonary valve is not ideal because its annulus diameter can increase, leading to an aneurysm, autograft insufficiency, or both, requiring surgical reintervention.Reference Kouchoukos, Masetti, Nickerson, Castner, Shannon and Dávila-Román 4 – Reference Bekkers, Klieverik, Raap, Takkenberg and Bogers 7 Our results showed that each patient had a unique time course of Z score of the autograft annulus size; unexpectedly, we did not find a consistent trend. Moreover, most cases of autograft insufficiency developed in association with a normal Z score during somatic growth. To our surprise, autograft insufficiency developed in some patients who had stable Z scores (Patients 4 and 9), as well as in those with decreasing Z scores (Patients 1 and 7). These results disprove our hypothesis that autografts grow along with somatic growth and dilate subsequently.
Dilatation is considered one of the causes of autograft insufficiency. Hokken et alReference Hokken, Bogers and Taams 17 reported that pulmonary autograft dilatation occurred during the first 10 days after the Ross procedure, with a further increase during follow-up in adult patients. Solymar et alReference Solymar, Südow and Holmgren 1 demonstrated that pulmonary autografts show rapid, passive dilatation during the first post-operative year, followed by normal growth in children. A dilation-induced increase in autograft diameter is reasonable in adults because somatic growth has already stopped. However, in children and adolescents who are still growing, autografts show not only passive dilatation, but also active growth. When the annulus and leaflets grow appropriately, geometric relations and coaptation of the cusps can remain proper. In contrast, when the annulus dilates without leaflet growth and coaptation is affected, autograft insufficiency will occur. Alsoufi et alReference Alsoufi, Manlhiot and Fadel 18 reported that the cause of autograft failure in children with rheumatic aortic valve disease was mainly neoaortic root dilatation, and root reinforcement decreased the risk of reoperation after the Ross procedure. In that study, the pulmonary autografts might have also been affected by rheumatic disease, which potentially caused autograft dilatation. Root reinforcement was therefore a morphologically reasonable strategy. However, our results are not consistent with their findings, perhaps because none of our patients had rheumatic disease.
Degeneration is another potential cause of autograft insufficiency. Schoof et al histologically evaluated pulmonary autografts explanted from the aortic position an average of 6.1 years after the Ross operation. They reported increased autograft valve thickness associated with an additional layer of fibrocellular tissue, as well as severe degenerative changes of autograft artery wall accompanied by increased collagen content and fragmentation of medial elastin. They ascribed these changes of the autograft valve and wall to adaptive remodelling in response to the systemic circulation and proposed that such changes contribute to the development of valve insufficiency and autograft aneurysms.Reference Schoof, Takkenberg and van Suylen 19 For example, increased valve thickness might restrict radial extensibility, and increased stiffness of autograft wall is likely to increase valve stress and negatively affect function. Such degeneration of pulmonary autografts might also contribute to valve insufficiency and can logically explain the pathogenesis of autograft insufficiency even in patients with small autografts. The long-term nature of the degenerative changes of autografts may explain why the younger patients who underwent the Ross operation had an apparently higher rate of pulmonary autograft insufficiency in our study. A bicuspid aortic valve is one of the most important underlying causes of aortic dysfunction and was present in about half of our patients. de Sa et alReference de Sa, Moshkovitz, Butany and David 20 demonstrated that patients with a bicuspid aortic valve had more severe cystic medial necrosis, more severe elastic fragmentation, and more changes in the smooth muscle cell orientation in the pulmonary trunk. These degenerative changes might also lead to autograft insufficiency.
In adult patients, there is a general consensus that autograft reinforcement decreases the risk of autograft insufficiency and reduces the reoperation rate for autograft dysfunction after the Ross procedure.Reference Charitos, Hanke and Stierle 8 , Reference Sievers, Stierle and Charitos 9 In growing children, our results suggest that reinforcement strategies are not recommended because room for further growth is necessary; it is difficult to estimate autograft growth and dilatation; and the occurrence of autograft insufficiency in children seems unrelated to dilatation.
Study limitations
This study was based on data derived from a single centre. Moreover, the small number of subjects did not give the study adequate power to reach robust conclusions about the time course of pulmonary autograft diameter.