

I am pleased to report that our Association's financial condition remains healthy, providing a resource base sufficient to continue current operations, while expanding the Association's activities in new directions as needed. Since our last annual report, we have seen our endowment and real estate holdings grow in value to about $32.1 million (June 2007), against which we are carrying just $1.6 million in mortgage debt. For the fiscal year that ended June 30, 2008, we estimate that total operating income ($4.8 million) was slightly above budget, with expenditures below. Our broad membership base continues to be the most important reason for our healthy financial condition, while the annual meeting and APSA publications also provide substantial income. In short, we are in the enviable position of enjoying stable membership, while holding substantial income- and growth-producing assets with minimal long-term liabilities. All of these factors combine to produce an operating budget that hews closely to anticipated income and expenses, year after year.
Transparency and Social Responsibility
During my first year as your treasurer, the council and staff have supported members' access to fiscal information, ensured council-level fiscal responsibility, and ensured adherence to the social responsibility mandate that governs our investment policy. The Association's Trust and Development Board of Trustees, which is chaired by the treasurer and oversees investments, operates within guidelines (APSA Investment Policies and Practices) to oversee the organization and complexion of our portfolios; has published a list of our stock holdings in PS: Political Science and Politics; engaged a qualified external consultant to conduct a quinquennial evaluation of our investment advisor's performance, fees, and services; and worked with our investment advisor to ensure the social responsibility mandate is implemented in practice. In its first full year of operations, the Audit Committee, working with the APSA staff and council, authorized, reviewed, and approved an annual audit of the Association's financial operations.
Looking Ahead
In the coming months, several initiatives began during recent years will bear fruit. We expect to either sell or lease the property we own at 1528 18th Street, adjacent to the APSA headquarters building. The Administrative Committee and council will continue to refine mechanisms for council fiscal oversight and management to ensure APSA's proactive compliance with the accounting industry's “best practices” for non-profit institutions, while more than satisfying the federal government's Sarbanes-Oxley requirements. Finally, the Trust and Development Board will evaluate our current portfolio structure and consider alternative investment strategies that would complement our traditional model of actively managed investments that support the Association's objectives, and to evaluate the security of APSA's financial position and investments in an unpredictable economic environment.
Stock Market Decline
As this is written in late August 2008, the stock market has experienced decline amid uncertainty about future directions for the U.S. housing market, home mortgages, retail sales, oil prices, and interest rates. Like the rest of the nation's investors, we expect to see this decline reflected in our own portfolio, when final figures are available. However, we expect the impact of this uncertainty, over the long horizon, to be limited. Our endowment is invested in a diverse pool of securities, and we have limited exposure to markets experiencing the greatest decline, including those for asset-backed instruments and other complex, opaque, collateralized securities. We have avoided large investments in hedge funds, derivatives, and other instruments that have been so much in the news. While we are almost fully invested in stocks, our holdings cross a wide range of industries and regions (including about 12% explicitly international exposure), and these investments have generated better-than-average returns over many years. Thus we are optimistic that when the current decline is over, our portfolio will have performed no worse than the economy, or the stock market, as a whole, and is likely to outperform many comparably sized portfolios, whose managers have sought more aggressive returns—and correspondingly higher risk—over recent years.
Overview of Operating Budget 2007–2008
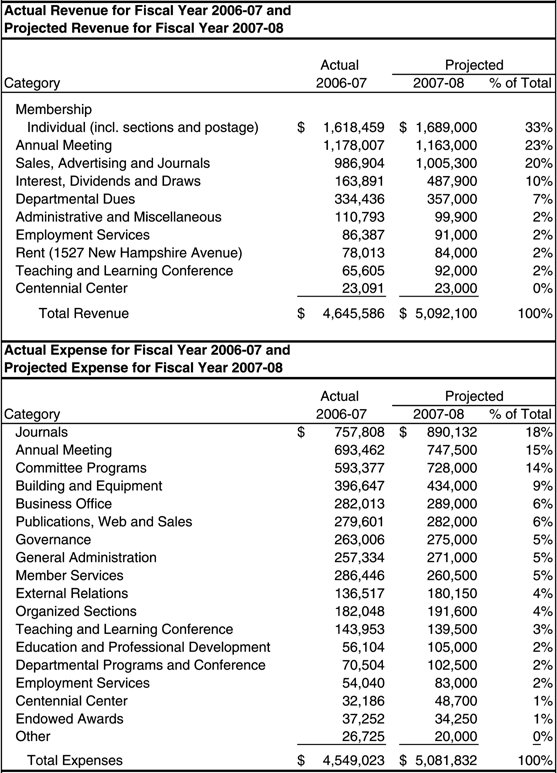
So you can see in greater detail where our money comes from, and where it is going, the budget for the most recent fiscal year appears in Table 6. You will see that our largest anticipated income sources for 2007–2008 are membership dues and fees ($1.689 million), annual meeting revenue ($1.163 million), and journals and publications ($1.005 million). Our largest expenditure areas are journals and publications ($1.172 million), membership services and programs ($1.168 million), and the Annual Meeting ($747,500).
Detailed Discussion
In the remainder of this report (authored by Robin Smith, APSA director of finance and administration), you'll find more detailed discussion and statements regarding the Association's activities and financial condition. Robin reports that despite a broadening of APSA's mission, even while budgets are tightening, our Association has continued to operate efficiently and responsibly. Once again, fiscal year 2007 ended within the operating budget and with growth in the value of our holdings.
APSA Investments for Fiscal Year 2006–07
APSA's audited financial statements, which also include the figures for operations, investments, endowed programs, and grant-funded activities, show an increase in total net assets at June 30, 2007, of $3.943 million for the fiscal year. This performance compares to an increases of $1.021 million in fiscal year 2006, $372,411 in fiscal year 2005, and $3.228 million in 2004, following declines in total net assets of $763,433 and $3.2 million for fiscal years 2003 and 2002.
The gain in net assets for 2006–07 was due chiefly to an overall favorable investment climate, despite softness in certain economic sectors. The Association's overall financial position continues to be strong, with assets of just over $32 million, a headquarters building and adjacent property—both of which continue to appreciate in value—and a stable operating budget (please refer to Table 1 for the APSA Balance Sheet).
Balance Sheet: June 30, 2007 (With Comparable Totals for 2002–2006)

APSA's investment advisor, Cedarpoint Capital Management, Inc., reported that the value of the Trust Pool of investments (which includes the Second Century and award funds) earned 17.2% for fiscal year 2006–07, and the Congressional Fellowship Fund investments earned 19.0%.
By way of comparison, the performance of APSA investments approached that of the S&P 500 Index, which earned 20.6%% during the same period. This strong investment performance for 2007 allowed APSA to continue to recover from investment losses sustained in earlier fiscal years (2002–2004). APSA's portfolios have historically outperformed the S&P 500. (Please refer to Table 2 for more information on APSA's investment portfolio.)
Investment Portfolio Summary for Trust Pool and Endowed Funds, Fiscal Year Ended June 30, 2007

Overall, APSA ended fiscal year 2007 with assets of $32 million and liabilities of $3 million, resulting in a net worth of $29 million. Of this amount, roughly $18 million is restricted as to its use and $11 million is either unrestricted or board-designated.
The net assets may also be defined by type of fund: in round terms, $14 million in the Congressional Fellowship endowment, $5 million in the Trust fund, $6 million in the Second Century and related funds, $2 million in general operating funds, and $1 million in endowed award funds (all at market value as of June 30, 2007).
Operations and Budget in Review: Fiscal Year 2006–2007
Michael Brintnall completed his fifth full year as executive director. The Association's headquarters staff of 25 supported the Association to serve the membership's programming goals, and to respond flexibly to new responsibilities and council-directed projects.
This was a year marked by conferences and meetings, and emerging international initiatives. The 2006 Annual Meeting in Philadelphia was a hugely successful event, and efforts designed to repeat that success were evident in planning for the 2007 Annual Meeting in Chicago. In February 2007 the APSA held its fourth and largest Teaching and Learning Conference, which offered its 300 attendees a robust program in Charlotte, NC. Planning was well under way for the 2008 conference in San Jose, California. Initiatives to promote political science in Africa and India were also key activities during the year.
The APSA web site served as a valuable resource for external audiences and a collaborative workspace for committees and members. APSA's online resources—annual meeting programming, myAPSA, PROceedings, and departmental services—afforded APSA members expansive opportunities to enjoy direct access to and control of Association services and membership renewal.
In terms of earned operating revenue and program expenses, the outcome for the year was within budget expectations. APSA earned approximately $4.6 million in operating revenues and incurred operating expenses of $4.5 million. Actual operating revenue increased during this fiscal year by nearly $130,000 over the prior year, and expenses increased by $215,000. Realized operating revenue met budget expectations, while total operating expense came in under budget.
In 2006–2007, APSA realized the benefit of the first year of its new journal publishing agreement with Cambridge University Press and the fourth full publication year of Perspectives on Politics. The Cambridge agreement has continued to result in increases in revenue and expense for APSA by shifting the bulk of the publishing operation to the publisher.
Cambridge has direct responsibility for collection of institutional (library) dues, the sale of journal advertisements, and the management of royalties and permissions, as well as the PROceedings project and other electronic services. APSA receives a royalty, or share of the revenue that Cambridge brings in, from each of these areas. In addition, Cambridge provides funding for all three of the editorial offices (APSR, PS, and Perspectives on Politics). On the expense side, Cambridge is responsible for marketing, production, printing, and distributing all three journals.
Under this arrangement, APSA has streamlined its operations, reduced costs in several areas, and enhanced capacity to publish a third journal, Perspectives on Politics, without having members bear additional expense.
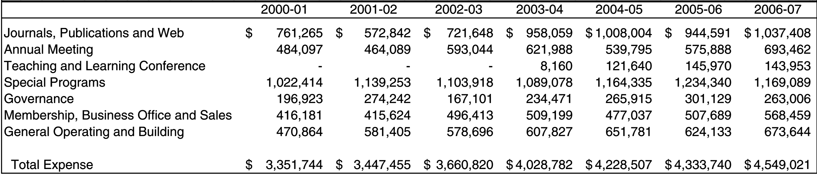
Compared to the prior year, total revenue realized from individual membership dues during 2006–07 remained steady, with rates increased by 3% over the prior year. The cost to deliver services in major program areas—journals, committees, departments, external relations, annual meeting, Teaching and Learning Conference, Centennial Center, publications, organized sections, education and professional development, employment, and awards—increased from 2005–06 by $124,665, or nearly 4%. Supporting these major program areas, the costs for core operations (membership services; general administration, building, and equipment; business office; and depreciation) decreased by $90,618, or 8%, in 2006–07. (Please see Tables 3, 4, and 5 for multiyear comparisons).
Operating Budget 1990–2007: A Multi-Year Perspective

(*) In FY 1992–93, APSA moved to a new budgeting system, making the figures in that year not comparable with those of prior years
Operating Revenue Trends, Fiscal Years 2001–2007

Operating Expenditures Trends, Fiscal Years 2001–2007

APSA Operations in 2007–2008
The recently concluded fiscal year was also defined by a number of achievements. The council enthusiastically endorsed a wide range of significant programs to serve APSA's members. These initiatives included sustained public presence efforts, expanded department and international membership, a comprehensive review of the annual meeting and siting policy, a conference for department chairs, the Teaching and Learning Conference, planning for the first of three annual workshops in Africa, mentoring, and graduate education.
For the fiscal year ending June 30, 2008, the operating budget anticipated revenues of $5.09 million and expenses of $5.08 million. The council approved a modest dues increase that went into effect on July 1, 2007, for individual membership. This resulted in an increase of $1 for students and increases ranging from $2 to $6 for professional members. Please see Table 6 for a detailed comparison of fiscal year 2006–07 revenue and expenses compared to the 2007–08 budget.
Operating Budget

In comparing the budget for the fiscal year 2007–2008, to the actual results of the prior year, operating revenue and expenses were both projected to increase by roughly 11%. The balanced budget forecasted that one-third of total revenue would be derived from individual memberships, nearly one-fourth from the annual meeting, and one-fifth from journals, sales, and advertising revenue streams. The remaining 20% was attributed to investments and administrative sources.
On the expense side of the ledger, costs for the three journals were expected to account for 18% of all operating expenses in fiscal year 2007–2008 (an increase from 16% the prior year), followed by the annual meeting at 15%, committee programs at 14%, and building and equipment (including depreciation costs) at 9%. Business office operations and publications, web and sales expenses constituted 6% of operating costs. At 5% were governance, general administration, and member services costs (down from 6% the prior year). At 4% or less were costs related to external relations, organized sections support, the Teaching and Learning Conference, education and professional development, employment services, the Centennial Center, program review, and endowed awards.
APSA Investments for Fiscal Year 2007–08
As fiscal year 2007–08 came to a close, the market value of the combined funds stood at $24.6 million. After three consecutive negative quarters in the fiscal year, both the Trust and CFP portfolios outperformed the S&P 500 index year-to-date. At June 30, the market value of the Trust portfolio declined 10.9%, and the CFP dropped 11.5%, compared to the S&P 500 Index, which dropped 13.2%. The portfolios are invested in individual common stocks, ETFs, mutual funds, and cash equivalents. Despite market decline, the portfolios adhere to the Association's longer-range asset allocation investment policy, with one-third weighting in mutual funds and two-thirds in equities.
Investing in Our Future
In February and July 2008, the Association's Trust and Development Board of Trustees met to review our manager's report on APSA's investment portfolios, update investment policies, discuss improvements to the APSA headquarters building and the status of our building on 18th Street, and complete the five-year review of our investment manager and portfolio performance. In coming months the board of trustees will consider alternative investment models that could fit with our longer-range asset allocation and portfolio strategy, and other possible lease and use options for the 18th Street building.
As does the entire APSA staff, we welcome your inquiries and suggestions, and look forward to your continued support as APSA moves forward into a new year of initiatives, improvements, and growth.