Introduction
Modern civilization is built upon the capability to control and direct minute electrical currents on the nanometer scale. Shaping matter through doping and lithography has imbued it with the capability to store and process information in the form of electric charges that form the foundation of modern microelectronics. However, the reverse direction, nanoscale control, and manipulation of matter though electrical currents is not yet fully explored and understood. While bias-induced processes underpin the functionality of batteries, fuel cells, and other electrochemical systems, only average behaviors are exploited. The price for the lack of the local knowledge is well recognized: 100s of operation cycles of batteries versus trillions for semiconductor memories;Reference Tarascon and Armand1, Reference Winter, Besenhard, Spahr and Novak2 degradation and fatigue of ferroelectric memoriesReference Tagantsev, Stolichnov, Colla and Setter3 and limited reproducibility in memristive devices; and polarization losses, short life times, and the need for expensive catalysts in fuel cells.Reference Adler4, Reference Bagotsky5 Above all, this dearth of knowledge manifests in tremendous efforts invested into largely phenomenological attempts to improve these technologies. Only by understanding the elementary mechanisms of solid-state electrochemical processes can we bridge the gap between phenomenological knowledge and advanced computational models, paving the way for knowledge-driven design and optimization of these systems. This goal, in turn, necessitates capturing local electrochemical information and comparing it to structural data available from advanced microscopy on the nanometer and atomic scales. This article discusses the challenges and recent progress associated with measuring and controlling ionic transport and electrochemical phenomena on the nanoscale and using scanning probe microscopy (SPM).
Scanning probe microscopies for probing electrochemical phenomena
The nanoscale revolution was largely enabled by SPM techniques that allowed probing and manipulation of structure, electrical, magnetic, and mechanical functionalities on the nanometer and atomic levels.Reference Gerber and Lang6 SPM sheds light on the nanoscale origins of electronic phenomena in superconductors,Reference Pan, Hudson, Lang, Eisaki, Uchida and Davis7 topological insulators,Reference Roushan, Seo, Parker, Hor, Hsieh, Qian, Richardella, Hasan, Cava and Yazdani8 and metal-insulator systems;Reference Fath, Freisem, Menovsky, Tomioka, Aarts and Mydosh9 photo-induced phenomena;Reference Wu, Ogawa and Ho10 kinetics and thermodynamics of chemical reactions on the single molecule level;Reference Rief, Oesterhelt, Heymann and Gaub11 and polarization switching in ferroelectrics on the level of a single defect.Reference Jesse, Rodriguez, Choudhury, Baddorf, Vrejoiu, Hesse, Alexe, Eliseev, Morozovska, Zhang, Chen and Kalinin12, Reference Kalinin, Jesse, Rodriguez, Chu, Ramesh, Eliseev and Morozovska13 These advances naturally lead to questions as to whether SPM can be used to decipher the interplay between electronic and ionic transport and reactions in electrochemical (EC) systems on the nanometer and atomic scale levels.
Compared to classical “physical” systems in which the number of species and connectivity of the atomic lattice is maintained, the dynamic nature of electrochemical systems offers a number of challenges for SPM. First, the nature of EC systems implies the presence of mobile ionic species that redistribute in response to minute changes in external potentials and environment. Many materials (e.g., anodes) are unstable in ambient conditions and rapidly oxidize, while cathode materials tend to get covered by carbonaceous products. These situations therefore require precise control of the local environment. Second, many electrochemical systems have a complex 3D morphologyReference Winter, Besenhard, Spahr and Novak2, Reference Magasinski, Dixon, Hertzberg, Kvit, Ayala and Yushin14 poorly suited for the SPM. Third, the length scales of relevant phenomena, including the diffusion and Debye lengths (the length over which mobile charges screen electric fields) controlling ionic transport and electric field penetration as well as the size of structural defects that act as nucleation centers, are often only a few nanometers, necessitating high resolution imaging techniques. Notably, many of these challenges are also valid for electron microscopy or focused x-ray methods, in which a sample can change stoichiometry and decompose under exposure to a vacuum environment and e-beam or x-ray irradiation.
A number of SPM studies of electrochemical systems have been reported, typically using home-built environmental chambers and cells.Reference Kalinin and Balke15 Several groups have explored the evolution of surface topography at solid-liquid and solid-gas interfaces under electrochemical control,Reference Kostecki and McLarnon16 providing insights into the nucleation of individual metal nanoparticles,Reference Lee, O’Hayre, Prinz and Gur17 formation of solid-electrolyte interface layers in Li-ion batteries,Reference Alliata, Kotz, Novak and Siegenthaler18 and tip-induced nano-oxidationReference Garcia, Calleja and Perez-Murano19 and metal nanoparticle formation.Reference Garcia, Losilla, Martinez, Martinez, Palomares, Huttel, Calvaresi and Zerbetto20, Reference Garcia, Martinez and Martinez21 These techniques have gained special prominence in the context of nanopatterning substratesReference Tian, Timmons and Dahn22 and allowed for probing of nanobattery structures.Reference Vullum and Teeters23 A number of SPM studies of ionic dynamics and diffusion using Kelvin probe force microscopyReference Lee, Lee, Kim and Prinz24 and (time-resolved) electrostatic force microscopyReference Taskiran, Schirmeisen, Fuchs, Bracht and Roling25, Reference Schirmeisen, Taskiran, Fuchs, Bracht, Murugavel and Roling26 have been reported. Similarly, conductive atomic force microscopy (AFM) has been used to probe phase evolution in electrochemical systems.Reference McEvoy and Stevenson27 Finally, several groups have attempted to combine classical electrochemical strategies such as electrochemical impedance spectroscopy with SPM.Reference Shao, Kalinin and Bonnell28–Reference Louie, Hightower and Haile31
Principles and implementation of electrochemical strain microscopy
Quantitative local probing of electrochemical and ionic processes necessitates the development of high-sensitivity, selective detection strategies.Reference Kalinin and Balke15 Detection of changes in surface topography offers only limited chemical sensitivity and measurement bandwidth. Non-contact electrostatic force-based strategies allow only limited spatial resolutions (∼50 nm) and are more sensitive to excess charges in the system (e.g., those injected by the tip) than electroneutrality-maintaining changes in ionic concentrations and local work function. DC current-based strategies (conductive AFM) detect the sum of ionic and electronic currents, with the latter being dominant for many material classes. Finally, ac-based techniques are limited by stray capacitances of the cantilever and measurement system, which dominate that of the tip-surface junction.Reference Shao, Kalinin and Bonnell28, Reference O’Hayre, Lee and Prinz29
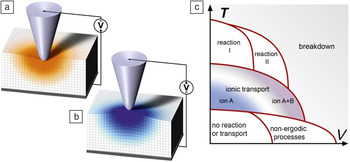
Recently, a novel approach to electrochemical imaging based on the detection of dynamic electrochemical strains was developed. In tip-electrode electrochemical strain microscopy (ESM),Reference Balke, Jesse, Morozovska, Eliseev, Chung, Kim, Adamczyk, Garcia, Dudney and Kalinin32, Reference Balke, Jesse, Kim, Adamczyk, Tselev, Ivanov, Dudney and Kalinin33 the SPM tip concentrates an electric field in a small volume of material below the tip, inducing interfacial electrochemical reactions and ionic motion in the material. The strong coupling between ionic concentration and molar volume results in localized strains and hence surface displacement, as illustrated in Figure 1a.Reference Morozovska, Eliseev, Balke and Kalinin34 The latter is further detected by the tip, which acts as a local strain sensor similar to piezoresponse force microscopy (PFM) of piezoelectric and ferroelectric materials.Reference Gruverman and Kholkin35–Reference Balke, Bdikin, Kalinin and Kholkin38 In top-electrode ESM, the electrochemical process is induced over the whole sample surface, and the SPM tip detects local strains, somewhat similar to PFM of capacitor structures.Reference Gruverman and Kholkin35, Reference Bintachitt, Trolier-McKinstry, Seal, Jesse and Kalinin39
In electrochemical strain microscopy (ESM), a biased atomic force microscopy tip is brought into contact with an ionically conductive material. The concentrated field at the tip induces ion redistribution, which in turn results in material strain and surface deformation. The latter is detected as vertical tip displacement. Shown schematically is (a) an accumulation of negative species and (b) positive species during application of positive and negative tip bias, respectively. (c) The spectrum of possible electrochemical and ionic phenomena as a function of bias (V) and temperature (T) that can be explored by ESM.

The simplicity of the ESM concept is contrasted by the complexity of implementation. The detection of small dynamic displacements necessitates the use of resonance enhancement, a common strategy in force-based SPM techniques. However, the typically large roughness of electrochemically active surfaces results in a strong position dependence of the contact resonance (indirect crosstalk).Reference Jesse, Guo, Kumar, Rodriguez, Proksch and Kalinin40 This problem can be obviated by using the recently available amplitude-based feedback schemes for resonance tracking,Reference Rodriguez, Callahan, Kalinin and Proksch41 fast lock-in sweeps, in which the frequency of a single frequency lock-in amplifier is swept very quickly (on the order of 1 kHz/ms),Reference Kos and Hurley42 or band excitation detection.Reference Jesse and Kalinin43, Reference Jesse, Kalinin, Proksch, Baddorf and Rodriguez44 Second, the characteristic resonant frequency of the cantilevers (0.1–1 MHz) is well above the inverse diffusion times, typically on the order of 0.1–10 s for most battery relevant ionics at room temperature, and transport lengths on the order of several nanometers. This consideration requires the development of time and voltage spectroscopies, in which the ESM signal is probed as a function of time after a bias pulse or during a voltage sweep at relevant time scales.Reference Guo, Jesse, Kalnaus, Balke, Daniel and Kalinin45, Reference Jesse, Balke, Eliseev, Tselev, Dudney, Morozovska and Kalinin46 By controlling detection times and sweep rates, characteristic diffusion regimes can be addressed. More complex spectroscopic methods can be developed for separating reaction and transport phenomena or kinetic and thermodynamic aspects of bias-induced transformations.
The operation of the ESM is illustrated in Figure 1a–b. The biased SPM tip concentrates an electric field in a roughly (10 nm)3 volume of material, inducing interfacial electrochemical processes at the tip-surface junction and ionic currents through the solid. The intrinsic link between the concentration of ionic species and/or oxidation states of the host cation and the molar volume of the material results in electrochemical strain and surface displacement. For the prototypical cathode material LiCoO2, the lattice parameter changes linearly with the degree of lithiation, x, by 40 pm in the operating region of LixCoO2 from x = 1 to x = 0.5.Reference Amatucci, Tarascon and Klein47 Combined with the 3–4 pm sensitivity limit of modern AFMs, this suggests that a lithiation state change of just 10% can be measured through 1 unit cell of material. Note that this chemical expansivity is ubiquitous for virtually all ionic and mixed ionic-electronic conductors,Reference Adler48–Reference Kharton, Marques and Atkinson50 suggesting broad applicability of ESM to many of these systems.
Application of local biases to ionic systems can give rise to a broad spectrum of possible ionic and electrochemical phenomena, as illustrated in Figure 1c. For low temperatures and low voltages, ionic mobility is frozen. At higher biases and moderate temperatures, migration in strong fields and charge injection become possible, giving rise to electret-like behavior in which the material maintains an electric polarization. At higher temperatures, ionic mobilities and electrochemical reactions are enabled. In cases of high bias and temperature, material decomposition and the likelihood of material breakdown increases. Note that critical bias sensitively depends on the nature of the material, SPM probe, and environment, as well as ratio of the potential drops at the tip-surface junction and in the bulk.Reference Kumar, Ciucci, Morozovska, Kalinin and Jesse51, Reference Kalinin, Jesse, Tselev, Baddorf and Balke52
ESM of Li-ion materials
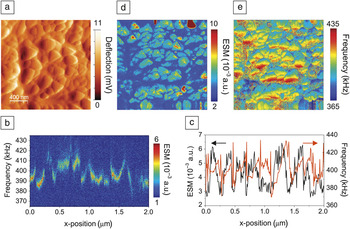
ESM imaging is illustrated for LiCoO2 (LCO) thin films. This material has gained special prominence as a cathode of Li-ion batteries in mobile devices, stimulating extensive efforts into understanding its structural, electronic, and ionic properties. Figure 2a shows the surface topography of an RF-sputtered (radio frequency) LCO thin film surface on an Al2O3 substrate. ESM measurements were performed using the band excitation (BE) approach. Shown in Figure 2b is a 2D spectrogram along a 2 μm section of the surface. These data can be analyzed to deconvolute the contact resonance peak height and contact resonance frequency for each point, as displayed in Figure 2c. Of these, the amplitude of the response is proportional to local electrochemical activity,Reference Morozovska, Eliseev, Balke and Kalinin34 while the position of the resonance peak is determined by the mechanical properties of the tip-surface junction.Reference Jesse, Guo, Kumar, Rodriguez, Proksch and Kalinin40 Note that in single frequency SPM, these parameters cannot be unambiguously separated.
Electrochemical strain microscopy (ESM) study of an LiCoO2 thin film. (a) Topography of the LiCoO2 thin-film surface (deflection signal). (b) Variation of contact resonance peaks across a single line scan on the sample. (c) Extracted resonance peak amplitude and resonance frequency as a function of position from (b). (d) Map of ESM signal (amplitude of contact resonance peak) for the area shown in (a). (e) Map of contact resonance frequency for the area shown in (a). Adapted with permission from Reference Reference Kalinin, Balke, Jesse, Tselev, Kumar, Arruda, Guo and Proksch72. ©2011, Elsevier.

Spatially resolved maps of ESM amplitude and resonance frequency are shown in Figure 2d–e. Grains show different ESM amplitudes, which can be interpreted as a variation in Li-ion mobility. This variability can be attributed to the different crystallographic orientations of the grains with respect to the SPM tip axis and strong anisotropy of ionic transport in LCO. At the same time, the contact resonance frequency image in Figure 2e shows significant changes of resonant frequency within the grains, largely related to surface topographic variations. The complementary nature of the images in Figure 2d–e illustrates the veracity of the BE ESM approach, which largely obviates crosstalk with the topography.
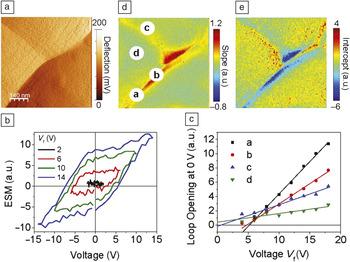
Spectroscopic ESM techniques are illustrated for a Si anode in an all-solid thin-film battery structure. These structures are formed with a LiCoO2 cathode on the bottom, a nitrogen-doped lithium phosphate (LiPON) electrolyte in the middle, and an amorphous Si anode on the top.Reference Bates, Dudney, Neudecker, Ueda and Evans53 Here, we focus on ESM voltage spectroscopy, where the ESM signal is measured after the application of short voltage pulses with increasing and decreasing amplitude.Reference Balke, Jesse, Kim, Adamczyk, Ivanov, Dudney and Kalinin54Figure 3a shows the topography of the Si anode measured with the AFM tip. The anode shows clear grain boundary features (despite the amorphous nature of the Si) that form due to the substrate’s rough surface morphology.
Electrochemical strain microscopy (ESM) study of a Si anode of a thin-film Li-ion battery. (a) Topography of the Si anode (deflection signal). (b) Extracted ESM voltage spectroscopy loops as functions of envelope voltage V f measured at the grain boundary-like feature. (c) Loop opening as a function of envelope voltage V f with linear fit from four different locations, labeled a–d, in (d). (d) Slope and (e) intercept parameter maps for the area shown in (a). Note that a hysteresis loop family similar to that in (b) is obtained at each point of the 100 × 100 pixel grid in (a), giving rise to a 30 Gb data set. This data set, however, can be reduced to two 2D maps indicating the rate (d) and onset bias (e) for ion motion. Adapted with permission from Reference Reference Balke, Jesse, Kim, Adamczyk, Ivanov, Dudney and Kalinin54. ©2010, American Chemical Society.

Voltage spectroscopy ESM at a boundary-like feature is shown in Figure 3b. The ESM signal after the voltage pulses is hysteretic in nature, suggesting that the probing time is comparable to the diffusion time in the probed volume. To deconvolute transport and electrochemical reactivity, we introduce first-order reversal curve (FORC) measurements in ESM voltage spectroscopy. In this mode, measurements at each location were performed as a function of maximum pulse amplitude V f in ESM hysteresis loop measurements. Figure 3c shows the loop opening (defined as the area inside a hysteresis loop) as a function of V f at four different locations (a–d), as indicated in Figure 3a. The response is linear in voltage, and the critical voltage for reaction onset (intercept of linear fit) and effective mobility of the Li-ion transport (slope of linear fit) can be extracted. FORC ESM voltage spectroscopy was performed on a spatial grid of 100 × 100 points in the area shown in Figure 3a. The hysteretic response versus voltage data at each spatial point is fitted by a linear function. The fitted slope and intercept are shown in Figure 3d–e, respectively. The critical bias for reaction onset generally varied between 0 and 5 V, close to the potential of the Si-LiCoO2 battery. It can also be seen that the ionic mobility is higher at the grain boundary-like features. The fact that most of the observed ion activity is restricted to the small volume of material in the vicinity of the boundaries (relative to the total volume of the anode) suggests that the performance could be improved by grain boundary engineering, or nanoscale patterning, of the material when the particle size is below that for the onset of mechanical deformation. This prediction agrees with recent studies that demonstrated high cycle number stability of the Si nanowire and nanoparticle materials.Reference Magasinski, Dixon, Hertzberg, Kvit, Ayala and Yushin14, Reference Chan, Peng, Liu, McIlwrath, Zhang, Huggins and Cui55
ESM of oxygen conductors
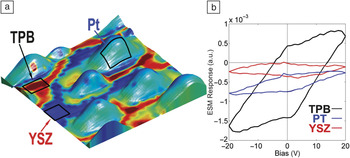
As with batteries, electrochemical activity and ionic transport are the most critical aspects of fuel cell performance. However, in solid-oxide fuel cells, the mobile species of interest is the oxygen ion, and ESM has been used to explore electrochemical activity on the nanoscale of this important class of materials. An example of ESM mapping of oxygen conductors is illustrated in Figure 4 for Pt nanoparticles deposited on a yttria-stabilized zirconia (YSZ) surface.Reference Kumar, Ciucci, Morozovska, Kalinin and Jesse51 The electrochemical activity in these materials is typically largest at the triple phase boundary (TPB), a region where the catalyst electrode is in contact with both the reactants and the electrolyte. Figure 4a shows the surface topography of the Pt nanoparticles deposited on a YSZ (100) crystal using direct sputter deposition and laser annealing. The ESM response was mapped in a 300 nm region containing several nanoparticles. The reactivity map is shown as a color overlay in Figure 4a, revealing increased reactivity close to the triple phase boundary in comparison to the free YSZ surface. The corresponding ESM hysteresis loops are shown in Figure 4b. Note the relatively weak ESM response of the particle itself, sharp increase of reactivity at the triple-phase junction, and low reactivity on the YSZ surface.
Electrochemical strain microscopy (ESM) mapping of Pt nanoparticles on YSZ. (a) Topography (300 × 300 nm) of Pt nanoparticles deposited on YSZ with a map of the measured area within ESM hysteresis loops overlaid on the 3D surface morphology. (b) Average hysteresis loops from selected regions of the map. Local enhancement of electrochemical activity and the triple phase boundary (TPB) between the substrate, Pt, and air is clearly seen. Adapted with permission from Reference Reference Kumar, Ciucci, Morozovska, Kalinin and Jesse51. ©2011, Nature Publishing Group.

When the tip is positioned on the nanoparticle, the particle is biased as a whole, and the oxygen reduction/oxygen evolution reaction (ORR/OER) processes are activated. The particle size is much larger than the tip size, and hence the field within the YSZ (and thus migration motion) is weaker. When the tip is positioned on the YSZ surface, the applied bias is insufficient to activate the OER/ORR process, and hence the hysteresis loop area is fairly small. Finally, for the tip positioned on the junction between the nanoparticle and substrate, the enhanced response at the TPB is visible.
The enhanced response near the electroactive particle can be modeled using a decoupled mechanics/electrochemistry framework.Reference Morozovska, Eliseev, Tagantsev, Bravina, Chen and Kalinin56 The latter involves solution of the Poisson-Nernst-Planck equation, which describes ionic transport and features the Poisson equation for charge self-consistency, coupled with a detailed electrochemical mechanism. The solution typically requires the finite element method adapted to proper sample geometry.Reference Ciucci, Chueh, Goodwin and Haile57, Reference Lai and Ciucci58 The finite element mesh is iteratively updated during computation to ensure that the computed solution is closest to the exact solution. The mechanical displacement can be taken to be proportional to the charge stored under the ESM tipReference Morozovska, Eliseev, Balke and Kalinin34 or determined self-consistently from the solution of a coupled electrochemical-mechanical model.
For the particular case of the Pt-YSZ system, the model shows that higher electrocatalytic reactivity correlates with increased stored charge magnitude, thereby leading to enhanced displacement. In addition, the charge is localized, within a few Debye lengths, under the tip and is more sensitive to the potential difference applied than to the local stoichiometric changes of the material. The TPB region is also strongly affected by the bias applied. In particular, the model confirms that the ionic electrochemical potential increases in magnitude near the TPB. Such an effect is readily explained by noting that the tip is essentially impermeable to ions, and the reactions are driven preferentially at the TPB. All of these considerations indicate that an increase in measureable displacement correlates with ORR/OER, and while the driving reactions may occur near the TPB, the tip is almost exclusively affected by the charge displacement. This unique trait makes ESM particularly well suited for studying ORR/OER in pure ionic conductors.
ESM of irreversible processes
The ESM time and voltage spectroscopies described previously are ideally suited for exploration of reversible electrochemical processes. At the same time, many electrochemical processes are partially or completely irreversible. Some notable examples include local nano-oxidation of semiconductors and metals or the local formation of carbonaceous, metal, or semiconductor particles.Reference Garcia, Martinez and Martinez21 More generally, these include solid-electrolyte interphase (SEI) formation in Li-ion batteries,Reference Alliata, Kotz, Novak and Siegenthaler18 and partial decomposition and second phase formations that lead to fatigue, failure, and fading of electrochemical systems ranging from batteries to fuel cells.Reference Tarascon and Armand1, Reference Bagotsky5, Reference Girishkumar, McCloskey, Luntz, Swanson and Wilcke59, Reference Goodenough and Kim60 In some cases, including SEI formation and conductive filaments formation in memristive and electroresistive electronics,Reference Waser, Dittmann, Staikov and Szot61 these processes are instrumental in device operation.
Probing irreversible electrochemical processes requires somewhat different paradigms for SPM detection. Namely, the bias-induced transformation should now be detected immediately after onset, necessitating both (1) the search for reliable detection strategies and (2) implementation of rapid feedback schemes to terminate the bias sweep immediately after detection. The size of a bias-transformed region then determines the spatial resolution.
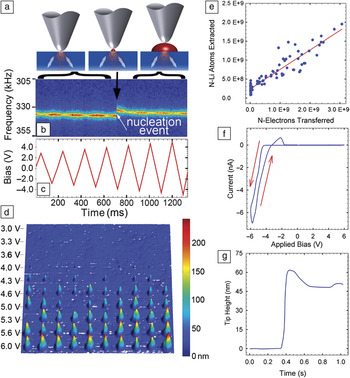
The ESM signal provides information on the evolution of ion activity. Hence, the same ESM measurements performed in a reversible regime can also be performed at all stages of an irreversible process, thus providing information on the processes preceding the reaction (e.g., accumulation of oxygen vacancies preceding conductive filament formation in memristors) or on induced changes after the process. Recent work on irreversible and partially reversible electrochemical processes on Li-conducting glass ceramic substrates is summarized in Figure 5.Reference Arruda, Kumar, Kalinin and Jesse62 In these experiments, a bias applied to a conductive AFM probe induces not only ion redistribution within the material, but also the transport and deposition of Li to the surface. This process in many ways emulates the charging of Li-air batteries, except on a much smaller scale and under more controlled conditions. Figure 5a illustrates schematically the nucleation and growth of a Li-particle below a biased AFM tip. The formation of nanoparticles can be detected as a shift in the cantilever resonance frequency, as illustrated in Figure 5b during the application of a bias waveform shown in Figure 5c. Figure 5d shows the surface topography measured after several line scans of successively larger amplitude voltage sweeps across the surface of the Li-ion conductive electrolyte.Reference Arruda, Kumar, Kalinin and Jesse62Figure 5e plots the charge transferred during particle formation versus the volume of the particle, showing the linear correlation between the two. During completely irreversible particle formation events, the slope of this line is close to unity. In cases when some reversibility is present, the slope of this line is less than 1. Currents on the order of one to tens of nA are observed for biases in the range of 3 to 10V, corresponding to purely Faradaic currents (i.e., electrochemical charge transfer as opposed to capacitive currents) in the reaction Li+ + 1e– → Li(s). This process is associated with a change in the tip height above the original surface, as shown in Figure 5g. Following the application of the bias, the formation of a nanoparticle on the surface is observed. The total number of metallic Li atoms deposited (as determined by particle volume from integration of the topography) on the surface is ∼109 and scales linearly with the total transferred charge. Note that the AFM can readily detect nanoparticles ∼1–2 nm scale (depending on background surface roughness), suggesting that Faradaic current measurements are limited for local electrochemical probing. For example, a Li particle (of the same cone-type shape illustrated in Figure 5) with a 4 nm diameter and 4 nm height would require <1000 electrons (corresponding to sub ∼fA currents for 1 s), well below the noise levels and detection limit of typical current amplifiers used in SPM.
(a) Schematic illustration of Li particle growth below the tip. (b) Evolution of the electrochemical strain microscopy signal during bias sweep. The jump in resonance frequency corresponds to the nucleation event. (c) Plot of bias applied to the tip versus time. (d) Surface topography (25 × 25 μm) of Li-nanoparticles deposited on the Li-conducting glass ceramic surface as a function of bias amplitude. (e) Correlation between particle volume and amount of transferred charge, corresponding to the near-unity transference number. (f) Current–voltage and (g) height–voltage curves measured during single particle growth. Note the presence of an anodic peak, indicative of partial reversibility of the process. The presence of an anodic peak in the I–V curve is always associated with a reduction in the height of the particle, in agreement with partial reversibility of the process. Note: N, number of Li atoms extracted. Adapted with permission from Reference Reference Arruda, Kumar, Kalinin and Jesse62. ©2011, American Chemical Society.

Future perspectives
Electrochemical reactions and ionic transport underpin the functionality of batteries, fuel cells, and memristors. However, complementing the research in solid-state ionics, the last three years have seen a rapidly growing appreciation of the role of electrochemical phenomena in the physics of transition metal oxides. Recently, the role of surface electrochemical mechanisms has been explored, for example, for charge writing in LaAlO3-SrTiO3 systemsReference Bristowe, Littlewood and Artacho63, Reference Bi, Bogorin, Cen, Bark, Park, Eom and Levy64 or ferroelectric polarization stability.Reference Wang, Fong, Jiang, Highland, Fuoss, Thompson, Kolpak, Eastman, Streiffer, Rappe and Stephenson65, Reference Sai, Kolpak and Rappe66 Many recent resultsReference Yi, Choi, Choi, Oh and Cheong67, Reference Jiang, Noman, Lu, Bain, Salvador and Skowronski68 illustrate that reversible vacancy redistribution in oxides is possible at room temperature and below in sufficiently high electric fields. These studies complement such established areas as irreversible fatigue of ferroelectric materials.Reference Tagantsev, Stolichnov, Colla and Setter3 Similar conclusions were reached in the electrochemical community, when bias-induced ionic motion was observed at temperatures well below that of fuel cell operation.Reference Fleig, Schintlmeister, Opitz and Hutter69
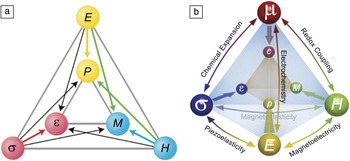
The considerations of static and dynamic ionic behaviors are crucial for the understanding of a broad range of material systems, including strongly correlated oxides. This forces us to go beyond the view of oxide functionality suggested by Fiebig and SpaldinReference Spaldin and Fiebig70 (Figure 6a) that explores the coupling between magnetic, polarization, and lattice phenomena. When the number of atoms in the system is no longer constant, the Fiebig-Spaldin diagram acquires an extra chemical dimension, as illustrated in Figure 6b. Chemical effects lead to changes in lattice volume (Vegard strains).Reference Adler48 These effects are remarkably strong—while piezoelectric lattice strains are on the order of 0.1–0.5%, chemical strains can easily be in the 1–10% range. This molar volume change will affect ferroelectric phase stability (e.g., in incipient ferroelectrics such as SrTiO3). Tilting of the oxygen octahedral network and cation valence will affect magnetic, electronic, and transport properties. Finally, ionic phenomena are strongly affected by electric fields (vacancies are charged) and can be controlled by electric fields. The role of the vacancy dynamics can be expected to be particularly important at the interfaces and in the vicinity of the structural defects. Indeed, charged vacancy redistribution offers a natural pathway for the screening of electrostatic fields due to work function differences between materials. Similarly, vacancies tend to have 1.2–1.3 larger volume than lattice oxygen, and hence offer a channel for strain relaxation and screening of long-range elastic fields.Reference Kim, Disa, Babakol and Brock71
Ionic motion can lead to new functionality and couplings in multiferroics. (a) Fiebig-Spaldin diagram showing the inter-relationship of the electric field E, magnetic field H, and stress σ controlling the electric polarization P, magnetization M, and strain ε, in multiferroics. (b) The physics of multiferroics can change dramatically when mobile ionic species are considered, which adds a new dimension to the physics. μ is chemical potential, and c is concentration. The base of the tetrahedron in (b) is equivalent to (a). Adapted with permission from Reference Reference Spaldin and Fiebig70. ©2005, American Association for the Advancement of Science.

In order to better grasp the complex physics involved in the interactions between structure and strain, electronic, magnetic, and chemical phenomena, it is necessary to study these phenomena on their relevant length scales, in other words, on the order of diffusion, Debye, and strain screening lengths. Furthermore, the dominant role of interfacial phenomena and defects on virtually all first-order transformations, and the small length scales of the corresponding interactions, necessitates local nanometer and atomic-scale studies. Electrochemical strain microscopy can become a critical tool for probing ionic phenomena on nanometer scales. Further instrumental developments and insights will come from a combination of electrochemical strain microscopy with scanning transmission electron microscopyReference Waser, Dittmann, Staikov and Szot61, Reference Arruda, Kumar, Kalinin and Jesse62 and focused x-ray techniques, with the ultimate goal being to unravel the complex interplay between order parameter dynamics, ionic flows, electrochemical reactions, and mechanical phenomena on the length scale of individual defects and catalyst particles.
Acknowledgments
This research (S.J., S.V.K., Y.K.) was conducted at the Center for Nanophase Materials Sciences, which is sponsored at Oak Ridge National Laboratory by the Scientific User Facilities Division, Office of Basic Energy Sciences, US Department of Energy. The authors (T.M.A., S.J.) acknowledge financial support by the Laboratory Directed Research and Development Program.