INTRODUCTION
Owing to the high rates of vocalization by many cetacean species, passive acoustic surveys have the potential to be a very effective survey method. Depending on the question, acoustic methods offer several advantages over visual surveys, including detection of submerged animals, allowing 24 hour monitoring and less dependence on calm weather (Leaper et al., Reference Leaper, Chappell and Gordon1992; McDonald & Fox, Reference McDonald and Fox1999; Carstensen et al., Reference Carstensen, Henriksen and Teilman2006). Passive, static systems minimize disturbance to the subject animals, and the use of standardized equipment eliminates observer bias (McDonald & Fox, Reference McDonald and Fox1999; Wang et al., Reference Wang, Wang, Akamatsu, Li and Xiao2005). Disadvantages of acoustic methods include potential uncertainty in species identification, limited spatial coverage by static systems and the varying effects of sound source levels, distance to the receiver and phonation rates on detection rate (Wang et al., Reference Wang, Wang, Akamatsu, Li and Xiao2005; Tougaard et al., Reference Tougaard, Poulsen, Amundin, Laresen, Hansen, Teilman, Leeney and Tregenza2006).
The T-POD (Timing POrpoise Detector; Chelonia Ltd, UK) is an autonomous, battery-powered data logger, designed to record the occurrence and timing of cetacean echolocation clicks. During a deployment, the T-POD logs timing information about only the sounds which the inbuilt filters are set to detect. The accompanying software (TPOD.exe) applies a click train detection algorithm that detects and classifies trains of logged clicks into one of four categories (‘Cet Hi’, ‘Cet Lo’, ‘Doubtful (?)’ and ‘Very Doubtful(??)’) according to how likely they are to be of cetacean origin, or as ‘Fixed’ if they occur at a fixed rate—this is characteristic of boat echo-sounders. For the purposes of this paper, ‘Very Doubtful’, ‘Doubtful’, ‘Cet Lo’ and ‘Cet Hi’ are grouped into a new category, ‘All Trains’, and ‘Cet Lo’ and ‘Cet Hi’ are grouped as ‘Cet All’. Further details concerning the T-POD and how it works can be found at http://www.chelonia.co.uk/about_the_tpod.htm.
T-PODs were designed to be used in studies of habitat use and echolocation behaviour of harbour porpoises (Phocoena phocoena, Cox et al., Reference Cox, Read, Solow and Tregenza2001; Koschinski et al., Reference Koschinski, Culik, Henriksen, Tregenza, Ellis, Jansen and Kathe2003; Carlström, Reference Carlström2005; Verfuß et al., Reference Verfuß, Honnef, Meding, Dahne, Mundry and Benke2007), and so are inherently suited to detecting high-frequency narrowband clicks characteristic of the Phocoenids.
Hector's dolphin (Cephalorhynchus hectori van Beneden 1881) is a coastal delphinid endemic to New Zealand (Slooten & Dawson, Reference Slooten, Dawson, Ridgway and Harrison1994), with a very simple vocal repertoire, consisting almost exclusively of ultrasonic clicks (Dawson, Reference Dawson1991). The clicks are high-frequency (mean peak frequency = 124.2 kHz), narrow-band (median 3-dB bandwidth = 20 kHz) and relatively long (mean duration = 137.5 µs, Dawson & Thorpe, Reference Dawson and Thorpe1990). They are remarkably similar to those made by harbour porpoise (see Au et al., Reference Au, Kastelein, Rippe and Schooneman1999, and references therein, for a description of harbour porpoise sounds). Given its success at detecting harbour porpoise clicks, the T-POD has potential for passive acoustic monitoring of Hector's dolphins. Nevertheless, verification of effectiveness is required. Akamatsu et al. (Reference Akamatsu, Wang, Wang and Wei2001) recommended that novel acoustic survey methods be accompanied by simultaneous visual surveys in order to determine how the probability of detection varies with range.
This paper describes the first trial of the T-POD to evaluate its effectiveness for static acoustic monitoring of Hector's dolphins. The aims were to confirm that T-PODs detect Hector's dolphins reliably, determine over what range they are effective and investigate the T-POD's click train classification process.
MATERIALS AND METHODS
T-POD deployments
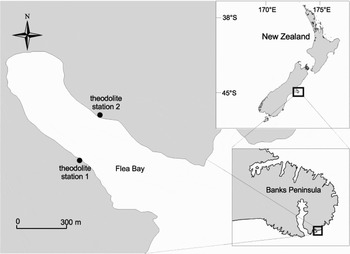
T-POD trials were conducted in Flea Bay marine reserve on the south-eastern side of Banks Peninsula, where Hector's dolphins are frequently seen (Figure 1). On eight days in January and February 2003, a research vessel (15.3 m catamaran) was anchored roughly in the middle of Flea Bay. A version 3 T-POD (number 196) was deployed 1.5 m above the seabed (in ~10 m of water) from the stern of the research vessel. Between December 2005 and March 2006 an additional seven days of T-POD trials were conducted. During these trials, the research vessel was not present and the T-POD was tethered to a temporary mooring on the seafloor. The mooring was marked at the water surface with a buoy.
Location of Flea Bay and the hill-side theodolite stations.

Given the close similarity of Hector's dolphin sonar sounds to those of harbour porpoise, all six scans on the T-POD were set to the default harbour porpoise settings (i.e. target (A) filter frequency = 130 kHz, reference (B) filter frequency = 90 kHz, selectivity (ratio A/B) = 5, (A) integration period = short, (B) integration period = long, sensitivity = 4, limit on clicks logged per scan = 240).
Data were downloaded to a PC at the end of each day and click trains were detected and classified by TPOD.exe v.8.11. The click train data were exported using TPOD.exe's ‘Export train details’ function, yielding various characteristics of each click train, including number of clicks, train duration, mean inter-click interval (ICI) and mean click duration. These four parameters of the different click train classes were compared with Kruskal–Wallis ANOVAs, with multiple comparisons of means by Dunn's test (Zar, Reference Zar1999, p.224) using the Bonferroni correction (see also Thomsen et al., Reference Thomsen, van Elk, Brock and Piper2005).
Theodolite observations
During the T-POD deployments, land-based observations were made from one of two points overlooking Flea Bay; theodolite Station 1 (100 m elevation; Figure 1) or theodolite Station 2 (94 m elevation). Choice between observation sites was made each day according to the prevailing weather conditions, particularly sun angle.
A Theomat Wild T1000 electronic theodolite interfaced with a Hewlett-Packard 200LX palmtop computer, time synchronized with the T-POD, was used to measure the range from the T-POD to the nearest dolphin group. The theodolite was accurate to within <1 m over the ranges observed during the trials. Two observers scanned the bay for Hector's dolphins using binoculars and naked eyes. A dolphin group was defined as a number of dolphins within approximately five body lengths of each other, closely associating and engaged in similar activities (Constantine et al., Reference Constantine, Brunton and Dennis2004). When a dolphin group was sighted, one person used the theodolite to take fixes on the group while the other operated the palmtop computer, recording the fix position and dolphin group size. Fixes were taken from the centre of the group while the dolphins were visible at the water surface, and only when the observers were confident that the focal group was the only one in Flea Bay within 1000 m of the T-POD. Dolphins typically surfaced four or five times at intervals of 5–10 seconds before diving for approximately 90 seconds. During these long dives a fix was taken on the stern arch of the research vessel (2003) or on the mooring buoy (2005/6) and used as a proxy for the position of the T-POD. All observations were made in conditions in which the land based observers were confident they could see Hector's dolphins if they were present in Flea Bay, i.e. in daylight hours with Beaufort sea state ≤3.
Wide-band recordings
To confirm that the sounds detected by the T-POD were Hector's dolphin clicks a wide-band recording system was set up on the research vessel during the 2003 trials. The recording system comprised a Sonatech 8178 wide-band hydrophone, a custom made pre-amplifier and a Racal Store 4DS recorder, operated at 76.2 cm s−1. At these tape speeds, the system has a combined frequency response of 150 Hz to 150 kHz (±3 dB). The hydrophone was deployed so that it was approximately 2 m from the T-POD.
Two people stayed aboard the research vessel and remained in contact with the land based observers via VHF radio. Since the Racal uses tape at 76.2 cm s−1, it was impractical to have it running for the entire monitoring period. Recordings were therefore made at selected times when Hector's dolphins were close (<100 m) to the research vessel. Recordings were synchronized by setting the T-POD to GPS time prior to deployment and dictating GPS time onto the Racal's commentary channel each time a recording was started.
Sequences of Hector's dolphin clicks recorded on the Racal were digitized at an effective sampling rate of 768 kHz at 16 bit precision. Click spectra were calculated in the acoustic software Canary (1024 points, analysing filter bandwidth 3045 Hz, Hamming window). The digitized sequences were compared with click trains logged by the T-POD.
Data analysis
The maximum detection distance was defined as the maximum distance between the focal dolphin group and the T-POD, which corresponded to an acoustic detection on the T-POD within 10 seconds of the theodolite fixFootnote 1.
To investigate the effect of distance to the dolphin group on performance of the T-POD, we calculated the probability of detecting a dolphin group, and click train detection rate. Detection probability is a useful measure of how likely the T-POD is to detect a dolphin group given that it approaches to within a certain distance of the T-POD. However, detection probability does not account for the fact that groups spend different amounts of time within range of the T-POD. For example, a group that spends 10 minutes within 200 m of the T-POD may be more likely to be detected than a group that spends one minute within 100 m. Therefore, we calculated click train detection rate at varying distances. Firstly, dolphin fixes were assigned to one of six bins (i) according to distance from the T-POD (i = 0–99 m, 100–199 m, 200–299 m, 300–399 m, 400–499 m, >500 m). When subsequent fixes of the same dolphin group were made in the same distance bin, the time that the group spent in that bin was calculated and referred to hereafter as a ‘period’. To be confident that the group had stayed within the same distance bin, subsequent fixes had to be <180 seconds apart in order to be included in the same period. The times of the theodolite fixes were compared with the detections by the T-POD and the number of click train detections in each period was counted. The train detection rate, R j, for each period was then calculated as:

where: C j is the number of click trains detected in period j, T j is the duration of period j in minutes.
The values of R j were then averaged within each distance bin.
The acoustic detection probability for each distance bin, P i, was calculated as:

where: D i is the number of periods in distance bin i with acoustic detections of dolphins, N i is the total number of periods in distance bin i.
In order to provide a realistic time frame for detection, only periods longer than 60 seconds were included in the analyses of detection rate and detection probability. There was no evidence that detection rates differed between T-POD deployments from the research vessel versus the mooring for any of the six distance bins (Mann–Whitney U-tests, P > 0.05), so both data sets were pooled. Multiple observations were taken from the same dolphin group if they moved between distance bins and so the data are not strictly independent. However, since the distance to the T-POD and the orientation of the group varied between trials and there was no evidence that detection rates from the same group were less variable than rates from different groups (variance ratio tests, P > 0.05), there is no reason to believe that our conclusions are biased.
The data on detection probability versus distance from the T-POD were used to estimate the effective detection radius (EDR), which is analogous to effective strip width in line–transect surveys (Buckland et al., Reference Buckland, Anderson, Burnham, Laake, Borchers and Thomas2001). Logistic regression models were fitted to the binned detection data (for both ‘All Trains’ and ‘Cet All’), and the areas under the resulting curves were determined by integration.
We used linear regression to investigate the effect of group size on click train detection rate in each of the distance bins.
RESULTS
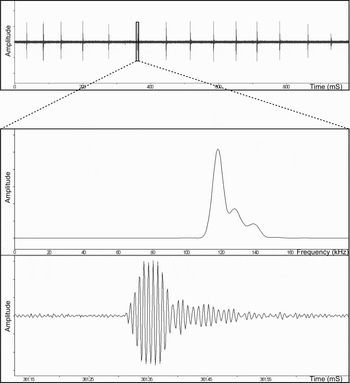
Simultaneous T-POD/theodolite trials were conducted over 15 days, totalling more than 56 hours of observations. During this time, acoustic detections were consistently made on the T-PODs when Hector's dolphins were present in Flea Bay, and no detections were made when dolphins were absent. No other cetaceans were seen in the bay during the trials. We made a total of 2 hours 13 minutes of wideband recordings on the Racal over six days. Sixteen high quality sequences were digitized, comprising more than 2000 individual clicks. The timing of click trains and inter-click intervals from the digitized wide-band recordings matched those of the T-POD detections, and the sounds detected were clearly Hector's dolphin clicks (Figure 2).
An example click train detected by the wide-band recording system, showing the spectrum and waveform of one representative click. Click characteristics match those of Hector's dolphin clicks recorded by Dawson & Thorpe (Reference Dawson and Thorpe1990).

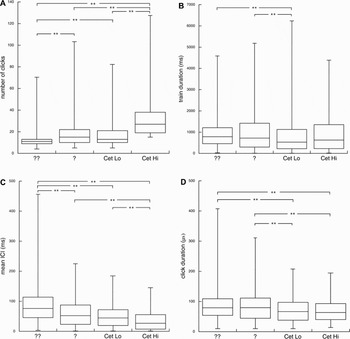
Of the 2206 click trains detected by the T-POD during the trials, 32% were classified in the top two detection classes (‘Cet Hi’ and ‘Cet Lo’)Footnote 2. There were significant differences among the train categories for all the variables tested (Kruskal–Wallis ANOVAs, P < 0.001; Figure 3). Trains classified as being of higher probability of cetacean origin tended to consist of higher numbers of shorter duration clicks, with shorter mean ICI (Figure 3). Some ‘Doubtful’ and ‘Very Doubtful’ click trains had characteristics of sounds from echo-sounders, i.e. long duration clicks with long ICI, and were closely associated with detections of boat sonar in the ‘Fixed’ category.
Box plots showing characteristics of the four different train classes as classified by T-POD.exe. Variables shown are (A) number of clicks per train, (B) click train duration, (C) mean ICI, and (D) mean click duration. Whiskers show the ranges, boxes show the quartiles and solid lines show medians. Significant differences between train classes (Dunn's test, P < 0.01) are indicated by asterisks.

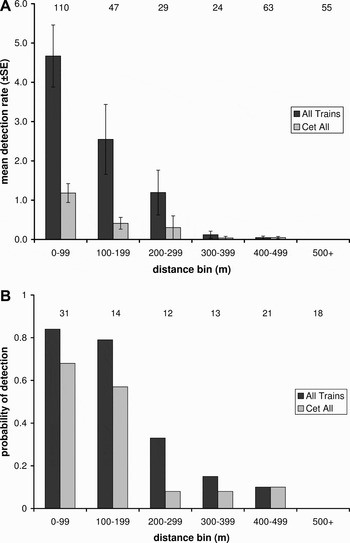
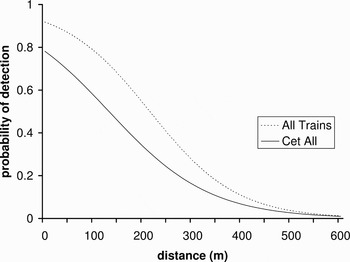
During all trials, the maximum observed distance between a Hector's dolphin group and the T-POD, which corresponded to an acoustic detection, was 431 m. As would be expected, acoustic detection rate and detection probability decreased with increasing distance from the T-POD (Figure 4). There were no acoustic detections beyond 500 m from the T-POD. Figure 5 shows the logistic regression models fitted to the detection probability data. The EDR for ‘All Trains’ was 239 m, and for ‘Cet All’ was 198 m.
Variation in (A) mean detection rate, and (B) acoustic detection probability with distance from the T-POD. Detection rate is number of click trains detected per minute. Sample sizes shown above histograms are (A) time in minutes that dolphins were in each distance bin, and (B) number of dolphin groups in each distance bin.

Detection functions fitted to the probability of detection data by logistic regression. EDR for ‘All Trains’ is 239 m, and for ‘Cet All’ is 198 m.

There was no evidence that group size had a significant effect on detection rate in any of the distance bins (linear regression, P > 0.05).
DISCUSSION
This study demonstrated the effectiveness of the T-POD for acoustic monitoring of Hector's dolphins. Detections of click trains matching the characteristics of Hector's dolphin sounds were consistently made in the presence of dolphins. Furthermore, no detections were made when dolphins were absent from the area, although close inspection revealed that a few trains classified as being of doubtful origin probably arose from boat echo-sounders. These data suggest that the top two categories assigned by the T-POD software (‘Cet Hi’ and ‘Cet Lo’) reliably represent detections of Hector's dolphins. The probability of acoustically detecting a dolphin group and the train detection rate were both high when dolphins were close to the T-POD. For example, using the ‘All Trains’ category, 84% of groups that came within 100 m of the T-POD were acoustically detected, with a mean detection rate of 4.67 trains per minute (68% and 1.18 trains per minute for ‘Cet All’). The high detection rates within the first 100 m of the T-POD quickly dropped to very low rates beyond 300 m. The estimates of EDR are useful for determining over what range the T-POD effectively detected all dolphin groups (239 m and 198 m for ‘All Trains’ and ‘Cet All’ respectivelyFootnote 3). However, the time that a dolphin group spends within range of the T-POD will also affect its probability of detection, and may explain why the detection probability is less than one, even at very close range (see Figure 5). Corrections for this ‘fraction missed’ would be required if the EDR were to be used to estimate dolphin density.
A relatively low proportion (32%) of the click trains detected during the trials were classified as ‘Cet All’, i.e. most likely to be of cetacean origin. Thomsen et al. (Reference Thomsen, van Elk, Brock and Piper2005) found a similar result in their study of captive harbour porpoises. The train detection algorithm therefore appears to be conservative and many click trains of cetacean origin are classified as being doubtful. Analysis of the characteristics of the different train categories revealed that trains classified as higher probability of cetacean origin had higher numbers of clicks with shorter ICIs and click durations. Trains with higher numbers of clicks are less likely to arise by chance, while longer duration clicks with longer ICIs are more likely to be boat sonar. Of the four categories, ‘Cet Lo’ and ‘Doubtful’ trains were the most similar, especially in terms of ICI and number of clicks. This suggests that many ‘Doubtful’ trains are likely to be dolphins and provides further evidence that the train detection process is conservative for Hector's dolphins. However, a small number of ‘Doubtful’ and ‘Very Doubtful’ detections were almost certainly boat sonar, and so blanket inclusion of either of these categories as dolphins would result in false positives. Including only ‘Cet All’ trains in analyses of dolphin presence would result in a very low rate of false positives, but many genuine detections would be discarded. While this may be acceptable in some studies, in areas of lower dolphin density, the lower probability detections should also be carefully examined and accepted as dolphins if they pass a set of predefined decision rules. A similar approach has been used in fixed acoustic surveys for rare species when all detections are critical (Mellinger et al., Reference Mellinger, Stafford, Moore, Munger and Fox2004, Reference Mellinger, Nieukirk, Matsumoto, Heimlich, Dziak, Haxel, Fowler, Meinig and Miller2007a). In such cases, we recommend publication of the decision rules, and of the rate of detection arising from the automated classification process, alongside the more inclusive assessment, so that comparability between datasets can be achieved.
The most distant acoustic detection of Hector's dolphins in this study was 431 m. This is similar to the T-POD's maximum detection distance for harbour porpoises (500 m, Tougaard et al., Reference Tougaard, Poulsen, Amundin, Laresen, Hansen, Teilman, Leeney and Tregenza2006) and finless porpoises (250–350 m, Jefferson et al., Reference Jefferson, Hung, Law, Torey and Tregenza2002), but much less than the threshold distance for bottlenose dolphins (1246 m, Philpott et al., Reference Philpott, Englund, Ingram and Rogan2007). These results make sense given that published source levels of Hector's dolphins, harbour porpoises and finless porpoises are quite similar (163 dB for Hector's dolphin, Dawson & Thorpe, Reference Dawson and Thorpe1990; 157 dB for harbour porpoise, Au et al., Reference Au, Kastelein, Rippe and Schooneman1999 (but see Villadsgaard et al., Reference Villadsgaard, Wahlberg and Tougaard2007); ~167 dB for finless porpoise, Akamatsu et al., Reference Akamatsu, Wang, Wang and Wei2001), while for bottlenose dolphins they are much greater (220 dBFootnote 4 for a dolphin echolocating on a distant target; Au, Reference Au1993).
It might be expected that the number of Hector's dolphin click trains detected would increase with group size, especially as clicks probably function in communication as well as echolocation (Dawson, Reference Dawson1991). For example, Jones & Sayigh (Reference Jones and Sayigh2002; bottlenose dolphins) and Van Parijs et al. (Reference Van Parijs, Smith and Corkeron2002; humpback dolphins) found that the number of vocalizations (whistles and echolocation clicks) increased with group size, and hence passive acoustics could be used to estimate abundance (Van Parijs et al., Reference Van Parijs, Smith and Corkeron2002). However, the relationship between vocal behaviour and group size is rarely consistent (Mellinger et al., Reference Mellinger, Stafford, Moore, Dziak and Matsumoto2007b) and in this study there was no evidence for an effect of group size. This is consistent with findings from T-POD studies with harbour porpoises (Koschinski et al., Reference Koschinski, Culik, Henriksen, Tregenza, Ellis, Jansen and Kathe2003) and bottlenose dolphins (Philpott et al., Reference Philpott, Englund, Ingram and Rogan2007). It has been shown for orca (Barrett-Lennard et al., Reference Barrett-Lennard, Ford and Heise1996) that echolocation rate per individual decreased with increasing group size, suggesting that individuals share information within a group (Barrett-Lennard et al., Reference Barrett-Lennard, Ford and Heise1996) or they interpret the echolocation signals of others (Dawson, Reference Dawson1991). This could potentially result in the number of clicks generated by a group being relatively constant and independent of the number of members.
Overall, the T-POD performed well at detecting Hector's dolphins. The maximum range for an acoustic detection was 431 m, but T-PODs can be expected to detect most dolphin groups only at close ranges. This means that individual T-PODs monitor a relatively small area (0.18 km2 assuming an EDR of 239 m for the T-POD tested here). An advantage of this is that habitat use can be measured over small spatial scales because acoustic detections can be attributed to a precise area.
In conclusion, the T-POD has great potential as a tool for monitoring habitat use by Hector's dolphins. The key advantage of this tool is that it ‘listens’ continuously, and so can monitor dolphin presence 24 hours a day. It could readily be employed in studies of distribution, habitat use and echolocation behaviour. Further trials, perhaps using several T-PODs with different settings but moored at the same location, could be used to optimize detection of Hector's dolphins.
ACKNOWLEDGEMENTS
This research was possible thanks to support from the New Zealand Whale and Dolphin Trust and Department of Conservation (NZ). Many thanks to Nick Tregenza (Chelonia Ltd) for swift service and answers to T-POD related questions. Thanks to the volunteers who gave generously of their time and expertise, notably Trudi Webster, Idil Kaplan, Anna Fox, Simone Egli, Astrid Haas and Tony Rayment. We wish to thank the Surveying Department (University of Otago) for loan of the theodolite, and Jofe Jenkins for technical support. Thanks to Al Hutt, Derek Cox and Laura Allum (Department of Conservation) for assistance with permits and to Francis and Shireen Helps for access to their land. W.R. was supported by a University of Otago postgraduate scholarship. The manuscript was improved by comments from two anonymous referees.