Introduction and Background
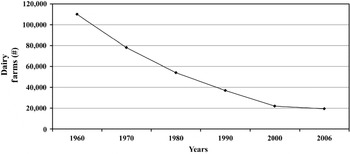
When confronted with how to best deal with growth and farm viability issues, dairy and livestock producers in northeastern US often find themselves at a fork in the road of their future. One path leads toward the creation of much larger herd sizes supported by confinement feeding systems that require large amounts of capital to establish and operate. Another well-traveled path leads many producers to exit the industry. The total number of dairy farms in the region (which includes New York, Vermont, Pennsylvania, Maryland, New Hampshire, Massachusetts, Rhode Island, Connecticut and Maine) has decreased by more than 81% since 1960 (Fig. 1). This describes the ‘get big or get out’ pressure that is well known to producers. A third, and lesser-used, path for dairy and livestock producers follows an often smaller-scale, lower-cost alternative based on the use of management-intensive grazing (MIG). Each of these paths results in very different outcomes with implications for the farm sector, rural communities, food systems and the environment. A plethora of information sources, some peer-reviewed science and others anecdotal, indicate that the expanded adoption of MIG may have very positive effects on the aforementioned sectors. Hence, the expanded adoption of MIG and the associated barriers are the focus of this paper.
Total number of dairy farms in the Northeast, 1960–2006. Source: USDA National Agriculture Statistics Service, Quick Stats, U.S. and State Data, Dairy.

There are several reasons that the adoption of MIG has received the attention of many agricultural researchers and USDA field and state office staff. The use of MIG has the potential to improve farm financial viability relative to other dairy production systems, despite lower milk production per cowReference Dartt, Lloyd, Black and Nott1–Reference Elbehri and Ford4. A reduction in variable and fixed production costs is the cause of these results.
The environmental benefits of MIG accrue primarily from having permanent vegetative cover on agricultural soils and requiring much lower applications (often none) of pesticides or chemical fertilizers. The use of MIG has been shown to reduce losses of nutrients and sediments from agricultural land, thereby reducing the negative impact of dairy production on water quality issuesReference Renfrew and Ribic5–Reference Winsten, Rotz and Ford9. The use of MIG has also been shown to reduce net greenhouse gas emissions per acre from dairy production, by using less fossil fuel and sequestering carbon in the soilReference Rotz10. Regarding wildlife habitat, researchers in Wisconsin have found that the use of MIG, relative to current agricultural land use, is advantageous for ground-dwelling birdsReference Renfrew and Ribic5, Reference Undersander, Temple, Bartlet, Sample and Paine11. While MIG's impact on herd health, the food system, farm family quality of life and rural communities is not yet thoroughly documented in the scientific literature, the popular press indicates potential benefits in these areasReference Ostrum and Jackson-Smith12–Reference Conneman, Grace, Demaine, Putnam, Richards, Staehr, Bulkley, Degni and Murray17.
The Northeast Dairy Farming Sector
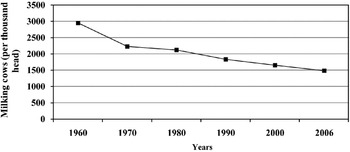
In the northeastern region, where dairy production has been the dominant source of agricultural revenues for almost 100 years, there has been a dramatic decline of 81% in the number of dairy farms since 1960 (Fig. 1). The current national trend is consolidation into fewer but larger farms and the result of this trend can be observed in the Northeast. The number of milking cows in the region has decreased by 49% from approximately 2,948,000 in 1960 to 1,480,100 in 2006 (Fig. 2). While the number of milking cows and dairy farms has steadily declined across the region, the average number of milking cows per farm has increased by nearly 50% indicating consolidation into fewer, larger farmsReference Blayney18. Additionally, milk production per cow has nearly doubled over this period19.
Total number of milking cows in the Northeast, 1960–2006. Source: USDA National Agriculture Statistics Service, Milk Cows and Production.

Survey and Methods
Surveys were mailed to over 4000 dairy farmers in four northeastern states (Vermont, New York, Pennsylvania and Maryland) during spring 2007. These four states were selected, because they represent various climatic and soil conditions present within the region and because this study did not have the resources to survey farmers in all states. The mail survey was administered following the Dillman methodReference Dillman20. Due to the small number of dairy farms in both Vermont and Maryland, all dairy farms in those states were included in the sample. For New York and Pennsylvania, states with sizeable dairy farm populations, dairy farms were selected at random to be included in the sample. The mailing lists of dairy farms in Vermont were provided by the Department of Community Development and Applied Economics at the University of Vermont; for Pennsylvania, by the Bureau of Animal Health and Diagnostic Services for the Pennsylvania Department of Agriculture; for New York, by the New York State Department of Agriculture and Markets and for Maryland, by the Division of Milk Control in the state Department of Health and Mental Hygiene.
The initial mailing took place in March 2007. A reminder postcard followed 3 weeks later. Farms that did not respond to the initial mailing were sent a second survey in April 2007, 6 weeks after the original mailing. The number of usable surveys returned was 987. This includes 365 from Vermont, 252 from New York, 237 from Pennsylvania and 133 from Maryland. This resulted in a response rate of 24.5%. The length of the survey (six pages of questions) and the proximity of the survey to the beginning of the spring cropping season may have hampered the response rate.
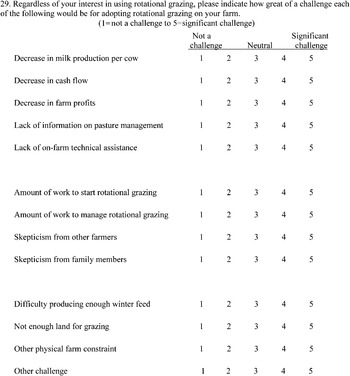
The respondents were asked to answer the questions for their farm as it was during the year 2006. The survey included questions on herd size, milk production, land use, farmer characteristics, technologies and management practices, satisfaction levels with aspects of the operation, concerns for long-term survival of the farm, plans for the future of their farm, as well as feeding and grazing practices. A series of questions in the survey asked dairy farmers to indicate how great of a challenge each of the 11 factors (plus two ‘other’ categories) would be for adopting MIG on their farm. The structure of the survey guided respondents to separate sections based on whether or not they were using grazing for their milking herd in 2006. The questions from the survey, as they were posed to non-graziers, are reproduced and shown in Figure 3.
The Northeast Dairy Farm Practices Survey question for farmers not grazing in 2006.

This information was solicited from all respondents, albeit in different ways. Farmers that were grazing their milking herd in 2006 answered the questions shown in Fig. 3 in two parts. The first part asked, ‘Prior to adopting grazing, what did you expect the challenges would be?’ The second part asked, ‘What did you find the challenges to grazing actually were?’ This provided some insight into the difference between perceived and actual challenges to the adoption of MIG from those who underwent the transition on their farms. Farmers who were not using pasture as a source of forage for their milking herd in 2006 were asked about the challenges they perceived regarding the adoption of grazing.
The analysis presented in this paper is based on the survey results. Each farm has been categorized into one of the three groups reflecting three distinct types of dairy production systems common in the Northeast and relevant to this analysis. These include farms using MIG (N=134), confinement feeding (CONF) (N=396) and traditional (TRAD) (N=459) systems. On farms using MIG, the milking herd gets a fresh paddock every 12 or 24 h and cows receive the majority of their forage intake from pasture when adequate pasture forage is available. On farms using CONF, the milking herd does not graze at all. On farms using TRAD systems, the milking herd does graze, but in a less intensive manner than MIG. Respondents who did not answer the questions necessary for being categorized into a production system (N=37) were deleted from the sample.
The results presented in this paper were developed with one of several basic statistical analyses most appropriate for the specific questions being asked. The Chi-square test (χ2) was used to determine if significant relationships exist among a set of categorical variables, particularly whether farm and farmer characteristics differed according to the type of production system used. The Kruskal–Wallis test, a non-parametric analysis of variance, was used to determine differences in the way farmers using the three production systems viewed the barriers to the adoption of grazing. The non-parametric Wilcoxon Signed Rank test (Z) was used to determine if significant differences exist in farmers’ perceptions of the barriers to adoption of rotational grazing before versus after adoption. The non-parametric Spearman correlation analysis was used to determine if certain factors such as milk production per cow and debt level determine how farmers view the barriers to adoption of rotational grazing. Logistic regression analyses were used to determine the influence of farm and farmer characteristics, including production system used, on farmers’ perceptions of each of the 11 barriers analyzed.
Results and Discussion
The statistical analyses reported in this paper were performed using the SPSS statistical software (SPSS Inc., Chicago, Illinois, USA). An alpha level of 0.05 was the criterion for statistical significance for all tests. All results discussed in this paper were found to be statistically significant. The sections below expand upon the survey results, including farmers’ perceptions of the implementation and use of MIG on their farms.
General survey results
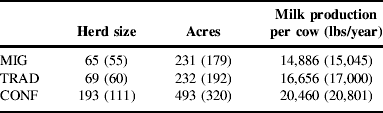
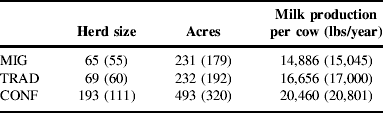
CONF farms tended to have larger milking herds and farmed more acres than either TRAD or MIG farms (Table 1). CONF farms also had higher milk production per cow than the other farms. This may be due to the reduced energy expended by cows in confinement, the ability of producers to precisely balance supplemental nutrients in the feed ration relative to farms using pasture forage, and producer goals and preferences.
Mean (and median) herd size, acres and milk per cow by production system.
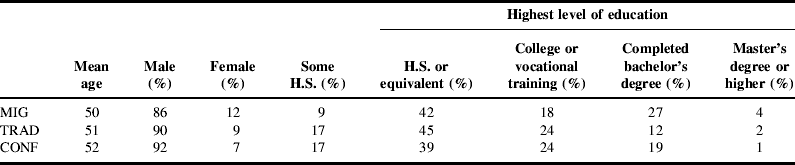
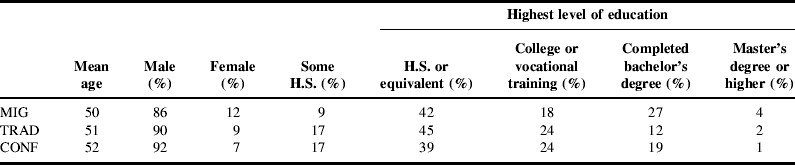
Differences in farmer characteristics were also noted among these three production systems (Table 2). Farmers using MIG were more likely to have completed a bachelor's degree or beyond. Farmers using CONF (followed by TRAD and MIG) were more likely to list their primary source of farm management information as their veterinarian (25, 18 and 18%), feed sales representative (19, 15 and 11%) and consultants (17, 9 and 6%). They were less likely to seek information from their state extension service (6, 8 and 11%), other farmers (8, 17 and 15%), or publications (17, 25 and 24%). Although still not one of the top sources of information, it is interesting to note that a higher percentage of farmers using MIG received information from their University Extension System (11%).
Characteristics of the farm's primary decision maker by the production system.
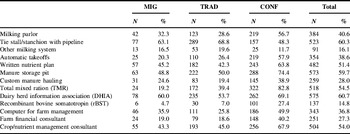
A vast majority of CONF farms used a total mixed ration compared to TRAD and MIG farms (Table 3). CONF farms were also using recombinant bovine somatotropin (rBST) more than TRAD and MIG farms. They were also more likely to have a milking parlor, a manure storage lagoon, a written nutrient management plan and hire custom manure spreading services. A greater percentage of confinement feeding farms (27%) report having high or very high debt levels (defined as having debt that is >40% of total farm assets), relative to TRAD (16%) or MIG farms (15%).
Use of technologies and management practices for which significant (P<0.05) differences exist across farm types.

Nearly 25% of the farms using MIG were selling certified organic milk in 2006. MIG farms were also much more likely to be in the transition to organic certification, or considering it (26%), compared to TRAD (15%) and CONF (3%). These findings make sense given that the standards for organic certification require at least a minimum level of pasture forage intake. A much greater percentage of MIG farms (42%) had a seasonal calving pattern in their herd compared to TRAD (21%) or CONF (7%). The MIG farms with seasonal calving patterns tended to have spring calving herds (52%) and the primary reason given for this was to maximize pasture forage intake (87%).
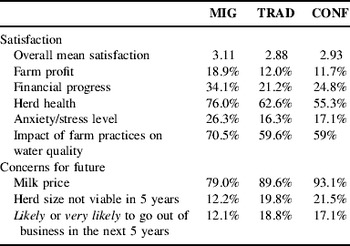
As a group, farmers using MIG reported higher mean satisfaction scores across various aspects of their farming operation, with an overall satisfaction score of 3.11 (where 1=very dissatisfied and 5=very satisfied) (Table 4). Farmers using TRAD and CONF systems reported the overall mean satisfaction scores of 2.88 and 2.93, respectively. A higher percentage of MIG farmers, relative to TRAD or CONF farmers, reported being satisfied or very satisfied with their farm's profit level (18.9, 12.0 and 11.7%), financial progress over the past 5 years (34.1, 21.2 and 24.8%), herd health (76.0, 62.6 and 55.3%), anxiety and stress levels (26.3, 16.3 and 17.1%) and impact of farm on water quality (70.5, 59.6 and 59.0%). Although it is a concern for the vast majority of farmers, a smaller percentage of farmers using MIG reported moderate or significant concern for the future of their farm regarding farm-gate milk prices (79.0, 89.6 and 93.1%). A smaller percentage of farmers using MIG reported moderate or significant concern about the viability of their current herd size over the next 5 years (12.2, 19.8 and 21.5%) and with less frequency reported likely or very likely to exit the dairy industry during the next 5 years (12.1, 18.8 and 17.1%). In summary, the survey data paint a picture of farmers who are using MIG considering their farms to be in a stronger position for the future with greater frequency, relative to farmers using TRAD or CONF systems.
Farmer satisfaction and concerns for future. Percent of survey respondents satisfied or very satisfied (where 1=very dissatisfied, 4=satisfied and 5=very satisfied) and somewhat or significantly concerned (where 1=not a concern, 4=a concern and 5=a significant concern) with various aspects of their farming operation by the production system.

*Statistically significant differences (P<0.05) exist among production systems for each item.
Barriers to adoption of MIG
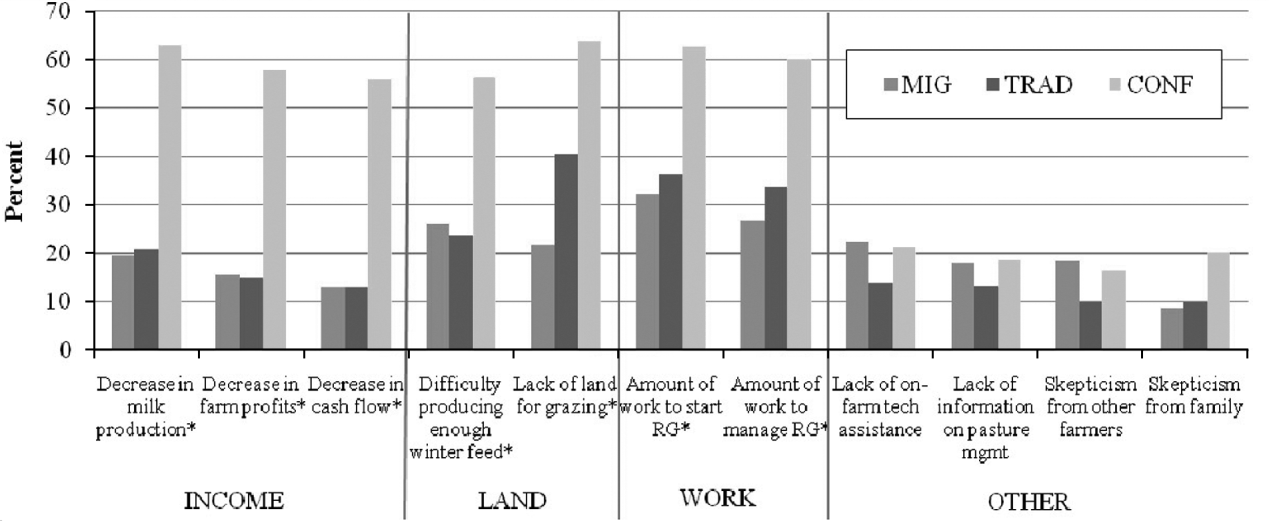
Figure 4 shows the frequency with which farmers in each of the three production systems indicated that each of 11 factors was a moderate or significant challenge for the adoption of MIG on their farm. As shown, the factors related to income, land and labor were more frequently seen as barriers for farmers of CONF production systems than were factors related to information, technical assistance or skepticism from other farmers or family. In the field, the authors often hear the need for more technical assistance discussed as the prominent issue hindering the expanded adoption of MIG. What these results indicate is that while information and technical assistance to farmers are probably necessary for expanded adoption of MIG, supplying these items alone may not be sufficient. This section discusses the results of in-depth analysis related to the barriers to adoption.
Percentage of farmers indicating that each factor is a moderate or significant challenge to the adoption of MIG on their farm, by production system. RG, Rotational grazing. *Indicates statistically significant difference of P<0.05.
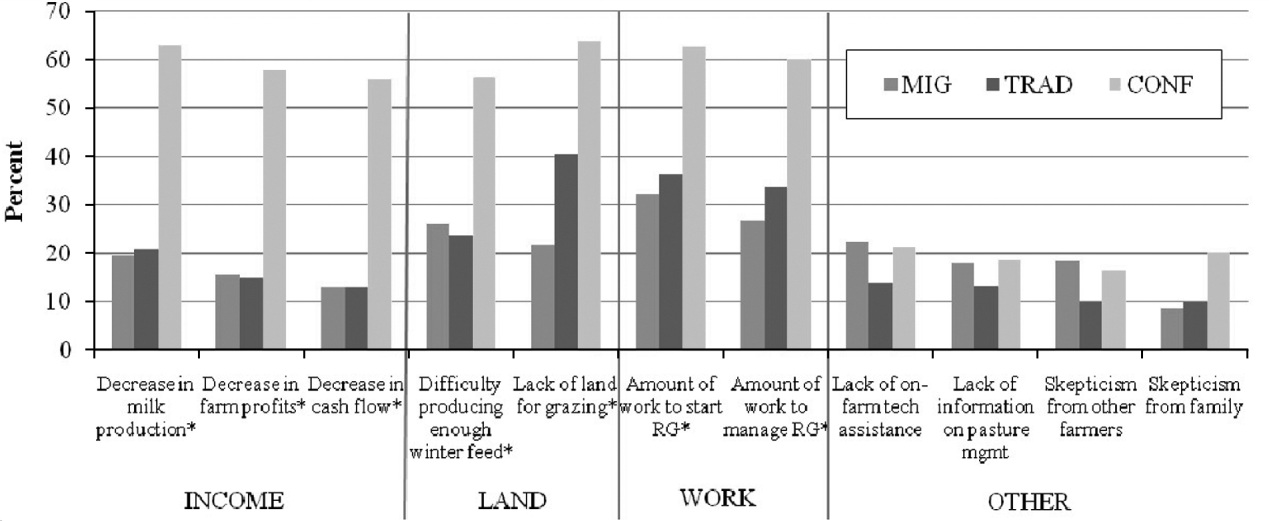
Farmers using CONF view many of the barriers as a more significant obstacle, with greater frequency, relative to farmers using MIG or TRAD systems (Fig. 4). The barriers for which this was most often the case were those related to farm financial performance. These include the barriers decrease in milk production, decrease in cash flow and decrease in farm profits. This is probably due to a combination of real and perceived outcomes. As discussed above, cows in MIG systems (and to a lesser extent TRAD) systems generally produce less milk than cows in CONF systems; hence, lower milk production is a real concern for farmers of CONF operations. Lower milk production per cow can translate into reduced cash flow if expenses are not reduced by an equal or greater percentage. However, numerous studies have shown that profit per cow and per unit milk production is often higher on farms using MIGReference Dartt, Lloyd, Black and Nott1–Reference Elbehri and Ford4, Reference Conneman, Grace, Demaine, Putnam, Richards, Staehr, Bulkley, Degni and Murray17, Reference Kriegl, Bauman and Splett21. It seems that the assumption that lower milk production per cow leads to reduced cash flow and farm profits seems to be prevalent among farmers using CONF production systems.
While CONF farmers’ consistently perceived financial, labor and land issues as greater barriers than did MIG or TRAD farmers, a few significant differences existed between MIG and TRAD farmers with regard to how they perceived barriers to adoption. The Kruskal–Wallis test revealed that the only statistically significant difference between MIG and TRAD farmers related to the barrier lack of land for grazing (χ2=46.446, P=0.001). Farmers using MIG systems saw this as a barrier less frequently than did farmers using TRAD systems. This result may have two causes. First, given that the stocking rate, measured as milking cows per acre of crop and pasture land, on MIG farms (0.52) was not statistically different from that on TRAD farms (0.47) (Table 1), this suggests that MIG farms are making more productive use of their pastures. Second, this result may also be due to the unwillingness of farmers in the TRAD group to use tillable cropland for pasture, as is done on many MIG farms.
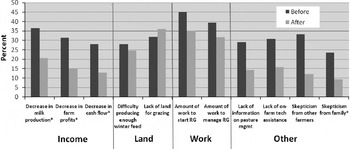
The Wilcoxon Signed Rank Test revealed that, for farmers using MIG, many of the barriers to adoption that they expected to encounter prior to adopting MIG were actually less of a challenge than they had anticipated after adoption (Fig. 5). This includes the variables decrease in milk production (Z=−1.980, P=0.048), decrease in cash flow (Z=−3.056, P=0.002) and decrease in farm profits (Z=−3.427, P=0.001), as well as skepticism from family members (Z=−2.675, P=0.007). Because the perceived barriers for MIG and TRAD farmers were roughly equivalent and the actual barriers encountered by MIG farmers after adoption were far less than expected, these results can be extrapolated to imply that the actual barriers to adoption for TRAD farmers should also be less than perceived barriers.
Perceived barriers (i.e. before adoption) and actual barriers (i.e. after adoption) to the adoption of MIG for farmers using rotational grazing. RG, Rotational grazing. *Indicates statistically significant difference of P<0.05.

It was hypothesized that positive relationships exist between how farmers view the significance of certain barriers to adoption of MIG and the farm's level of debt and milk production per cow. A Spearman correlation analysis of this dataset revealed that this was the case for some of the barriers. For example, farmers with a greater debt-to-asset ratio are more likely to view the variable decrease in cash flow as a significant barrier to the adoption of MIG [r (461)=0.125, P=0.007]. The reason for this result may be that farms with higher debt per cow may feel the need to maximize milk production per cow in order to keep up with monthly debt service payments. Farmers may view any change that results in lower milk production per cow as a threat to cash flow and, by extension, farm profits.
For respondents with greater milk production per cow, often farmers using CONF systems, the correlation analysis revealed that there is a strong relationship between milk production and perceived barriers. The barriers of decrease in milk production [r (344)=0.276, P=0.001], decrease in cash flow [r (342)=0.175, P=0.001] and decrease in farm profits [r (343)=0.204, P=0.001] were widely viewed as greater obstacles by CONF farmers with higher milk production per cow. This result was not observed for farmers using MIG. This, in combination with many studies that show MIG to be as, or more, profitable than other production systemsReference Dartt, Lloyd, Black and Nott1–Reference Elbehri and Ford4, may help accentuate the important point that higher milk production per cow does not necessarily translate into higher farm profits.
Determinants of real and perceived barriers to adoption
Regression analyses were performed to determine which factors had the greatest influence on farmers’ perceptions of each of the 11 barriers presented. For this analysis, 11 individual logistic regressions were run, one for each barrier presented in the survey. The logistic regression method of analysis was chosen for two important reasons. First, the current analysis is most interested in identifying whether or not each factor was perceived as a challenge. Second, the logistic regression method simplified the interpretation of the resulting coefficients in each model. For this analysis, the five ordinal categories of the dependent variables were recoded as binary categories. Not a challenge (1), minimal challenge (2) and neutral (3) categories were condensed and recoded as not a challenge (0). Somewhat significant challenge (4) and significant challenge (5) were condensed and recoded as challenge (1). The explanatory (right-hand side) variables used to explore and explain the impact of each barrier were the same across all regression models. These variables included the state the farm was located in, herd size, milk production per cow (per 10,000 lbs), stocking density (cows per acre), an index of farmer satisfaction with their farming operation, farmer age, farm debt level (as a percentage of total farm assets) and the production system employed (CONF, MIG or TRAD).
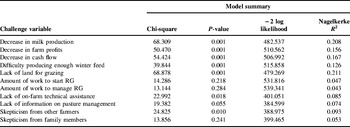
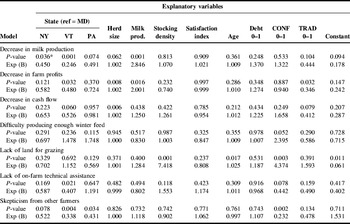
Seven of the 11 regression models were significant. These included the models explaining decrease in milk production, decrease in farm profits, decrease in cash flow, lack of on-farm technical assistance, skepticism from other farmers, difficulty producing winter feed and not enough land for grazing (Table 5). However, the significant explanatory variables differed across the models (Table 6).
Summary results from logistic regression models to determine which factors had the greatest influence on each of the 11 barriers to the adoption of rotational grazing (RG).

Logistic regression results for statistically significant models.

Regarding the barriers related to farm income and profitability, only a handful of factors were statistically significant at the 95% confidence level. For the barrier decrease in milk production, farmers in New York and Vermont saw this as less of a barrier than did farmers in Pennsylvania or Maryland. As expected, farmers with higher milk production per cow perceived this barrier to be more significant than did farmers with lower milk production per cow. For the barrier decrease in cash flow, the only significant variable was herd size. This implies that farmers with larger herd sizes saw the impact of adopting MIG on cash flow to be a greater challenge than did farmers with smaller herd sizes. Although decreased milk production per cow is a likely outcome of adopting MIG, the impact on cash flow and farm profitability could be either positive or negative. Decreased cash flow and profitability were included as barriers in the survey because many farmers identify these as barriers to the adoption of MIG. For the barrier decrease in farm profits, the significant variables were herd size and milk production per cow. Farmers in Vermont and farmers using TRAD systems saw a decrease in farm profits as less of a barrier.
None of the variables in the model for the barrier difficulty producing enough winter feed were significant. However, for the barrier not enough land for grazing there were several significant variables. As expected, farms with higher stocking densities were more likely to recognize not enough land for grazing as a barrier to the adoption of MIG. Additionally, older farmers and farmers using CONF systems saw this as a greater barrier.
The only significant variable in the model analyzing the barrier lack of on-farm technical assistance was that farmers in Vermont saw this as less of a barrier than did farmers in the other three states. This is likely to be a result of the past and current work from a small, dedicated group of faculty and staff at the University of Vermont. Dr Bill Murphy and his staff provided information and on-farm technical assistance to scores of farmers during the 1980s and 1990s. This work is currently carried forward by UVM's Center for Sustainable Agriculture.
Farmers in Vermont and Pennsylvania viewed skepticism from other farmers as less of a barrier to the adoption of MIG than did farmers in New York or Maryland. Farmers using CONF also viewed skepticism from other farmers as less of a challenge than did other farmers (Table 5).
Summary and Conclusions
MIG systems, if more widely adopted in the Northeast, have the potential to provide many public and private benefits. Understandably, farmers are hesitant to make radical changes to their existing management systems because change can be a source of risk. For this reason, publicly supported programs may be necessary to assist farmers who want to evaluate and consider adopting MIG, just as support programs are available to other types of farming operations.
Although only a small percentage of dairy farmers in the Northeast currently practice MIG, significant increases in the adoption of MIG could be quickly realized with the creation of incentive programs that help farmers overcome barriers to adoption. It is essential that such programs be appropriately designed to address the most significant barriers (both real and perceived) that farmers face. Although additional information and technical assistance for farmers are essential for an expanded adoption of MIG, the results presented in this paper show that programs to help farmers overcome the barriers related to income, land and labor are also essential to achieve wider adoption.
If our society deems it worthy to encourage a larger percentage of farmers to consider adopting MIG, there are numerous policy options that could be explored that would address the income, land and labor barriers. These options include, but are not limited to, the following ideas:
• The creation of programs to restructure farm debt would allow farmers with high debt per cow to consider transitioning to MIG. Farms with high debt per cow often feel that it is essential to have maximum milk production per cow. Because MIG often results in lower per cow milk production, many farmers feel that MIG is not a viable option for their farm.
• Debt-for-carbon swaps, where farmers provide quantifiable carbon sequestration credits from the use of MIG in exchange for debt reduction. Additional types of ‘green payments’ programs can be considered based on water quality and other environmental quality improvements resulting from the use of MIG.
• Revenue assurance during the transition to MIG, based on documented farm financial performance over recent years. This would provide farmers with a guarantee that their net farm income will not decrease during the transition period to MIG and would greatly reduce the perceived risks associated with this transition.
• Visas for persons with demonstrated skills and experience with MIG to work legally in the US Skilled graziers from countries like New Zealand, Ireland, Argentina and South Africa would help their US employers make the transition to MIG and help to alleviate the labor constraints associated with this transition.
In addition to their direct impact, the programs listed above would also signal to the farming community that MIG is a viable production system and one that society deems desirable. The results presented in this paper may be used to provide this important information to policy-makers.
Acknowledgements
Winrock International conducted this research in conjunction with the University of Vermont. The National Research Initiative of the USDA National Institute of Food and Agriculture supported this project under grant number 2006-55618-17016. The authors wish to express their gratitude to the many farmers who took the time to provide valuable information by completing the survey.