


Introduction
Seed germination is a crucial step in the life cycle of plants, as its timing determines the environmental conditions experienced during subsequent stages of the plant's life, i.e. seedling establishment, vegetative growth, flowering time and seed production (Donohue, Reference Donohue2009). Therefore, it is important that seeds do not germinate at inappropriate times and potentially compromise survival or reproductive ability of a species. During seed development and maturation, light quality and photoperiod, along with temperature and moisture conditions, can play an important role in determining the level of seed dormancy at maturity (Donohue et al., Reference Donohue, Heschel, Butler, Barua, Sharrock, Whitelam and Chiang2008). In mature imbibed seeds, these parameters inform the seed whether or not conditions are suitable for germination (Benech-Arnold et al., Reference Benech-Arnold, Sánchez, Forcella, Kruk and Ghersa2000). The importance of phytochromes, the red/far-red-light receptors, in mediating and subtly influencing seed germination is illustrated by the vast literature on this topic (reviewed in Casal and Sánchez, Reference Casal and Sánchez1998; more recent examples include Appenroth et al., Reference Appenroth, Lenk, Goldau and Sharma2006; Heschel et al., Reference Heschel, Selby, Butler, Whitelam, Sharrock and Donohue2007; Seo et al., Reference Seo, Nambara, Choi and Yamaguchi2009). There has been much less attention paid to the response of seeds to the shorter wavelengths of the visible spectrum, although there is some evidence that they can perceive blue and green light. Little work has been done to identify the photoreceptor(s) mediating the responses to these wavelengths. In this review, the varying effects of blue and green light on seed dormancy/germination and metabolism are collated from studies performed over the past 40 years and put into the context of current detailed knowledge about the light-perception mechanisms of the major plant photoreceptors.
Properties of blue- and green-light-perceiving plant photoreceptors
Phytochrome, the first photoreceptor identified in plants, is very well characterized in terms of its molecular structure and mode of action. Its chromophore is phytochromobilin, a linear tetrapyrrole that photoconverts between inactive, red-light-absorbing (Pr; peak absorbance at 660 nm) and active, far-red-light-absorbing (Pfr; peak at 730 nm) forms (Elich et al., Reference Elich, McDonagh, Palma and Lagarias1989). The proportion of Pfr in the cellular pool is denoted as Pfr/P. Phytochrome A (phyA), the sole type I phytochrome and present in all higher plants, is light-labile (but abundant in etiolated tissue) and highly sensitive to low fluences of light from across the visible spectrum (Shinomura et al., Reference Shinomura, Nagatani, Hanzawa, Kubota, Watanabe and Furuya1996). PhyA is responsible for the response to extremely low fluences or very brief flashes of light, known as the very low fluence response (VLFR), which is exemplified by the stimulation of germination in buried Datura ferox seeds upon soil tillage (Scopel et al., Reference Scopel, Ballaré and Sánchez1991). Long-term exposure to far-red light, or to low-intensity blue or green light (i.e. conditions inducing a low Pfr/P), results in the continuous cycling between the Pfr and Pr forms of phyA, which is known as the high-irradiance response (HIR) and is responsible for inhibition of seed germination in certain species (Casal and Sánchez, Reference Casal and Sánchez1998). PhyA is active under dim blue light in responses such as entrainment of the circadian clock, flowering time and de-etiolation (Franklin and Quail, Reference Franklin and Quail2010). An early action spectrum of phytochrome purified from etiolated oat seedlings (and therefore presumably consisting predominantly of phyA) showed that absorption of blue light by phytochrome is stronger than of green (Butler et al., Reference Butler, Hendricks and Siegelman1964).
Cryptochromes, along with phototropins, are the blue/ultraviolet-A (UV-A) receptors (Ahmad and Cashmore, Reference Ahmad and Cashmore1993) and carry out many of the same functions in photomorphogenesis and circadian clock regulation as the phytochromes (e.g. Sullivan and Deng, Reference Sullivan and Deng2003). Less is known about cryptochrome action in seeds, and there have been no studies specifically demonstrating the presence of the cryptochrome protein in seed tissues. In its ground state, the chromophore of cryptochrome is oxidized flavin adenine dinucleotide (FAD), which, when exposed to blue light (peak absorbance at 450 nm), becomes partially reduced to the stable semiquinone radical which is the active state of the chromophore; upon subsequent absorption of green light (530–580 nm), the semiquinone is fully reduced and inactivated (Bouly et al., Reference Bouly, Schleicher, Dionisio-Sese, Vandenbussche, Van Der Straeten, Bakrim, Meier, Batschauer, Galland, Bittl and Ahmad2007). In the dark, the reduced or partially reduced FAD is re-oxidized back to its ground state, ready to be activated by blue light once more (Banerjee et al., Reference Banerjee, Schleicher, Meier, Viana, Pokorny, Ahmad, Bittl and Batschauer2007). A folate group is bound to the surface of the cryptochrome protein and harvests UV light (peak absorbance at 380 nm), transferring this excitation energy to the FAD chromophore to increase the wavelength sensitivity of cryptochrome (Hoang et al., Reference Hoang, Bouly and Ahmad2008). Cryptochrome 1 (cry1) is stable in the light, whereas cryptochrome 2 (cry2) is light-labile and (like phyA) is dominant in low-light conditions, enhancing the sensitivity of plants to low-fluence blue light (Lin et al., Reference Lin, Yang, Guo, Mockler, Chen and Cashmore1998). An important difference between the responses of phyA and cry2 is that although far-red light on its own can elicit phyA responses, cry2 is not affected by green light without prior or simultaneous exposure to blue light (Banerjee et al., Reference Banerjee, Schleicher, Meier, Viana, Pokorny, Ahmad, Bittl and Batschauer2007).
Phototropins are predominantly involved in maximizing photosynthetic efficiency by mediating phototropism, stomatal opening and chloroplast movement (Christie, Reference Christie2007), but they also play a role in heliotropism and nuclear positioning (Inoue et al., Reference Inoue, Takemiya and Shimazaki2010). The flavin mononucleotide (FMN) chromophore absorbs blue (peak absorbance at 450 nm with shoulders at 420 and 470 nm) and UV-A (a broad peak around 365 nm) light, which causes a change in protein conformation and activates the phototropin molecule (Briggs and Christie, Reference Briggs and Christie2002; Inoue et al., Reference Inoue, Takemiya and Shimazaki2010). In the dark, the activated phototropin slowly reverts to its ground state (Christie, Reference Christie2007). Phototropin 1 is active at low light intensities, while phototropin 2 only responds to light of relatively high fluence rate (e.g. 20 μmol m− 2 s− 1) (Cho et al., Reference Cho, Tseng, Kaiserli, Sullivan, Christie and Briggs2007). There is no evidence that phototropins respond to green light in either their ground or activated states.
Light perception in seeds
It is unlikely that mature dry seeds are able to perceive light in the same way as when hydrated. Studies on phytochrome action have shown that dry seeds can perceive far-red light via existing Pfr but that full conversion between Pfr and Pr is not possible due to the requirement for a change in protein conformation; thus, red light is (inefficiently) perceived in dry seeds by a complex of phytochrome intermediates (Bartley and Frankland, Reference Bartley and Frankland1984, and references therein). Similarly, photoconversion of phytochrome from its Pr to Pfr form is inhibited in dehydrated plant tissues, and there is evidence that phyA in highly dehydrated tissues (such as mature seeds) is converted to a more hydrophobic and stable form than that present in hydrated tissues (Sineshchekov, Reference Sineshchekov2006). There have been no studies on the action of cryptochrome or phototropin in dry seeds or other dehydrated tissues, but it is likely that these photoreceptors are also unable to function in the absence of free water.
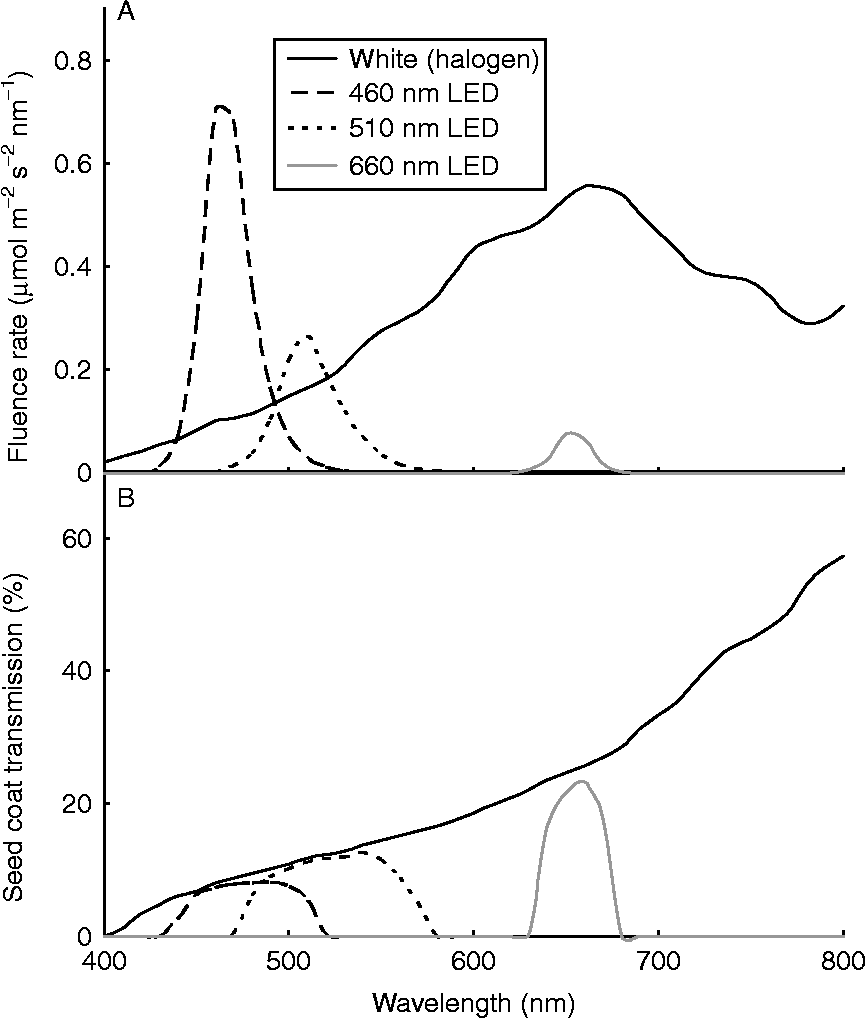
The quality of light reaching the photoreceptors in developing or mature imbibed seeds depends upon the presence and type of light-filtering pigments (e.g. anthocyanins, condensed tannins, carotenoids, chlorophyll) in the seed coat (Hendricks et al., Reference Hendricks, Toole and Borthwick1968). For example, the yellow-brown seed coat of Lolium rigidum seeds cuts the transmission of white light by around 80%, but is more effective at filtering blue and green wavelengths than red and far-red light (Fig. 1). The extent of seed shading by a leaf canopy also affects the quality of light reaching the seed, as canopy light is enriched in the green and far-red wavelengths of sunlight. Even very subtle changes in light quality can inform the seed about current environmental conditions and their suitability for supporting germination and early seedling growth (Batlla et al., Reference Batlla, Kruk and Benech-Arnold2000).
Light transmission through the Lolium rigidum seed coat. The irradiance spectra of various light sources (white halogen globes or LEDs with peak wavelengths of 460, 510 or 660 nm) were measured at a distance of 52 cm (halogen) or 16 cm (LED) in the absence (A) or presence (B) of excised seed coats, using a StellarNet EPP2000-VIS spectrometer with irradiance calibration (Warsash Scientific, Sydney, New South Wales, Australia). Coats from approximately 100 imbibed seeds were excised, any adhering endosperm was removed with a scalpel blade, and the moist coats were then pressed flat in a single layer between two thin sheets of transparent plastic, covering an area of approximately 20 cm2. Irradiance measurements of each light source filtered through the seed coats were averaged from ten different points on the seed coat array, and the percent transmission at each wavelength (B) was calculated based on the data in (A). The transmission across the full spectrum for each light source was: white, 20%; 460 nm, 7%; 510 nm, 11%; 660 nm, 20%.
Many studies on the response of seeds to light are performed with the sole aim of finding the conditions required to break dormancy and/or stimulate germination, rather than identifying the photoreceptor(s) involved, and thus broad-waveband light sources (i.e. white light filtered through cellophane or acetate filters, often at low fluence rates) are used. This, along with the lack of photoreceptor mutants available in most of the species exhibiting dormancy, makes it difficult to unequivocally determine which photoreceptors may have been involved in these responses, as discussed in the following sections.
Seed responses to blue and green light that are potentially mediated by phytochrome
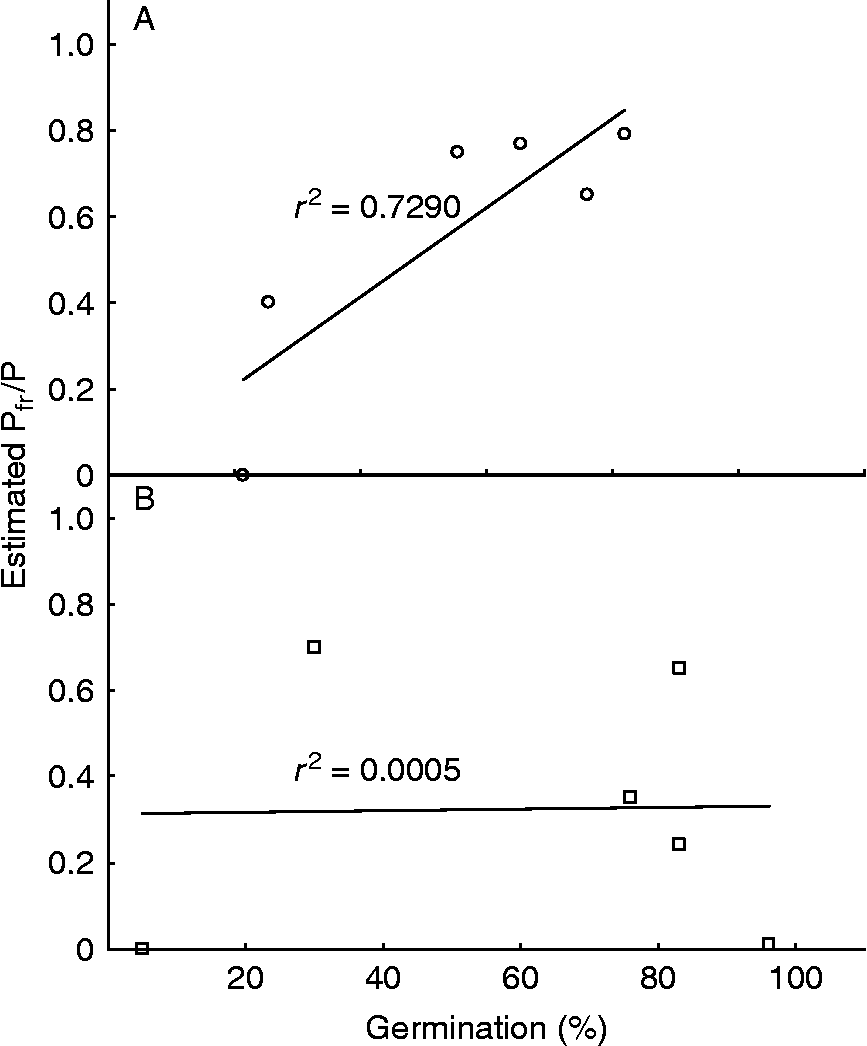
Light quality has differing effects on germination. For example, germination can be stimulated by blue light (e.g. Acacia catechu, Agrawal and Prakash, Reference Agrawal and Prakash1978; Amaranthus spp., Singhal et al., Reference Singhal, Sen and Bhandari1983), green light (e.g. Aeschynomene indica and Tephrosia purpurea, Chaghtai et al., Reference Chaghtai, Khan and Sultan1983; Solidago spp., Walck et al., Reference Walck, Baskin and Baskin2000; Atriplex sagittata, Mandák and Pyšek, Reference Mandák and Pyšek2001; Compositae, Luna et al., Reference Luna, Pérez, Fernández-González and Moreno2004), yellow light (e.g. Mikania micrantha, Yang et al., Reference Yang, Ye, Deng, Cao, Zhang and Xu2005), or both red and blue light (e.g. Butea monosperma, Agrawal and Prakash, Reference Agrawal and Prakash1978). Conversely, germination can be inhibited by blue light (e.g. Amaranthus caudatus, Nowak et al., Reference Nowak, Rudnicki and Grzesik1996), green light (e.g. Chondrilla juncea, Luna et al., Reference Luna, Pérez, Fernández-González and Moreno2004), or both blue and far-red light (e.g. Solanum tuberosum, Listowski and Rykaczewska, Reference Listowski and Rykaczewska1975; Citrullus lanatus, Thanos and Mitrakos, Reference Thanos and Mitrakos1992). In Cyrtopodium glutiniferum seeds, germination is most rapid under white or blue light, but reached a higher final percentage under green light (Vogel and Macedo, Reference Vogel and Macedo2011). Although not specifically related to germination, expression of transcription factors regulating anthocyanin biosynthesis in Zea mays aleurone layers was stimulated by white and red and, to a lesser extent, blue light (Piazza et al., Reference Piazza, Procissi, Jenkins and Tonelli2002). In many of these cases, the seed responses to relatively dim blue, green and far-red light are likely to be mediated by phyA, which can perceive light from across the visible spectrum. Examination of the data presented in Dissanayake et al. (Reference Dissanayake, George and Gupta2010) neatly demonstrates that as the deduced Pfr/P of seed phytochrome progressively decreases across the spectrum from red, through yellow and green, to blue light, the germination percentage of Parthenium argentatum seeds similarly decreases, illustrating the dependence of these particular seeds on Pfr for germination (Fig. 2A).
Correlation between final germination percentage and the estimated Pfr/P of the seed phytochrome pool in (A) Parthenium argentatum and (B) Myriophyllum spicatum germinated under different light qualities, as described in Dissanayake et al. (Reference Dissanayake, George and Gupta2010) and Coble and Vance (Reference Coble and Vance1987). Germination data were taken from Fig. 1 in Dissanayake et al. (Reference Dissanayake, George and Gupta2010) (A) and Fig. 1 in Coble and Vance (Reference Coble and Vance1987) (B). To estimate Pfr/P, the values of Pfr/P at photoequilibrium (ϕ) from Table 3 in Mancinelli (Reference Mancinelli1988) were used, as the seeds in both studies were exposed to saturating light treatments ( ≥ 8 h d− 1). As broad-waveband light sources were used in both studies, the average value of ϕ over the appropriate range of wavelengths was calculated, using the absorption spectra of the coloured filters in Fig. 2 of Dissanayake et al. (Reference Dissanayake, George and Gupta2010) as a guide to bandwidth.
Cryptochrome in seeds
Use of photoreceptor mutants has confirmed that cry1 is not required for the red/far-red-reversible stimulation of germination in Arabidopsis (Hennig et al., Reference Hennig, Stoddart, Dieterle, Whitelam and Schäfer2002), and that phytochrome action is also dominant under white light (Poppe et al., Reference Poppe, Sweere, Drumm-Herrel and Schäfer1998). However, cry1 contributes to germination under relatively high-fluence (>5 μmol m− 2 s− 1) blue and UV light, and apparently can also reverse the stimulatory effects of phyB when high-fluence blue light is applied after a red-light treatment (Poppe et al., Reference Poppe, Sweere, Drumm-Herrel and Schäfer1998). A genetic study on the Arabidopsis cry2 gene, in which the effects of different alleles were compared, found that although cry2 has an influence on ovule number and fertility and on silique length, it does not affect seed weight or dormancy/germination (El-Assal et al., Reference El-Assal, Alonso-Blanco, Hanhart and Koornneef2004). These effects of cry2 could be due either to direct mediation of cell elongation in the developing seed or an indirect result of the well-characterized influence of cry2 on Arabidopsis flowering time (El-Assal et al., Reference El-Assal, Alonso-Blanco, Hanhart and Koornneef2004). In one of the few studies specifically on cryptochrome expression in seed tissues, Xu et al. (Reference Xu, Xiang, Zhu, Xu, Zhang, Zhang, Zhang and Ma2009) detected very low amounts of cry1 mRNA and somewhat more of cry2 mRNA in germinating wheat embryos. Expression of embryo cry2 was further enhanced by osmotic stress and by exogenous abscisic acid (ABA).
Tomato seeds placed under moderate osmotic stress using mannitol are able to germinate in the dark, but not in the light (Fellner and Sawhney, Reference Fellner and Sawhney2001). Further investigation on light quality revealed that blue light is most inhibitory to germination, followed by white light, while red light has little effect except at the highest mannitol concentration (Fellner and Sawhney, Reference Fellner and Sawhney2002). Germination of the tomato 7B-1 mutant proved to be far less sensitive than the wild type to inhibition by osmotic stress or exogenous ABA under blue light, suggesting that the 7B-1 mutation confers lower sensitivity to ABA via a defect in blue-light signalling or perception (Fellner and Sawhney, Reference Fellner and Sawhney2002). The fact that the effectiveness of the different light treatments in inhibiting germination in the presence of mannitol or ABA is in the order dark ≈ red light < white light < blue light suggests that there is an antagonistic interaction between phytochrome and the blue-light receptor in this response. Keeping in mind the above-mentioned link between osmotic stress/ABA and cry2 expression in wheat embryos (Xu et al., Reference Xu, Xiang, Zhu, Xu, Zhang, Zhang, Zhang and Ma2009), it is tempting to speculate that the blue-light receptor in the tomato seed response to osmotic stress is also cry2.
Seed blue-light responses that could be mediated by both phyA and cryptochrome
In Arabidopsis phytochrome mutants, germination under blue light is impaired in the absence of phyA and/or phytochrome E (phyE) (Hennig et al., Reference Hennig, Stoddart, Dieterle, Whitelam and Schäfer2002), again confirming that blue-light responses in seeds can be phytochrome-mediated. However, although germination under far-red light, the optimal wavelength for phytochrome action, was almost completely abolished in the phytochrome mutants, germination under blue light was decreased by only 50% in the single mutants and by 75% in the phyAphyE double mutant (Hennig et al., Reference Hennig, Stoddart, Dieterle, Whitelam and Schäfer2002). Therefore, it is likely that germination of Arabidopsis seeds under blue light is also mediated by cryptochrome, in concert with phyA and phyE. In Amaranthus caudatus, germination is promoted by red light, whereas blue and white light are inhibitory (Nowak et al., Reference Nowak, Rudnicki and Grzesik1996). Presumably the stimulatory red-light response is mediated by the classical action of light-stable, red/far-red-reversible phytochrome B (phyB) (Borthwick et al., Reference Borthwick, Hendricks, Parker, Toole and Toole1952); the inhibition of germination under white and blue light could be due to phyA and/or cryptochrome. As the fluorescent white light source used by Nowak et al. (Reference Nowak, Rudnicki and Grzesik1996) would have contained both red and blue wavelengths but very little far-red light to antagonize the phyB response, the inhibitory effect of white light implies that, in this case, the red-light response was overridden by the opposing blue-light response, and that the strength of this response is thus due to a photoreceptor with optimal activity under blue light, i.e. cryptochrome. There are other examples in which blue-light responses in seeds could be mediated by phyA and/or cryptochrome working together in the opposite direction to phyB. In isolated developing maize kernels cultured in vitro, red and blue (broad-waveband) light have opposite effects on mature kernel weight (Felker et al., Reference Felker, Doehlert and Eskins1995). Also, an early study by Gwynn and Scheibe (Reference Gwynn and Scheibe1972) on the action spectrum of germination inhibition in lettuce seeds demonstrated that, in addition to a phytochrome-mediated peak of inhibition in the far-red (720 nm), germination is also inhibited by irradiance with blue light (400–500 nm; maximum inhibition at 470 nm), whereas green light (510–600 nm) has no influence on germination.
Seeds of Myriophyllum spicatum, an aquatic species, showed a somewhat unusual response to light in a study by Coble and Vance (Reference Coble and Vance1987), who used filters to provide low-fluence, broad-waveband light for 72 h. The seeds required light to germinate, but far-red (peak wavelength 725 nm) was the most effective wavelength (almost 100% germination), closely followed by ‘red’ (700 nm) and white (both close to 85% germination), and green (520 nm; around 77% germination). Blue light (445 nm) was more effective than darkness, but only elicited 30% germination. This broad spectrum of responses suggests that the stimulation of germination is mediated by phyA. However, as the effects of blue and green light, both suboptimal qualities for phytochrome action (although blue light is usually more effective than green), were so markedly different, it is possible that cryptochrome, activated by the blue light, acted antagonistically to phyA and decreased germination. The hypothesis that cryptochrome is involved in the blue-light response is supported by a comparison of the predicted Pfr/P of the seed phytochrome pool with the final germination percentage (Fig. 2B). Unlike the situation in P. argentatum (outlined above and shown in Fig. 2A), there is no correlation between germination and Pfr/P in M. spicatum (Fig. 2B), pointing to the involvement of a non-phytochrome photoreceptor.
A blue-light response in barley seeds that is potentially mediated by phototropin
Germination of freshly matured (conditionally dormant) barley grains is inhibited by white light or, to an equal extent, blue light, but is unaffected by red and far-red light, indicating that the inhibitory response is mediated by a non-phytochrome, probably blue-light-specific, photoreceptor (Gubler et al., Reference Gubler, Hughes, Waterhouse and Jacobsen2008). In this case, activation of the photoreceptor leads to a higher expression of a key enzyme of ABA synthesis (HvNCED1), resulting in higher grain ABA concentrations and thus inhibition of germination. In afterripened (non-dormant) barley grains, germination is possible under all light qualities, and ABA concentrations are low due to an increase in expression of the ABA catabolic enzyme HvABA8′OH1 (Gubler et al., Reference Gubler, Hughes, Waterhouse and Jacobsen2008). Microarray analysis of the coleorhiza, which appears to play a major role in ABA-mediated dormancy in barley, demonstrates that the gene encoding phototropin 1 is more highly expressed in the coleorhizae of freshly matured grains, whilst cry2 is upregulated in coleorhizae of afterripened seeds and cry1 is expressed equally in both (Barrero et al., Reference Barrero, Talbot, White, Jacobsen and Gubler2009). Thus, although phototropins are traditionally considered to be present only in green tissues and involved in maximizing the photosynthetic response, it is possible that they are involved also in mediating the dormancy level of barley grains. In contrast, cryptochrome does not appear to be required for inhibition of germination under blue light.
Unexplained green-light responses in seeds
Irradiation of dry carrot, radish and cress seeds with high-intensity green (526 and 532 nm) laser light results in an increase of biomass in the resulting plants (particularly in storage roots such as of radish and carrot), although seed germination itself is not affected (Sommer and Franke, 2006). In their excellent review on green-light responses in plants, Folta and Maruhnich (Reference Folta and Maruhnich2007) pointed out that although this green-light irradiation of dry seeds might have activated phytochrome and given the seeds a head start in growth, treatment with intense red laser light resulted in faster germination but no increase in plant biomass. It is unlikely that the response is mediated by cryptochrome, because the green-light responsivity of this photoreceptor is dependent upon a previous or simultaneous blue-light irradiation (Banerjee et al., Reference Banerjee, Schleicher, Meier, Viana, Pokorny, Ahmad, Bittl and Batschauer2007). Therefore, the green-light receptor in this case remains unknown, as does the reason for its observed stimulatory effect on biomass long after the dry seeds were irradiated.
In seed germination studies there are a number of cases where green light, applied in isolation, has the opposite effect to red or blue light, thus following the pattern observed by Folta (Reference Folta2004) of photomorphogenic responses in Arabidopsis seedlings. It is therefore possible that a specific green-light receptor, antagonistic to the red- and blue-light receptors, is mediating these responses in seeds as well as in vegetative tissues. However, the use of broad-waveband light sources in these experiments means that the green light could have been contaminated with sufficient blue light to activate cryptochrome. Two examples are: in germinating chickpea seeds, where green light causes shoot polyphenol content to increase, whereas it decreases under red and blue light (Khattak et al., Reference Khattak, Zeb, Bibi, Khalil and Khattak2007); and in young Cattleya walkeriana seedlings, which produce a lower biomass when germinated under green light compared to white, red, yellow or blue light (Islam et al., Reference Islam, Matsui and Ichihashi1999).
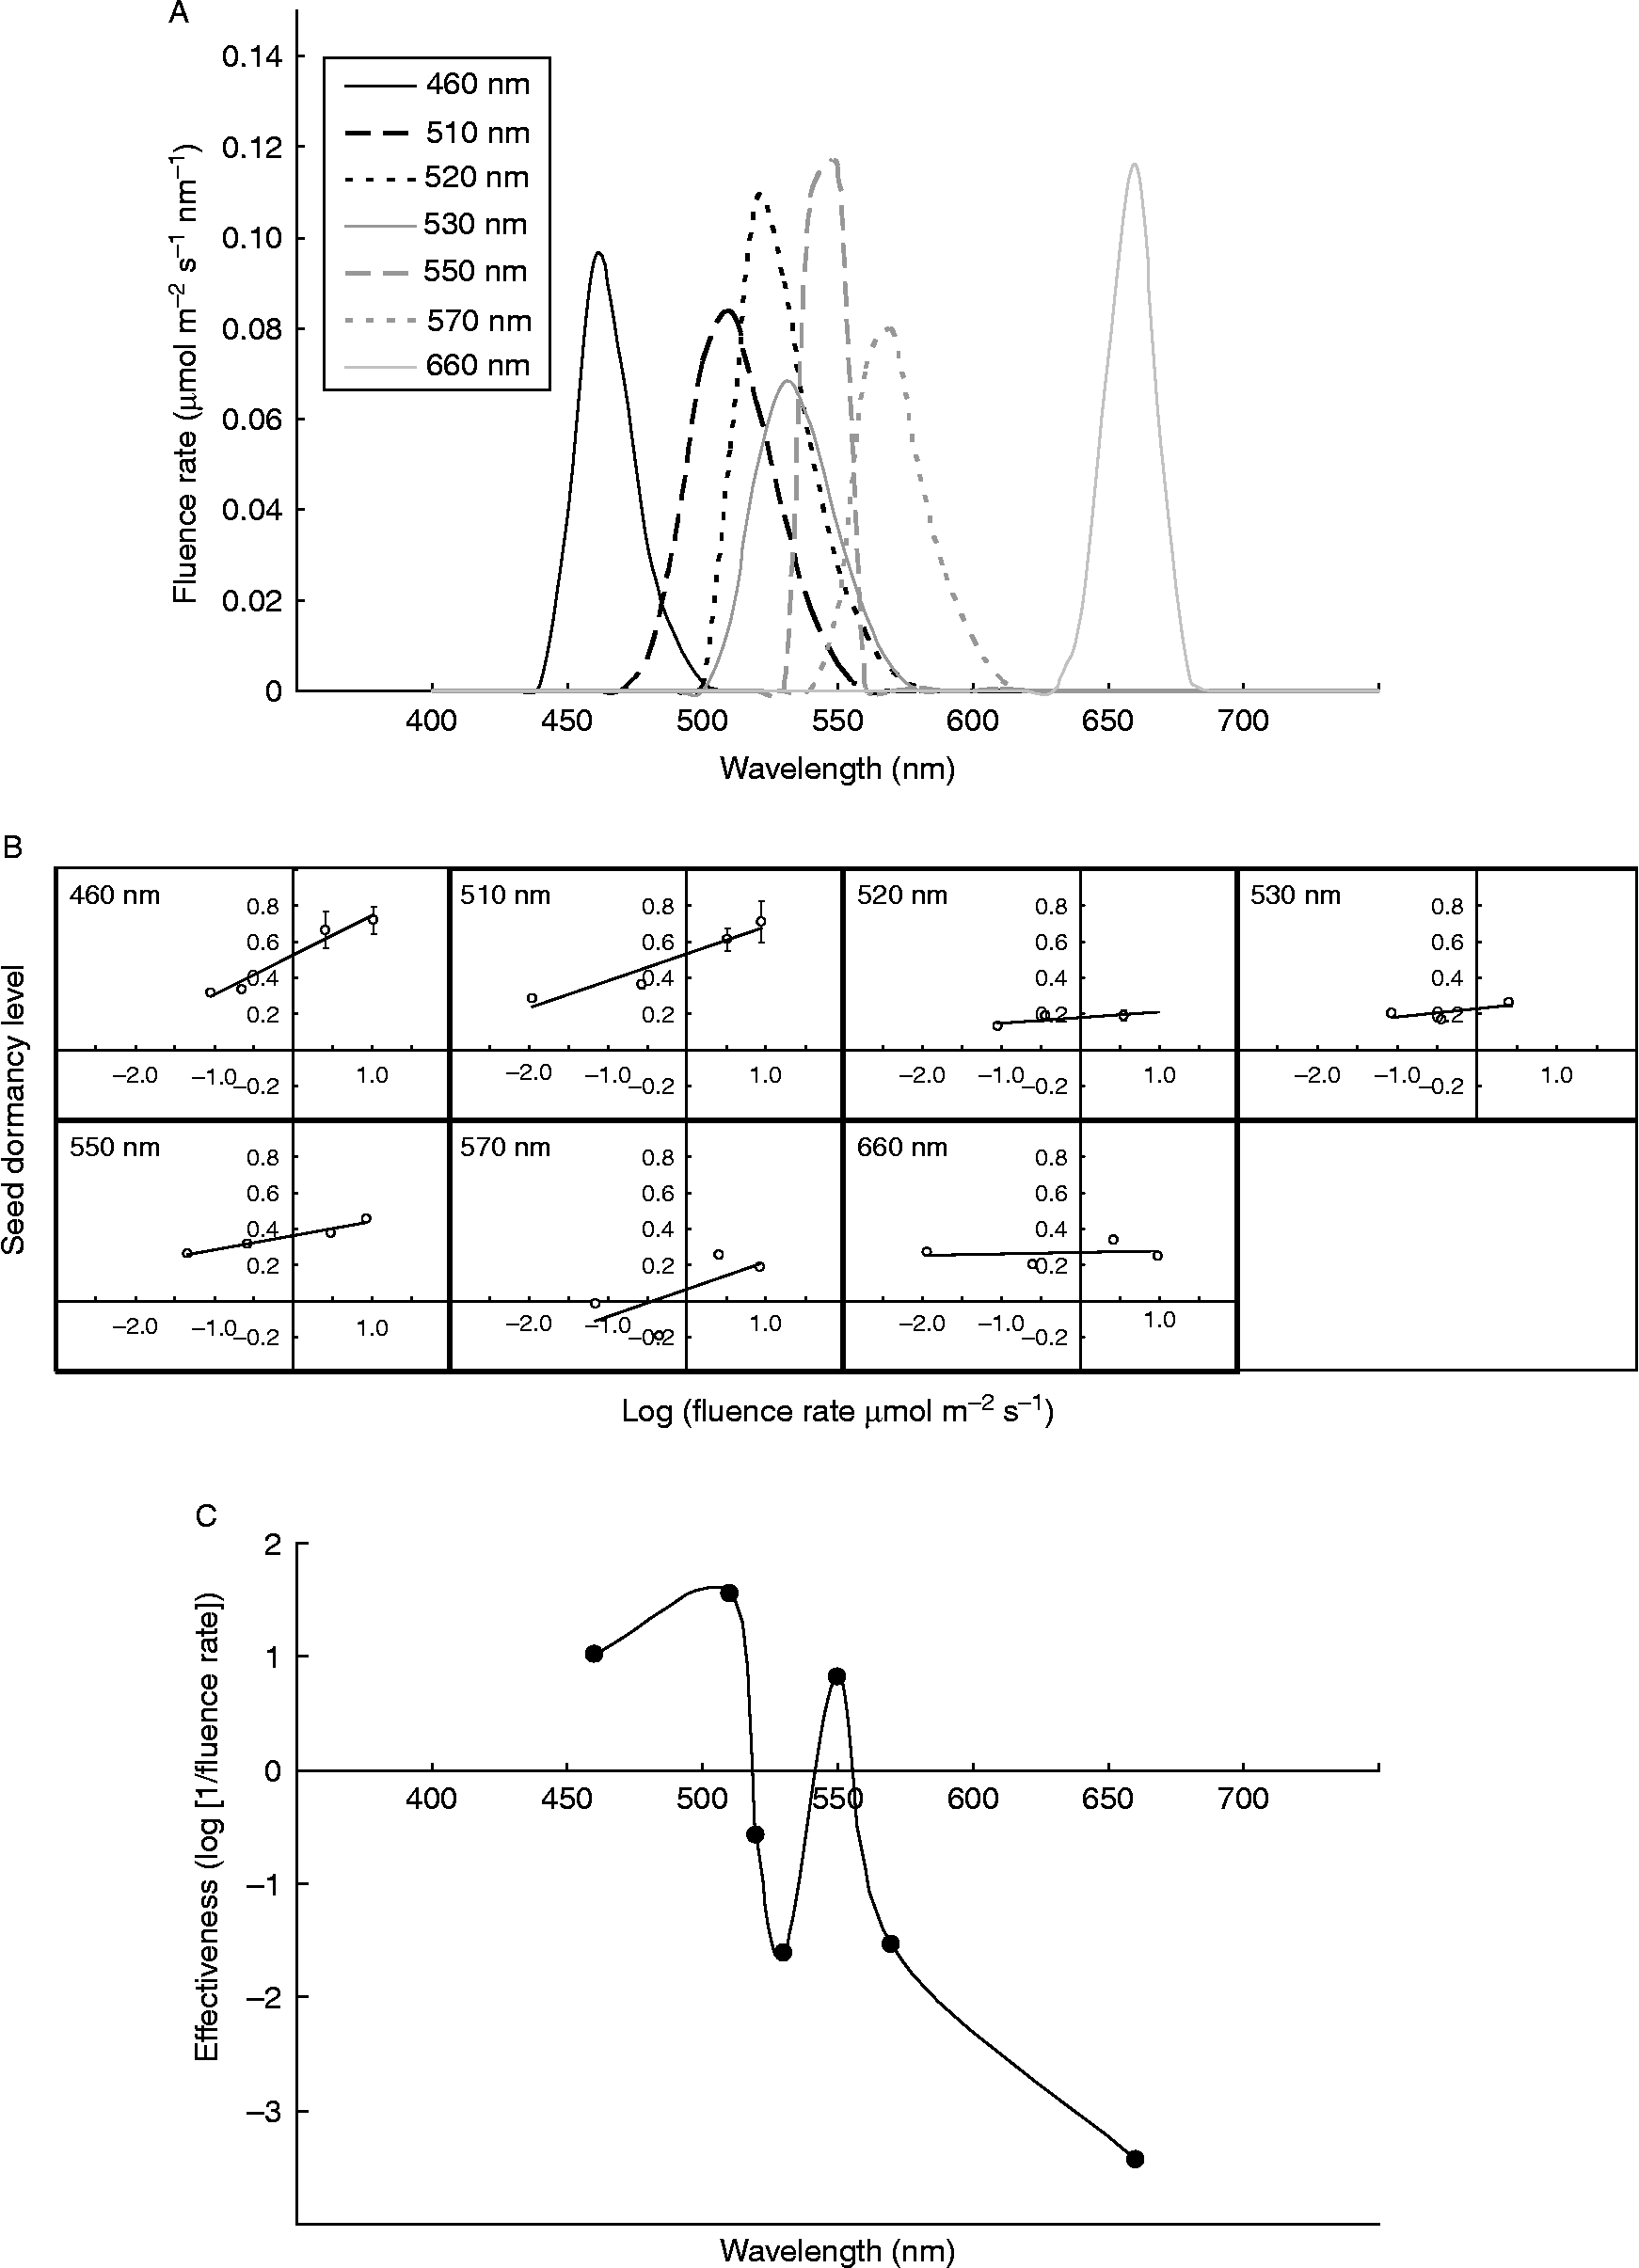
A rare instance in which blue and green light have effects of similar magnitude in the same direction (and in a manner that is blind to far-red light) is found in the inhibition of dormancy release of imbibed Lolium rigidum seeds (Goggin et al., Reference Goggin, Steadman and Powles2008). Green light is effective in the absence of blue light and acts in the same direction, whether broad- or narrow-waveband light sources are used. Hence it was hypothesized that the green-light response is mediated by a non-cryptochrome photoreceptor (Goggin et al., Reference Goggin, Steadman and Powles2008). However, the 510 nm green light-emitting diode (LED) source used in the study may have contained enough blue light to activate cryptochrome. To clarify the nature of green-light perception in L. rigidum seeds, an action spectrum of inhibition of dormancy release was constructed using narrow-waveband light with peak wavelengths of 460, 510, 520, 530, 550, 570 and 660 nm (Fig. 3A), at four fluence rates. In general, inhibition of dormancy release increased with increasing fluence rate, but this was most pronounced at 460, 510 and 550 nm (Fig. 3B). Plotting of the action spectrum reveals that in addition to an asymmetrical peak of activity at 460–510 nm (biased towards 510 nm), there is another clear peak at 550 nm (Fig. 3C). As the region between 510 and 550 nm contains a trough in which inhibition of dormancy release is weak or absent, it is unlikely that the 550 nm response is due to residual cryptochrome activity; therefore, the presence of a green-light receptor in L. rigidum seeds is a distinct possibility. Identification of this putative photoreceptor will be challenging, as the Lolium genome has yet to be sequenced and there are currently no photoreceptor mutants available in this genus.
Action spectrum of inhibition of dormancy release in Lolium rigidum seeds. The light qualities (A) used to construct the action spectrum were obtained as follows: 460 nm, unfiltered blue LEDs (Ultraleds, Macclesfield, Cheshire, UK); 510 nm, unfiltered green LEDs (Ultraleds); 520 nm, green LEDs filtered through a yellow no. 12 Kodak Wratten filter; 530 nm, green LEDs filtered through a 1-cm layer of 0.25% K2Cr2O7 solution; 550 nm, cool white fluorescent light (Osram 36W/21-840 Lumilux Plus Eco) filtered through a green Lee 124 filter (Lamp Replacements, Perth, Western Australia) plus a 1-cm layer of 0.25% K2Cr2O7; 570 nm, unfiltered yellow-green LEDs (Futurlec, Newcastle, New South Wales, Australia); 660 nm: unfiltered red LEDs (Futurlec). Spectra were measured with a StellarNet EPP2000-VIS spectrometer with irradiance calibration (Warsash Scientific). Four different fluence rates (0.025, 0.25, 2.5 and 10 μmol m− 2 s− 1) were used for each light quality, and these were obtained by varying the distance between the light source and seeds, and/or with use of Lee 209 neutral density filters. Seed stratification treatments (21 d at 20°C) were set up as described in Goggin et al. (Reference Goggin, Steadman and Powles2008), with dark-stratified controls being included in each experiment. The temperature of the agar on which the seeds were sown was maintained close to 20°C for all light qualities except 10 μmol m− 2 s− 1 660 nm (25°C) and 570 nm (37°C), as these two sources had to be closer to the seeds. After stratification, during which little to no germination occurred, the seeds were transferred to optimal germination conditions (Goggin et al., Reference Goggin, Steadman and Powles2008) and germination was counted after 7 d, with dead or empty seeds being excluded from calculations. Seeds stratified in the dark experienced release of dormancy and germinated to 70–75% after 7 d in germination conditions. To make interpretation of the action spectrum easier, the arbitrary parameter ‘dormancy’ was used, rather than germination percentage, and this was calculated as 1 − (% germination of light-stratified seeds/% germination of dark-stratified seeds) and plotted against the log of the fluence rate for each wavelength (B). To construct the action spectrum, the effectiveness of each wavelength in inhibiting dormancy release was quantified by calculating the fluence rate required to elicit a ‘dormancy’ level of 0.3. This value, log-transformed, was then plotted against wavelength according to Ahmad et al. (Reference Ahmad, Grancher, Heil, Black, Giovani, Galland and Lardemer2002) (C). The data in (B) and (C) represent pooled data from two independent experiments, each with four replicates of 50 seeds per treatment.
Potential green-light receptors
In their 2007 review, Folta and Maruhnich gave a comprehensive description of potential green-light receptors deserving of further study in plants, including heliochrome, zeaxanthin, retinal-binding proteins and an aquaporin-like flavoprotein. There is also the possibility that existing photoreceptors are slightly modified to give different absorption spectra, a widely occurring phenomenon in microalgae and cyanobacteria (Hegemann, Reference Hegemann2008; Rockwell and Lagarias, Reference Rockwell and Lagarias2010). Of particular interest is PixJ1, a novel blue/green reversible, phytochrome-like photoreceptor from the cyanobacterium Synechocystis. This protein appears to have its phycocyanobilin chromophore bound in a twisted conformation, resulting in a dramatic blue-shift of the usual red/far-red absorption of other bacterial and plant phytochromes (Yoshihara et al., Reference Yoshihara, Shimada, Matsuoka, Zikihara, Kohchi and Tokutomi2006). Similarly, an early study on the action and absorption spectra of ‘cryptochrome’ from the fungus Trichoderma harzianum showed that the dimY mutant appears to possess a modified, less-effective cryptochrome with a slightly red-shifted action spectrum (Horwitz et al., Reference Horwitz, Gressel, Malkin and Epel1985); however, the identity of the dimY protein as a true cryptochrome is unconfirmed (Schmoll et al., Reference Schmoll, Esquivel-Naranjo and Herrera-Estrella2010).
Conclusions
There is a long way to go before perception of blue and green light in seeds is understood in a detail comparable to that for phytochrome-mediated responses to red and far-red light. It is likely that any existing green-light receptor(s) will be first identified in Arabidopsis, with its sequenced genome, array of photoreceptor mutants, and well-defined photomorphogenetic responses available for elegant and unequivocal experimentation. However, the results of these investigations may point to fruitful directions for the study of non-phytochrome responses in the seeds of non-model plants, and allow processes such as germination/dormancy release, seed stress responses and light–hormone interactions to be more fully understood at the molecular and biochemical level.
Acknowledgements
We are grateful to Professor Derek Bewley for his helpful comments on the manuscript, and thank Professor Stephen Powles for providing access to facilities in the Australian Herbicide Resistance Initiative. This work was funded by the Australian Research Council.



