Is sociolinguistic variation best explained through accommodation, or identity work, or both? This question, which ultimately gets to the heart of current debates about structure and agency, is often mistaken to imply an exclusive interpretation of either account: accommodation may be framed as not agentive (e.g., Brulard & Carr, Reference Brulard and Carr2013; Kauhanen, Reference Kauhanen2017) and identity accounts may be framed as overly agentive (e.g., Bell, Reference Bell and Coupland2016, on Eckert, Reference Eckert2012; Guy & Hinskens, Reference Guy and Hinskens2016). In the present paper we test the claim that phonetic variation among Scottish members of the UK Parliament (MPs) is best explained as “unconscious” convergence to Southern English norms (Brulard & Carr, Reference Brulard and Carr2013; Carr & Brulard, Reference Carr and Brulard2006). We consider an alternative analysis: that phonetic variation is an available resource for acts of political identity (Hall-Lew, Coppock, & Starr, Reference Hall-Lew, Coppock and Starr2010). In comparing a year's worth of political speeches (2011–2012) from 10 MPs from Scotland, we find that variation is significantly correlated with the MPs’ political party. To understand this particular group level effect, we consider the context of the historical and regional diversity of the phonetic variables examined. The results indicate that the phonetic variation examined here cannot be (fully) explained by pressures to accommodate. Rather, we suggest that the variation indexes political party membership, with a subset of individuals drawing on that indexicality in speech production. This paper integrates studies of accommodation between Scottish and English interlocutors (e.g., Llamas, Watt, & Johnson, Reference Llamas, Watt and Johnson2009) and sociophonetic work in Scottish contexts more generally (e.g., Lawson, Reference Lawson2014) with the growing body of work on linguistic variation and political identity (e.g., Hall-Lew et al., Reference Hall-Lew, Coppock and Starr2010).
THE SOCIOLINGUISTIC CONTEXT: SCOTS IN THE UK PARLIAMENT
In 2011–2012, 9% (n = 59) of the 650 MPs at Westminster, in London, represented Scottish constituencies, the rest representing England, Wales, and Northern Ireland. Approximately 11% (n = 85) (Berry, Reference Berry2013) could be more broadly classified as “Scottish” (some Scottish MPs represented constituencies outwith Scotland).Footnote 1 Scots’ use of the English language in the UK Parliament has been taken as a prime example of linguistic accommodation (Carr & Brulard, Reference Carr and Brulard2006).
Wells (Reference Wells1982:394) described Scottish MPs taking elocution lessons back in the 18th century. Scottish MPs have long been subject to the sociolinguistic pressure of speaking some version of Scottish English while working in social environments where Received Pronunciation (RP) is still a normative accent. RP has traditionally been the variety used by “public figures” (Wells, Reference Wells1982:279) in the UK and the variety that, until recently, has been required for “social advancement, as a gateway to employment in the upper echelons of government and military service” (Agha, Reference Agha2003:232). The UK Parliament may contain a greater proportion of native RP speakers than the general population. One description of RP is as “Public [independent] School Pronunciation” (Mugglestone, Reference Mugglestone2007:219), and 35% of current MPs attended independent schools, compared to only 7% of the UK population (The Sutton Trust, 2010). Kirkham and Moore's (Reference Kirkham and Moore2016) analysis of former Labour leader Ed Miliband takes “modern” RP to be the relevant descriptor of his speech (despite his representing a Northern English constituency), as does Carr and Brulard's (Reference Carr and Brulard2006) study of Scottish MPs and political journalists. What matters for analyzing Scottish MPs is less about RP specifically and more about any Southern English variety that has, for example, the trap/bath split (Wells, Reference Wells1982). Evidence of the adoption of such features is what Carr and Brulard (Reference Carr and Brulard2006:31, 41) framed as “Anglo-English influence” or “adoptive RP.” The present paper tests this claim with acoustic analysis and a consideration of Scottish lexical sets.
The linguistic repertoires of Scottish MPs are quite varied. There are individuals born and raised in Scotland who are native RP speakers (Romaine, Reference Romaine1980), although their numbers have been declining (Johnston, Reference Johnston and Britain2007). While MPs are more likely to be native RP speakers than the average Scottish person is (see Scobbie, Hewlett, & Turk, Reference Scobbie, Hewlett, Turk, Foulkes and Docherty1999:242), Scottish MPs hail from a range of regional, educational, and social class backgrounds. Some might be better considered speakers of Scots (Library of Congress [2014], language code ISO 639-2 sco) than speakers of Scottish English (Library of Congress [2014], language code ISO 639-2 eng). We return to this when introducing our speaker sample.
To examine the likelihood of accommodation, we also consider the possibility of identity work. Variation that becomes a resource for social identity work may impact individual differences in accommodative behavior or may result in nonaccommodative patterns. Here, we consider the identity of political party (Hall-Lew et al., Reference Hall-Lew, Coppock and Starr2010). Carr and Brulard (Reference Carr and Brulard2006) noted that one politician in their sample who did not appear to converge to Anglo-English norms was a member of the Scottish National Party (SNP). To investigate this observation, we conduct a systematic comparison between SNP and Scottish Labour Party politicians. At the time of data collection (2011–2012), the UK Parliament as a whole was primarily distinguished between members of the coalition government (Conservatives and Liberal Democrats) and members of the official opposition (mostly Labour). Scottish constituency representatives, in contrast, were mostly Labour or SNP members. Both Labour and the SNP were regarded as center-left parties (Leith & Soule, Reference Leith and Soule2011), differentiated principally by their position on whether Scotland should remain part of the United Kingdom (Labour) or become an independent nation (SNP) (Hassan & Shaw, Reference Hassan and Shaw2012). The expectation with respect to linguistic accommodation is that SNP MPs are less likely to adopt RP norms than Labour MPs are.Footnote 2
Political identity can be operationalized in a number of different ways. Some sociolinguists have opted for political ideology (e.g., left-wing or liberal) (Campbell-Kibler, Reference Campbell-Kibler2010; Jaggers, Reference Jaggers2016; Knoblock, Reference Knoblock2014; Silva, Peters, Duhaish, Kim, Koo, Marji, & Park, Reference Silva, Peters, Duhaish, Kim, Koo, Marji and Park2011). Other work (e.g., Hall-Lew, Starr, & Coppock, Reference Hall-Lew, Starr, Coppock, Hernández-Campoy and Cutillas-Espinosa2012; Labov, Reference Labov2010) has considered individuals' attitudes toward particular policies (e.g., abortion, immigration). We choose political party rather than ideology based in part on work in political psychology noting that, “50 years of research on public opinion shows that a unidimensional model of ideology is a poor description of political attitudes for the overwhelming proportion of people virtually everywhere” (Feldman, Reference Feldman, Sears, Huddy and Jervis2003:477; see also Converse, [1964] Reference Converse2006; Fowler & Kam, Reference Fowler and Kam2007:818). We follow Hall-Lew et al. (Reference Hall-Lew, Coppock and Starr2010, Reference Hall-Lew, Starr, Coppock, Hernández-Campoy and Cutillas-Espinosa2012) who also relied on party membership as a measure of political identity in the analysis of phonetic variation among elected politicians (other variationist studies focusing on elected politicians include Kementchedjhieva [Reference Kementchedjhieva2016]; Kirkham and Moore [Reference Kirkham and Moore2016]; Lei and Liu [Reference Lei and Liu2016]; Podesva, Reynolds, Callier and Baptiste [Reference Podesva, Reynolds, Callier and Baptiste2015]).
In the analysis that follows, we first argue that there is little evidence for accommodation of the kind Carr and Brulard described. We then present evidence that a politician's party may be a predictor of phonetic variation in the parliamentary setting, and that this variation might be taken to indicate a kind of accommodation. However, we argue that the accommodation is not necessarily toward Anglo-English, but rather toward competing Scottish norms. This argument is based on an understanding of the historical phonology of the Scottish and English low front vowels.
THE SCOTTISH AND RP LOW FRONT VOWELS
The RP TRAP and BATH vowels
A key variable for evidencing “Anglo-English influence” that Carr and Brulard (Reference Carr and Brulard2006) pointed to (following Abercrombie, Reference Abercrombie, Aitken and McArthur1979) is the RP (or Southern Standard British English, SSBE) trap/bath distinction. This distinction is the result of an incomplete sound change whereby the bath lexical set split away from the trap set sometime before the 20th century (Wells, Reference Wells1982), resulting in a small lexical subset with vowels in bath longer and/or backer than those in trap. A backed bath vowel is a feature of RP and, we suggest, part of the Westminster linguistic norm. Stuart-Smith, Smith, Rathcke, Santi, and Holmes (Reference Stuart-Smith, Smith, Rathcke, Santi, Holmes, Lee and Zee2011) found that Scots may converge toward speakers of SSBE's trap/bath distinction in laboratory interactions. Since Scottish speakers have incomplete knowledge of which words belong to the bath set, the use of backed tokens of the trap lexical set might also indicate convergence to RP/SSBE.
The other known source of socially meaningful variation in that area of the vowel space is the height of the trap vowel. In RP, trap has been gradually lowering and backing from its relatively high, front [æ]-like position over the course of the 20th century (Fabricius, Reference Fabricius2007; Harrington, Palethorpe, & Watson, Reference Harrington, Palethorpe and Watson2000; Wells, Reference Wells1982) toward [a].
The Scottish CAT vowel
Scots and Scottish varieties of English, like other Northern English varieties, did not undergo a trap/bath split. Instead, these varieties have a single low central vowel, cat (Johnston, Reference Johnston and Jones1997). The sociolinguistic facts are phonetically and phonologically complex, and understanding that complexity is necessary before conducting any analysis of potential accommodation toward RP.
The cat lexical set defined by Johnston (Reference Johnston and Jones1997) encompasses Wells's (Reference Wells1982) trap, bath, and palm lexical sets. Macafee (Reference Macafee and Hickey2004) also included start, though this often occurs with a back allophone [ɑ]. This points to the fact that cat can have its own internal subsets, and these phonological distinctions can resemble, but not match, the RP lexical sets (Abercrombie, Reference Abercrombie, Aitken and McArthur1979; Romaine, Reference Romaine1985). For example, a Scottish speaker might pronounce grass and path with a backed variant due to a phonotactic constraint backing /a/ before a voiceless fricative, but this is a different constraint to the one that motivated the trap/bath contrast in RP. This poses a challenge for researchers: a reliance on RP subsets could result in concluding that a speaker has an RP distinction (as the result of accommodation, for example) when in fact the distinction is a native Scottish one.
While it might be advisable to conduct a lexical subset analysis based on Scottish categories rather than non-Scottish RP ones (e.g., Stuart-Smith, Reference Stuart-Smith, Schneider, Burridge, Kortmann, Mesthrie and Upton2004), we have observed that university students from the local community in Edinburgh disagree about the lexical membership of these sets. This suggests that any recategorization would not be valid for all speakers in a sample. Determining the membership of every lexical item in a lexical set is ultimately a historical question that is beyond the scope of the paper. Following the relevant previous literature, we therefore make use of Wells's RP-based lexical sets. However, to avoid falsely ascribing a low vowel distinction to RP influence, we look at the lexemes relevant to any cases of a possible trap/bath distinction.
In part because of this complexity, the Wells lexical sets considered in studies of the cat vowel are often limited to trap and bath (Lawson, Reference Lawson2011; Macaulay, Reference Macaulay1977). Here we consider trap, bath, start, and some incidents of palm. And while previous work has focused on specific urban varieties of Scots or Scottish English, here we have a regionally diverse range of speakers due to the fact that our speaker sample is the result of electoral politics. With reference to RP lexical subsets, previous work suggests that there are at least four phonological systems in Scottish communities: Scots, Scottish Standard English (SSE), Highland-and-Hebridean English (HHE), and RP. The following describes the lexical incidence of cat as well as its phonetic similarity to the strut vowel, which differs by region and helps characterize the phonetic quality of cat:
-
• A typical Scots speaker has been described as not distinguishing phonemically or allophonically among trap/bath/palm/start (Chirrey, Reference Chirrey, Foulkes and Docherty1999; Macafee, Reference Macafee and Hickey2004). Its position is low and central. start might also be derhoticized. For some Southwestern Scots speakers, strut will overlap in F1/F2 space with cat.
-
• A typical SSE speaker has been described as distinguishing allophonically between a more front trap/bath/palm and a backed start. Like Scots, start might be derhoticized, though to a lesser extent than Scots. strut patterns as in Scots, or is more “central and slightly further back” than cat (Schützler, Reference Schützler2011:34), at least in Edinburgh. Like Scots, all the variants are low.
-
• A typical HHE speaker distinguishes trap/bath from palm/start (Shuken, Reference Shuken and Trudgill1984:162), although “both vowels have a wide range of variation in the front-back parameter,” and on the Isle of Lewis, the contrast is realized in terms of duration rather than anteriority. palm might also differ from start depending on the variety of HHE; in Lewis, palm is closer to [a:] while start is higher, [ɐ:]. In general, the variants are low. start is rhotic. It is less straightforward to describe HHE as having a single cat vowel. HHE speakers are variable in their realization of strut, which can be very centralized.
-
• A typical RP speaker will distinguish trap and bath, with bath further back (and longer) such that it is merged with palm and start. Unlike the other varieties, in RP start is nonrhotic (as opposed to Scots's derhotic). RP would not be said to have a single cat vowel. Conservative RP speakers produce a more back and low strut vowel, and more mainstream RP speakers produce strut as a nonperipheral vowel, “closer phonetically to younger speakers’ variant of trap” (Fabricius, Reference Fabricius2007:296).
These descriptions are only a general guide. Differences between them are in some cases very fuzzy (especially between Scots and SSE).
In addition to phonological subsets, there are several sociophonetic accounts of variation within the cat vowel (defined as trap/bath). Variation in anteriority has been correlated with region (Johnston, Reference Johnston and Jones1997), with a back cat vowel in Northeastern varieties (e.g., Moray) and a front cat vowel in Southwestern varieties (e.g., Glasgow). Variation in height has been correlated with social class in both Glasgow and Edinburgh, with lower variants attributed to working-class speakers (Aitken, Reference Aitken, Aitken and McArthur1979; Macaulay, Reference Macaulay1977; cf. Johnston, Reference Johnston1984). Lawson's (Reference Lawson2011) analysis of communities of practice in a working-class all-boys school in Glasgow found variation in cat height, with the anti-institutional “Neds” group showing a significantly lower vowel than the proinstitutional “Schoolie” group. This points to a recursivity of social meaning (Irvine & Gal, Reference Irvine, Gal and Kroskrity2000), whereby a lower Scottish cat vowel indexes some quality shared between a macrosocial working-class identity (Macaulay, Reference Macaulay1977) and a microsocial anti-institutional stance (Lawson, Reference Lawson2011). In contrast, a raised cat vowel is associated in urban Scotland with older, middle-class speakers, such as the now rare but highly stereotyped Morningside English (Johnston, Reference Johnston1984; Romaine, Reference Romaine1985), which has been a feature of Scottish varieties since the early 20th century (Grant, Reference Grant1914, cited in Romaine, Reference Romaine1985).
METHODS
Speaker sample
We constructed a speaker sample that allows for controlling known social factors as well as possible. Our small sample group comprises superficially similar speakers all participating in the same speech community: white, middle-aged, male, Scottish MPs. The sample is internally differentiated with respect to region and social class. We also chose the sample to test for the additional social factor, political party.
Political contexts change rapidly. Data for the present study were collected in 2011–2012, when there were only six SNP MPs (in contrast, 56 of the 59 Scottish constituency seats were won by the SNP in 2015). We analyzed the five men and excluded the one woman. The SNP sample was then matched as far as possible with a comparable sample of Scottish Labour MPs. We selected five male Labour MPs with class and region contrasts, as far as available (see the online Appendix in the supplementary material). We made every effort to control for potentially confounding social factors, such as length of time served in Parliament. Both party samples represent a range of ages and political seniority, but neither factor emerged as significant in the overall analysis and will not be discussed further.
Given previous findings that the vowel quality of cat is predicted by speaker social class (F1) and region (F2), an ideal speaker sample would have a balanced representation by these factors as well as by political Party. However, political parties and their representatives are associated with social class and regional identity in complex ways.
The Labour Party has historically been linked with trade unions (Hassan & Shaw, Reference Hassan and Shaw2012; Reid & Pelling, Reference Reid and Pelling2005), including some individual career paths from trade union official to MP. However, the relationship between trade unions and the Labour Party has been under review (Collins, Reference Collins2014), and there are signs that the relationship between trade unions and social class is changing (e.g., a shift in trade union membership from manufacturing to public sector occupations [Hassan & Shaw, Reference Hassan and Shaw2012]). Conversely, the early SNP was nicknamed “tartan Tories” by the Labour Party, in reference to 1970s victories in rural, formerly Conservative (Tory), seats (Hassan, Reference Hassan2009). Yet, despite implications that the SNP did not represent the working class, analysis of the 2014 independence referendum voting patterns found that the SNP stance was supported more by working-class than middle-class voters (Curtice, Reference Curtice2014). Overall, it is not the case that either party was clearly more “working class” than the other in 2011–2012. Our speakers’ social class and political party can be considered independently. Their social class designation was based on their occupations before becoming politicians, their parents’ occupations (if known), and their education level (amount and type). Speakers were assigned to one of four broad class levels (see the online Appendix in the supplementary material): upper middle class, middle class, lower middle class (which includes upper working class), and working class. Social class is highly complex, and for many of the speakers, assignment to a particular class was not straightforward. The sample includes one upper middle class (Labour), two middle class (both SNP), three lower middle class (one Labour, two SNP), and two working class (Labour).
Speaker Region is also affected by the realities of political representation. More MPs represent urban than rural areas. Scotland's “Central Belt” (including Edinburgh and greater Glasgow) has many more MPs than the Highlands and Hebridean Islands. In 2011–2012 the Central Belt was heavily represented by Labour. The Highlands and Islands were represented by the SNP and the Liberal Democrats. Only one of the Labour MPs from the Eastern Central Belt was demographically comparable to the SNP sample: the rest were women, MPs not raised in Scotland, or MPs who were too senior.Footnote 3 Designating Region based on childhood and secondary school locations (see the online Appendix in the supplementary material), none of the SNP MPs analyzed here came from the West. Our representation of Region is therefore collinear with Party with the exception of two MPs: McGovern (Labour, the East) and MacNeil (SNP, the Hebrides). We will return to these and other individuals complicating group-level comparisons.
Although similar in many ways, the individuals examined here have differences that present complexities for group-level analysis. These facts reflect the realities of political representation: voting patterns, regional representation, and the social motivations for party affiliation among politicians do not result in conveniently balanced samples. To rigorously consider the relationship between sociophonetic variation and political party membership, it is necessary to come to grips with these complexities as best as possible, and our approach to addressing this challenge is, we hope, a significant methodological contribution.
Data collection
Recordings from the UK House of Commons, including all types of oral parliamentary activity in the main chamber, were purchased from the Parliamentary Recording Unit. As far as possible, speakers are represented by every speech longer than 30 sec given in the main chamber in 2012. Additional material was collected from 2011 if speakers spoke relatively little in 2012 (Weir, McGovern); one speaker spoke very frequently in 2012 (Alexander) and was only sampled every few months. We also took speech from 2011 from one additional speaker (Robertson) to avoid representing 2011 only by speakers who speak infrequently. In total, approximately 10.5 hr of speech were analyzed.
Vowel analysis
In examining speakers’ productions of the Scottish cat vowel, we consider two possible indicators of accommodation: (a) evidence for a backed bath vowel, indicating accommodation to RP/SSBE, and (b) evidence for a raised trap vowel, indicating accommodation to either RP/SSBE or middle-class Scottish norms. Vowel tokens were segmented by hand by four different researchers, with a subset double-checked by the first two authors to confirm high interrater reliability.Footnote 4 In addition to cat, tokens of the Scottish meet vowel (akin to Wells's fleece set) were coded for purposes of vowel normalization (Fabricius, Watt, & Johnson, Reference Fabricius, Watt and Johnson2009). We also coded for strut to enable the speaker-specific comparison in the centrality of the cat vowel. This last coding was based on 15 tokens per speaker taken from each speaker's longest speech in 2012 (for McGovern, who has no single long speech, multiple short speeches were used until 8 tokens were obtained).
Tokens of cat were further coded according to Wells's (Reference Wells1982) lexical sets. In contrast to much previous work, we included tokens of the palm and start classes as well as trap and bath.Footnote 5 One unusual decision we took was to exclude members of the palm lexical set unless they were proper names and to relabel this lexical set proper. This decision was based on the nature of the corpus, which features a low frequency of common nouns in the palm class but high frequency of proper names, including ones with “foreign-a” (Boberg, Reference Boberg1999, Reference Boberg2009; e.g., Afghanistan and Pakistan), and non-“foreign-a” (e.g., Salmond, Thatcher), and including titles (e.g., Chancellor, Majesty) and specific group affiliations (e.g., Backbench, Democrats).Footnote 6 , Footnote 7 Any proper names from any lexical set other than palm were excluded.
Sound files were segmented exhaustively for tokens that occurred in content words,Footnote 8 with primary lexical stress, and at least 50 msec long. Formant measurements were generated using a Praat (Boersma & Weeknink, Reference Boersma and Weenink2014) script written for Akustyk (Plichta, Reference Plichta2006/2012), resulting in the two dependent variables: median F1 and median F2 (based on measurements taken every 10 msec). Measurement errors were excluded by omitting tokens beyond two standard deviations of the median formant values for the had and hard vowels described by Ferragne and Pelligrino (Reference Ferragne and Pellegrino2010) for Glasgow English or Scottish Highland English.Footnote 9 Tokens following or followed by a vowel or a pause, occurring in quoted speech, occurring with loud background noise, or occurring in a unique phonological environment (one token of yards) were also excluded.
The resulting dataset has 3716 tokens of cat, mostly represented by trap (n = 2079), with many fewer tokens for bath (n = 511), proper (n = 335), and start (n = 653). Representation varies by speaker, from n = 688 for Alexander to n = 141 for McGovern (mean, n = 358; median, n = 338). Token counts are balanced between SNP (n = 1788) and Labour (n = 1790).
RESULTS 1: THE TRAP/BATH CONTRAST
First, we examine each individual speaker for evidence of variable use of a bath distinction. Doing so necessitates attention to variation within the Scottish cat vowel known to differ among speakers of Scots, SSE, HHE, and RP. (Although Scots is unusual for UK Parliament, the sample does include speakers who have used Scots lexis in official speeches there.Footnote 10 )
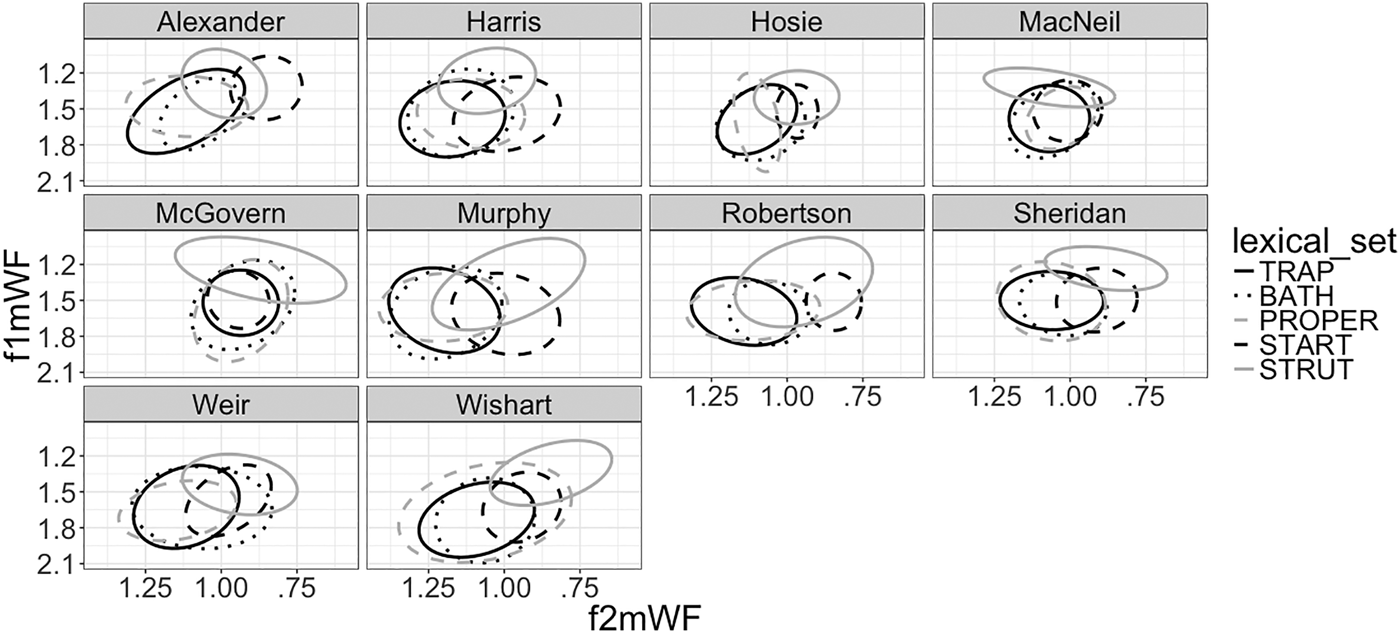
Several differences can be seen in Figure 1. MacNeil has an internally consistent cat vowel, probably because he is from the Isle of Lewis, where trap/bath and proper/start are distinguished by a length contrast (Shuken, Reference Shuken and Trudgill1984). McGovern also has a lack of differentiated subcategories and is perhaps the only speaker here with the traditional Scots pattern. His cat vowel is backer than MacNeil's, in line with expected regional differences. At the other extreme are Alexander and Robertson, who are similar to one another: start is clearly distinct from the other three subcategories, and they show a slight backing of bath. Multivariate analysis of variance modelsFootnote 11 on F1 and F2 for each speaker show that Alexander and Robertson are the only speakers with a significant difference between trap and bath. While we can say they are the most RP-like, they are not RP speakers: a true RP system would have bath much closer to start, and start would be nonrhotic. These are SSE speakers with some RP-like tendencies. The remaining six are typical SSE speakers, with trap and bath overlapping, and start distinct in the F1/F2 space. Weir is slightly different in that his bath overlaps with both trap and start. For everyone, proper overlaps with trap/bath.
Scottish MPs’ low vowels according to Wells's (Reference Wells1982) lexical sets, with proper rather than palm (see Methods), and strut included for reference. Ellipses represent 95% of the distribution, based on a t distribution.

Overall, we (almost) see all four phonological patterns among these 10 speakers: one speaker of HHE, one speaker of Scots, and eight speakers of SSE, two or three of whom show some RP-like qualities: Alexander, Robertson, and Weir. All have biographies that can explain their trap/bath configurations without reference to accommodation toward or influence from Westminster. Robertson was born in London to a German mother and Scottish father and was brought up in Edinburgh, although we do not know the age at which he moved from London. He was clearly exposed to diverse phonological systems both before and after his Critical Period (Lenneberg, Chomsky, & Marx, Reference Lenneberg, Chomsky and Marx1967). Alexander and Weir were the only speakers trained as lawyers, which entails an orientation to a certain upper-middle-class persona.
However, recalling Abercrombie (Reference Abercrombie, Aitken and McArthur1979), the question remains whether these speakers’ backed bath vowels are indeed due to RP influence, or whether they actually belong to a traditional Scottish subcategory, where certain RP/SSBE trap lexemes such as gather and value are regularly produced further back than others. Looking at the lexical incidence of trap, Robertson shows no backed trap lexemes, while Alexander and Weir do. Furthermore, most correspond to those Abercrombie (Reference Abercrombie, Aitken and McArthur1979) identified, suggesting that Alexander's and Weir's apparent RP-like bath-backing might rather be an artefact of a traditional Scottish distinction. If so, then for all three speakers, their trap/bath pattern is attributable to pre-Westminster acquisition, not accommodation to Westminster (cf. Carr & Brulard, Reference Carr and Brulard2006). Thus, the only speaker in the sample who might be characterized as having an RP-influenced trap/bath distinction is Robertson. Even there, the trap/bath distinction is phonetically subtle.
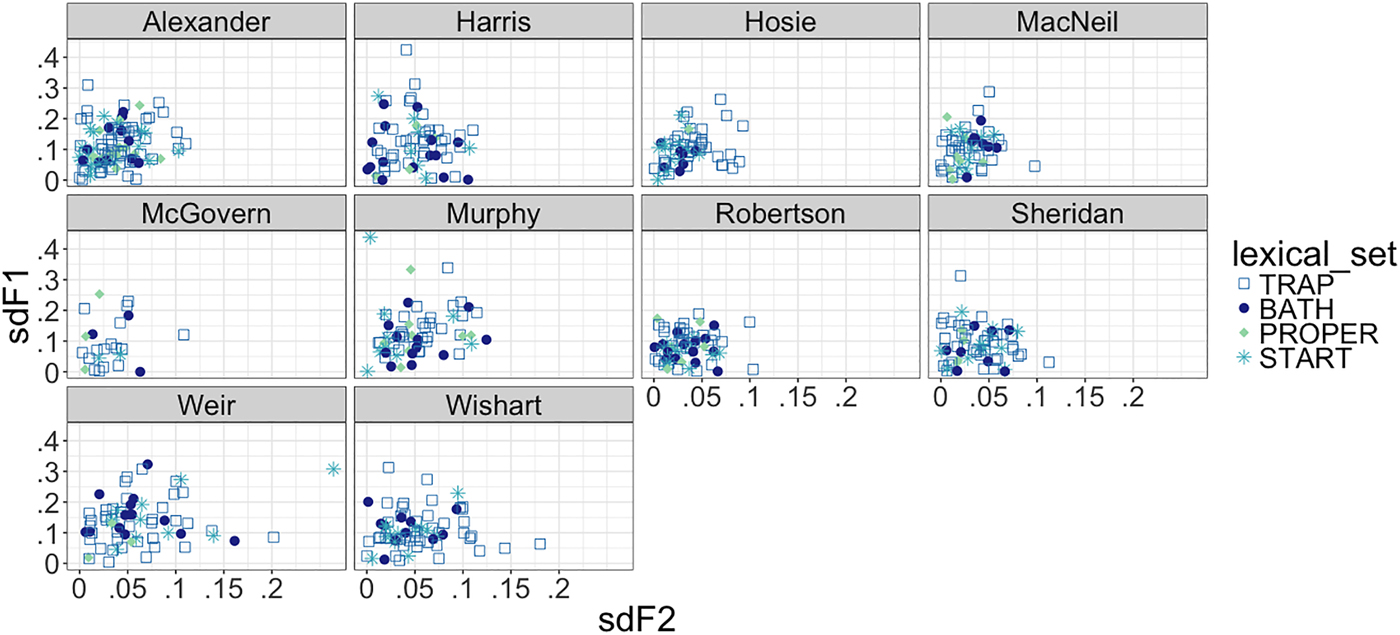
But while speakers’ overall distributions do not suggest accommodation to RP/SSBE, perhaps this is because accommodation is more likely to be seen in intralexeme variation than overall means. If Scottish English speakers are unsure of which lexemes belong to trap versus bath (Stuart-Smith et al., Reference Stuart-Smith, Smith, Rathcke, Santi, Holmes, Lee and Zee2011), then perhaps evidence of their attempts at convergence would be if we saw only occasionally backed productions of trap/bath. We can approximate a measure of this by looking at the standard deviations of trap and bath lexemes (see Figure 2), where a speaker showing no accommodative attempts will have less variation than a speaker who occasionally backs trap/bath. We find that, for all speakers, trap lexemes are the most variable, with the possible exception of one or two bath lexemes by Weir and Murphy: answer and examples. The trap words that are the most variable in F2 are families (Weir), dynamic (Wishart), than (Weir), and imagine (Wishart), also all prenasal. Perhaps speakers occasionally accommodate to RP by backing instances of trap that they analogize to the prenasal bath context. Even if this is the case, we argue that this is a far cry from the robust evidence needed to claim that these Scottish MPs are converging toward RP/SSBE through the adoption of a distinct bath vowel.
Standard deviations of F1 and F2 per lexeme, plotted by lexical set, by speaker.

RESULTS 2: THE CAT VOWEL
We now consider the cat vowel as a whole, encompassing all four lexical sets. We first consider inferential modeling, keeping in mind that the low number of speakers and lack of exact balance between factor levels means that these should be treated with caution. We model the normalized median F1 and F2 values of cat separately with two best-fit linear mixed-effects models (Baayen, Reference Baayen2008) using the lmerTest package (Kuznetsova, Brockhold, & Christensen, Reference Kuznetsova, Brockholf and Christensen2014) in R (R Core Development Team, 2014).Footnote 12
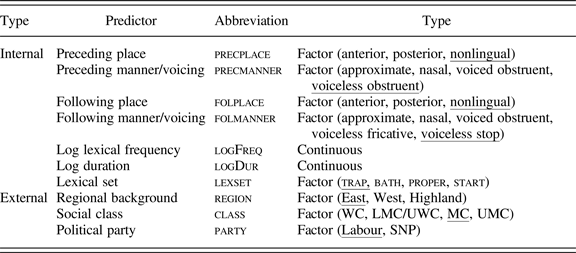
Of all the predictors tested (Table 1), the most complicated is phonological environment, which was represented in four ways: preceding and following place, and preceding and following manner/voicing. Following manner/voicing was coded with attention to those environments that historically conditioned the emergence of bath (Wells, Reference Wells1982:233); voiceless stops (never bath contexts) were distinguished from voiceless fricatives (often bath contexts). The dataset is swamped by tokens of trap followed by a voiceless obstruent (n = 909). Following voiceless fricatives and nasals are proportionally much more representative of bath (58% and 36% of 511 tokens) than trap (10% and 30% of 2079 tokens). Data are sparse overall for proper ( n = 335). The following phonological environment was always (r) for start (n = 727); instances of weak rhoticity or variable nonrhoticity were rare in this dataset (in contrast to speakers in Carr and Brulard [Reference Carr and Brulard2006]), and any such tokens were excluded from this analysis.
Coding for model predictors

Note: Each reference level is underlined. LMC, lower middle class (which includes upper working class); MC, middle class; UMC, upper middle class; WC, working class.
Other linguistic constraints included Lexical Set, defined by Wells's (Reference Wells1982) criteria for RP, and (log) lexical frequency (LogFreq), which we based on the spoken portion of the British National Corpus (Leech, Rayson, & Wilson, Reference Leech, Rayson and Wilson2001), and which is based in part on recordings from UK Parliament. We also tested for the (log) duration of the (hand-segmented) vowel (LogDur). Duration values must be treated with caution because of their relationship to rate of speech, which we only loosely mitigate here through the inclusion of a random intercept for speaker. Preliminary analysis of rate of speech found interspeaker variation to be less than intraspeaker variation. cat is one of the vowels least affected by the Scottish Vowel Length Rule (Aitken, Reference Aitken, Benskin and Samuels1981; Scobbie et al., Reference Scobbie, Hewlett, Turk, Foulkes and Docherty1999).
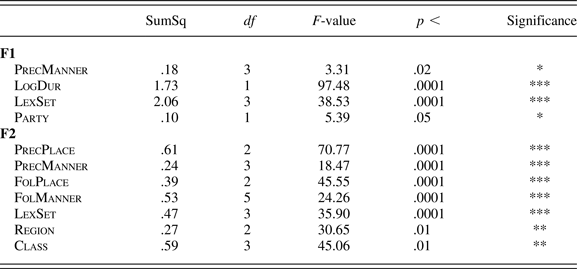
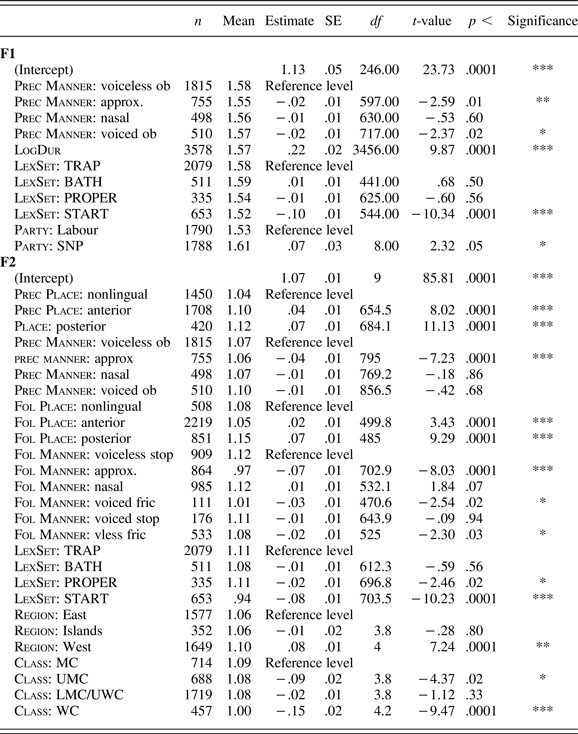
The results show that Phonological Environment and Lexical Set account for variation in both F1 and F2, Duration accounts for variation in height only, and Lexical Frequency is not significant in either model (Table 2). The lack of a frequency effect may or may not be related to the unusually high number of low frequency words in this dataset (represented especially by proper), and future study might consider a corpus-internal calculation of word frequency instead, “to determine frequency within the semantic domain of politics” (Podesva et al., Reference Podesva, Reynolds, Callier and Baptiste2015). Vowel duration, in contrast, is a well-known correlate of F1, especially for low vowels, due to effects of target undershoot (Lindblom, Reference Lindblom1963; Moon & Lindblom, Reference Moon and Lindblom1994).
Best-fit lmer models for cat F1 & F2: Main effects

Note: *p < .05, **p < .01, ***p < .001.
Preceding and Following Place and Manner accounted for variation in F2, while only Preceding Manner emerged for F1 (Table 2). One effect is that a preceding approximant (e.g., plan) predicts a higher, backer cat vowel than a preceding voiceless obstruent (e.g., pan) (Table 3). A backer cat vowel is also predicted by a following approximant. These effects are phonetically attested in other studies of low vowel variation across varieties of English (e.g., Labov, Yaeger, & Steiner, Reference Labov, Yaeger and Steiner1972). The effect on F2 for preceding place is the most perplexing, in that cat preceded by either anterior (e.g., tan) or posterior (e.g., can) consonants is in both cases a fronter vowel than when preceded by nonlingual consonants (e.g., pan).
Best-fit lmer models of cat F1 and F2: Summary of level estimates

Note: Abbreviations as in Table 1 and the text. *p < .05, **p < .01, ***p < .001.
With respect to lexical set, start is significantly higher than trap, with no other significant differences in height between lexical sets (vis-à-vis trap). For F2, we see no difference between bath and trap, but do see a difference between proper Footnote 13 and trap and between start and trap. In the next section, we consider the complex issue of lexical set differences in an analysis of individual differences. The main takeaway from the group level analysis is that there is no evidence for accommodation toward a distinct bath vowel.
The three social factors in the analysis were Region, Class, and political Party. The only one achieving statistical significance in the F1 model is political party. A token of cat produced by a member of the SNP is predicted to be a lower vowel than one produced by a member of Labour (Table 3). The social factors predicting F2 variation are Region and Class, which support previous findings that cat is a fronter vowel in the West than in the East, and which introduces a new finding that cat is a fronter vowel among working-class speakers (and marginally the upper-middle-class speaker) than among (lower-) middle-class speakers. The social effects are all weaker than the linguistic effects, and in particular the mismatch between the class hierarchy and the anteriority of the cat vowel in this model suggests that all social factors warrant closer investigation.
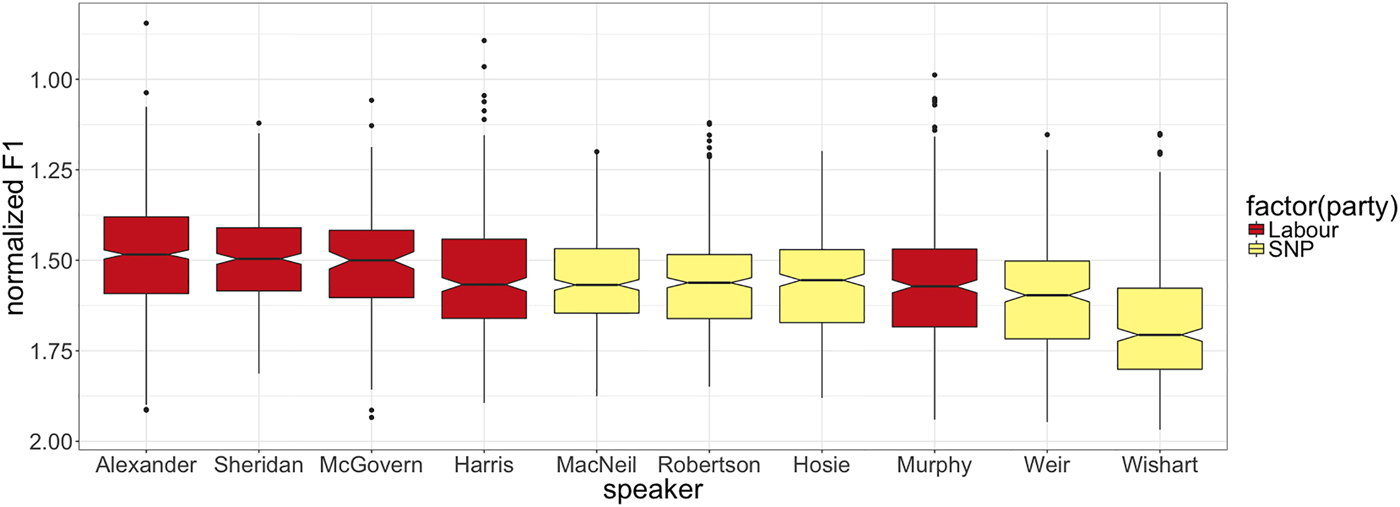
Figure 3 shows the distribution of the (reverse) mean F1 of the cat vowel by speaker, with individuals ranked from those with the highest vowel (Alexander) to those with the lowest vowel (Wishart). While the overall effect of political Party is suggestive, the differences between individuals are subtle. Harris and Murphy (Labour) appear to be essentially indistinguishable from MacNeil, Robertson, and Hosie (SNP). Half of the speaker set are not actually differentiated by political party. The effect of political party seems to be entirely driven by Alexander, Sheridan, and McGovern (Labour) on the one hand, and Weir and Wishart (SNP), on the other.
Individual MPs arranged by mean cat F1. Shading indicates political party (darker = Labour).

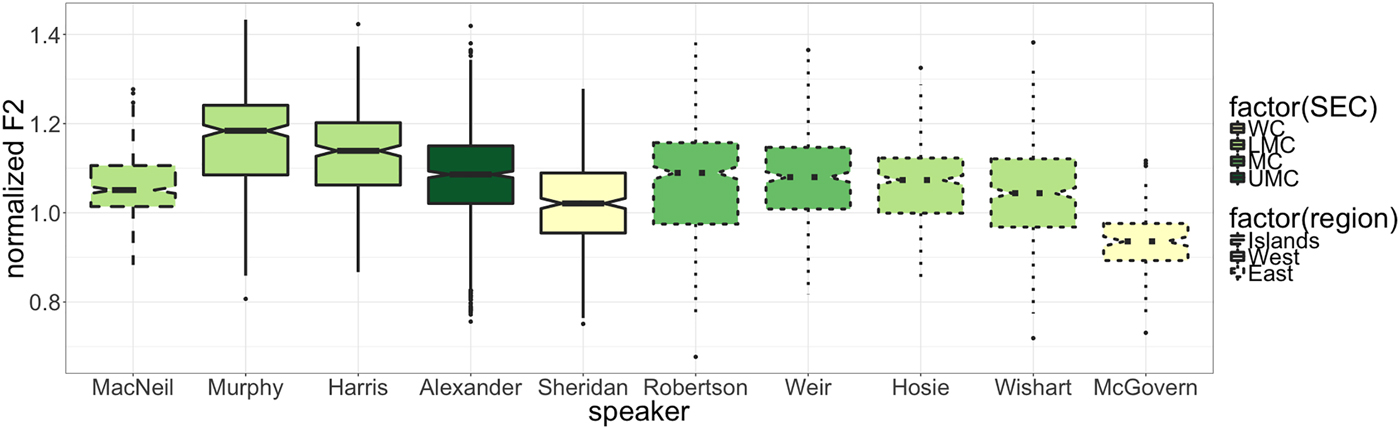
Figure 4 shows the distribution of mean cat F2 by speaker, with individuals organized by Region and then by Class. Group level effects again appear to be driven by a few individuals. The effect of region is largely driven by Murphy and Harris, who are from the West. The effect of social class is largely due to Sheridan and McGovern, the two working-class speakers. Note that both speakers are also key drivers of the political party effect for F1.
Individual MPs by mean cat F2, arranged by region. Color indicates socioeconomic class (lightest = WC; darkest = UMC). Line type indicates region (dash = Islands; solid = West; dotted = East).

Sheridan and McGovern, though hailing from different regions, share both political party and social class and produce the backest and, with the exception of Alexander, highest cat vowels. Murphy and Harris share regional, social class, and party affiliations and produce the frontest cat vowel, but one that is neither especially high nor low. Weir and Alexander might be considered most socially similar (both trained as lawyers, a profession whose members often demonstrate an influence of RP [Scobbie et al., Reference Scobbie, Hewlett, Turk, Foulkes and Docherty1999]), but they differ on political party and produce the second-lowest and the highest cat vowel, respectively (though one not especially front nor back). Those speakers who are middling in all cases are Hosie, Robertson, and MacNeil, who are all SNP members but who differ from one another in terms of region, social class, or both. Wishart has the lowest cat vowel, and he differs from the other nine MPs in, among other things, working both before and during his time as MP in a highly performative profession, as a musician in a Scottish Celtic folk/rock band.
DISCUSSION
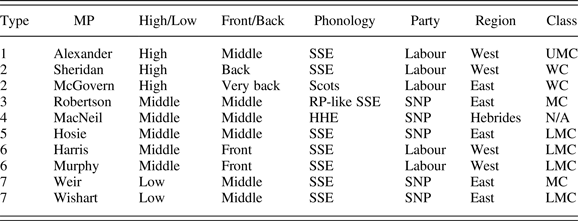
In the attempt to test for phonetic convergence toward RP and for the role of political party affiliation as a predictive social factor, we constructed a sample of middle-aged, white, male, Scottish politicians, and ended up with a small but highly heterogeneous sample encompassing multiple phonologies. Comparing each speaker with respect to the F1, F2, and lexical set dimensions of variation in the Scottish cat vowel (Table 4), there are at least seven different potential patterns (“types”) that can be identified.
Individual speakers by cat production patterns, phonological patterns, and speaker social factors

Note: “Type” does not imply ranking. Abbreviations as in Table 1 and the text.
The “middle” speakers (Robertson, MacNeil, Hosie) appear to be the most idiosyncratic: they produce neither very high nor very low, very front nor very back cat tokens, but they are differentiated according to properties of their lexical subsets. They are stylistically diverse and include the speaker who seems to have the most RP influence (Robertson) as well as the speaker of Hebridean English (MacNeil). Only 2 of the 10 speakers (Harris and Murphy) are matched on every phonetic, phonological, political, regional, and social class dimension, and even this is a bit surprising since one of them (Murphy) lived as a teenager in South Africa (suggesting that the non-Scottish influences were minimal, perhaps because while he moved geographically he moved with the Scottish influences of his family, and presumably after his Critical Period). One important point of contrast is between those two (who are type 6) and the type 7 speakers (Weir and Wishart); the former produce a fronted cat vowel, while the latter produce a lowered cat vowel. Socially, the former are Labour MPs from the Western region, while the latter are SNP MPs from the Eastern region.
Note that we can see here how the F1 correlations for political party are clearer than for social class and region. The type 1 speaker (Alexander) and the type 2 speakers (Sheridan and McGovern) represent opposite ends of the social class spectrum, and McGovern is from a different region from the other two, but all three produce the highest cat vowels, and all are Labour MPs. This pattern is part of the overall evidence suggesting that F1 variation in the cat vowel is an available or emerging index for political party identity. Results from regression modeling confirm this, as well as confirming that the relationship between F2 and Region (Johnston, Reference Johnston and Jones1997). We have complicated these findings with analyses at the individual level, and we now explore the possible reasons for why political Party might be indexed by vowel height, and why particular speakers might be more likely to orient to this indexicality in production than others.
Sociophonetic patterns may be broadly attributed to accommodation (which may or may not include social motivations) or identity work (which may or may not include accommodation). An asocial account of convergent patterns points to the variation in a speaker's social network and explains the speaker's production patterns with respect to statistical patterns of contact or exposure. A social account does the same, but it takes the explanation to include the social reasons for social network composition, plus the potential socioindexicality of variants, the social identity of speakers, and the general social context. An account of variation based on identity work relies on the identification of the field of social meanings that the variants index (Eckert, Reference Eckert2008), and an account of why a speaker would want to orient toward or away from those meanings, as well as whether they are capable of doing so and sanctioned to do so. While the data presented here do not allow us to definitively distinguish between these various possibilities, we suggest that some analyses are more reasonable than others.
A contact-only explanation is that MPs speak to others within their party more than to MPs of other parties (and there may be aspects of the way the Westminster Parliament operates that support this, for example physically going through separate division lobbies to vote, where there will be chance to speak to MPs voting the same way, therefore usually of the same party). Under this account, the Labour MPs in our sample who use a higher cat vowel may be doing so because other Labour MPs have a higher cat vowel. Assuming that RP/SSBE speakers, and other speakers of non-Scottish varieties, have a higher (in this case, trap) vowel than is typical among Scottish speakers, then this may be a reasonable analysis for our data. The Scottish Labour MPs in this study are part of a UK Labour Party and will have been participating in those UK-based structures (e.g., attending parliamentary Labour Party meetings), interacting with speakers who largely represent Southern British English varieties; this may be particularly true for an MP such as Alexander, a senior shadow cabinet minister at the time of data collection. That said, it is not possible to completely rule out an indexical analysis. The association within Scottish varieties between a higher cat vowel and a middle-class, conservative (not Conservative) persona (Johnston, Reference Johnston1984; Romaine, Reference Romaine1985) may suit the construction of a New Labour Party persona (at least in 2011–2012). Labour had been seen as developing its focus on the middle class under Tony Blair (Hassan & Shaw, Reference Hassan and Shaw2012). Kirkham and Moore (Reference Kirkham and Moore2016) demonstrated how former Labour Party leader Ed Miliband shows the greatest style-shifting (in terms of /t/-realization) in “New Labour keywords” such as Britain and government.
The contact-only explanation is not as useful for accounting for the SNP data. The SNP MPs have no such UK-wide party-internal structures to inform their social networks, and a meeting of the SNP MPs at Westminster at the time of data collection would have just required the five MPs studied here plus the one female SNP MP. The changes in party representation that followed the 2015 and 2017 general elections would allow for further testing in radically different contexts. We noted Lawson's (Reference Lawson2011) finding that a lower cat vowel indexed anti-institutional meaning at a microsocial level in a particular community in Scotland. The position of SNP MPs at the UK Parliament is inherently anti-institutional; the party's commitment to an independent Scotland requires that the UK Parliament should not be an institution of Scotland. SNP MPs may be further motivated to avoid the aforementioned class indexes of a higher cat vowel (Johnston, Reference Johnston1984; Romaine, Reference Romaine1985). For a party working to throw off its reputation as the “tartan Tories” and to gain ground in urban areas with younger, left-wing voters, the avoidance of the raised variant may be advantageous. In lowering the cat vowel, SNP politicians can be anti-institutional and can index alignment with new political personae.
If the social meaning of the cat vowel is a resource for constructing political persona, we would expect to see individual differences in speakers’ ability and motivation to adopt variants with political meanings. One factor to consider here is the performative nature of the speech we analyzed: televised speeches in the House of Commons. The three MPs who most carry the effect of political Party in our model of F1 are Alexander, Weir, and Wishart, and all have in common that their prepolitical professions have an element of high performance—for Alexander and Weir as lawyers, for Wishart as a Celtic folk/rock musician. The other seven speakers do not. Engagement in such performative contexts, and the personality characteristics that lead to that engagement, may predispose a speaker to attend to and exploit the indexical meanings of phonetic variants in their Parliamentary performances.
While one reason to study Scottish MPs is because they encounter strong pressures to accommodate linguistically, another is because the speech of politicians is an obvious place for exploring indexicality and political meaning. Although political identity is a prominent part of social life, we know relatively little about how it operates as a predictor of linguistic variation. A political identity is “a social identity with political relevance” (Huddy, Reference Huddy, Huddy, Sears and Levy2013:739), and while people vary in the strength of their political identification, elected politicians have careers that demand a public declaration of that identification. While individual politicians may appear more or less typical of their party, with some even becoming iconic of their party's identity (e.g., Margaret Thatcher representing the 1980s UK Conservatives [Janda, Harmel, Edens, & Goff, Reference Janda, Harmel, Edens and Goff1995]), party identification is generally more central to politicians’ public image and the composition of their social networks than for the average individual (McGraw, Reference McGraw, Sears, Huddy and Jervis2003). One could argue that there is little about a politician's speech that is not, in a way, political.
CONCLUSION
Even a superficially homogeneous speaker sample can display great individual-level and group-level variation. Trying to account for that variation through strictly automatic processes of convergence is not a straightforward task, even for speakers of a marked variety in a social context with the strong pressure to accommodate. Taking Scottish Members of UK Parliament as a test case, we argue against previous accounts of production patterns as reflecting “unconscious” and asocial accommodation. Rather, we find a suggestive main effect of political party, which potentially reflect both social network and social meaning differences between the two groups. Examining individual level differences has enriched our interpretation of the group-level effects, identifying particular individuals who appear to be driving those effects. Notwithstanding the complications of sampling from a phonologically diverse range of elected politicians, we argue that political party is a potentially rich social factor to include in studies of sociophonetic variation (Hall-Lew et al., Reference Hall-Lew, Coppock and Starr2010, Reference Hall-Lew, Starr, Coppock, Hernández-Campoy and Cutillas-Espinosa2012).
We take the perspective that any phonetic convergence among these speakers may be toward Scottish English norms just as much as toward RP/SSBE norms, and that it is more fruitful to acknowledge the ever present social factors that set the stage for contact-based accounts of that convergence, rather than treating contact as a primarily asocial, statistical phenomenon. We further posit an indexical analysis of what might be characterized as patterns of phonetic divergence, suggesting a range of stance-based and class-based meanings that take on political value in the context of Scottish MPs speaking as a minority group in the UK Parliament. These considerations seem necessary if the goal of sociophonetics research is to account for patterns of variation as completely as possible.
SUPPLEMENTARY MATERIAL
To view supplementary material for the article, please visit https://doi.org/10.1017/S0954394517000175.