1 Introduction
Many winged seeds, such as those of maples, exploit autorotation without an external source of energy, to decrease the descending velocity and increase the dispersal distance by the wind for their conservation of species (Norberg Reference Norberg1973; Augspurger Reference Augspurger1986; Seter & Rosen Reference Seter and Rosen1992b ; Nathan et al. Reference Nathan, Katul, Horn, Thomas, Oren, Avissar, Pacala and Levin2002). They have simple configurations without neuromuscular control for driving, as in animal flight (Norberg Reference Norberg1973), and even those with damaged wings can still autorotate (Varshney, Chang & Wang Reference Varshney, Chang and Wang2012). This means that autorotating seeds have a mechanically more robust design than the flapping or rotating-blade mechanism, and thus they motivate many researchers to develop micro air vehicles equipped with sensors for reconnaissance, munition and atmospheric research (see, for example, Jameson et al. (Reference Jameson, Fregene, Chang, Allen, Youngren and Scroggins2012) and Pandolfi & Izzo (Reference Pandolfi and Izzo2013)).
Experimental and theoretical studies have been conducted to explore the kinematic and dynamic characteristics of autorotating seeds (Norberg Reference Norberg1973; Augspurger Reference Augspurger1986; Azuma & Yasuda Reference Azuma and Yasuda1989; Rosen & Seter Reference Rosen and Seter1991; Seter & Rosen Reference Seter and Rosen1992a ,Reference Seter and Rosen b ; Yasuda & Azuma Reference Yasuda and Azuma1997; Nathan et al. Reference Nathan, Katul, Horn, Thomas, Oren, Avissar, Pacala and Levin2002; Lentink et al. Reference Lentink, Dickson, van Leeuwen and Dickinson2009; Varshney et al. Reference Varshney, Chang and Wang2012; Salcedo et al. Reference Salcedo, Treviño, Vargas and Martínez-Suástegui2013; Varshney, Chang & Wang Reference Varshney, Chang and Wang2013; Lee, Lee & Sohn Reference Lee, Lee and Sohn2014; Rao, Hoysall & Gopalan Reference Rao, Hoysall and Gopalan2014; Limacher & Rival Reference Limacher and Rival2015; Sunada et al. Reference Sunada, Ide, Hoshino and Okamoto2015; Lee & Lee Reference Lee and Lee2016). These seeds have low descending velocities (indicating high lift forces) because of their fast rotating motions in spite of their small wing areas but large seed weights (Norberg Reference Norberg1973; Azuma & Yasuda Reference Azuma and Yasuda1989). In general, autorotating seeds are considered to have an efficient flight mechanism compared to other flying types of seeds in view of descending velocity (Augspurger Reference Augspurger1986). To elucidate the mechanism of their high lift, flows around rotating seeds were measured using digital particle image velocimetry, where the rotating motion was a priori given or guided by a string due to the complexity of dynamic motions of autorotating seeds (Lentink et al. Reference Lentink, Dickson, van Leeuwen and Dickinson2009; Salcedo et al. Reference Salcedo, Treviño, Vargas and Martínez-Suástegui2013; Lee et al. Reference Lee, Lee and Sohn2014). Lentink et al. (Reference Lentink, Dickson, van Leeuwen and Dickinson2009) indicated that a strong spanwise flow on the wing of autorotating seeds prevents the leading-edge vortex from separating from the wing surface, and thus autorotating seeds attain high lift at periodic autorotation and remain in the air more effectively than non-autorotating seeds. They also computed the spanwise lift distribution from the sectional circulation obtained by integrating the vorticity within each wing section and showed that the sectional lift displays a maximum near 40–60 % span and decreases toward the wing tip. Comprehensive measurements were also performed to study the geometrical configurations of autorotating seeds and their flight performance for many different species (Norberg Reference Norberg1973; Azuma & Yasuda Reference Azuma and Yasuda1989; Salcedo et al. Reference Salcedo, Treviño, Vargas and Martínez-Suástegui2013; Lee et al. Reference Lee, Lee and Sohn2014), and showed a variety of geometric and kinematic characteristics among the species or even for the same species.
Studies have been conducted to explain the relations among the lift force, seed geometry and terminal descending velocity by employing the actuator-disk (axial-momentum) theory, and revealed that the terminal descending velocity is proportional to the square root of disk loading (seed weight divided by disk area) (Norberg Reference Norberg1973; Azuma & Yasuda Reference Azuma and Yasuda1989; Rao et al. Reference Rao, Hoysall and Gopalan2014). Although these studies provided a theoretical background for the dynamic behaviour of autorotating falling seeds, the effect of the leading-edge vortex, which is known as a key feature for high lift force generation, was not considered. Therefore, a more advanced theoretical approach including the effect of the leading-edge vortex is necessary to derive the scaling law for autorotating falling seeds.
The leading-edge vortex attached to the wing is a robust flow feature for both revolving and flapping wings due to the spanwise flow on the wing surface (Ellington et al.
Reference Ellington, van den Berg, Willmott and Thomas1996; Willmott, Ellington & Thomas Reference Willmott, Ellington and Thomas1997; Lentink et al.
Reference Lentink, Dickson, van Leeuwen and Dickinson2009), and thus it is reasonable to derive a scaling law for autorotating falling seeds as done for flapping insect wings. The classical potential theory works well for low angles of attack, but it fails to provide reliable force predictions when the angle of attack increases to the point where the leading-edge vortex plays a significant role. Thus, the Kutta condition has been applied to the leading edge as well as the trailing edge at high angles of attack to predict the behaviours of the leading- and trailing-edge vortices and time-varying force generation (Wang & Eldredge Reference Wang and Eldredge2013; Xia & Mohseni Reference Xia and Mohseni2013). To construct more reliable alternatives, researchers have suggested models for force prediction based on the potential theories together with relevant empirical approaches (Pitt Ford & Babinsky Reference Pitt Ford and Babinsky2013; Wong, Kriegseis & Rival Reference Wong, Kriegseis and Rival2013; Taha, Hajj & Beran Reference Taha, Hajj and Beran2014; Wang, Goosen & van Keulen Reference Wang, Goosen and van Keulen2016). Among them, Taha et al. (Reference Taha, Hajj and Beran2014) constructed an empirical model, capable of reasonable force and moment predictions, based on potential theory (extended lifting line theory). In that study, they employed an empirical model of the lift and drag coefficients suggested by Wang, Birch & Dickinson (Reference Wang, Birch and Dickinson2004) (
 $C_{L}=A\sin 2\unicode[STIX]{x1D6FC}$
and
 $C_{D}=B-C\cos 2\unicode[STIX]{x1D6FC}$
, where
 $\unicode[STIX]{x1D6FC}$
is the angle of attack, and
 $A$
,
 $B$
and
 $C$
are determined from measurements). On the other hand, Lee, Choi & Kim (Reference Lee, Choi and Kim2015) recently introduced a steady wing-vortex theory to derive a scaling law for the lift force of hovering insects, in which the strength of leading-edge vortex is scaled with the circulation around a wing and the lift force is modelled by the time derivative of vortical impulse. The scaling law derived agreed well with measured data of 35 species of insects, indicating that the steady wing-vortex theory captures an essential part of lift generation by hovering insects. In this study, it was assumed that the smooth flow-off condition (Kutta condition) still holds for hovering insects because the separating flow is confined around the leading-edge vortex and a smooth flow-off condition is recovered at the trailing edge (Birch & Dickinson Reference Birch and Dickinson2003). To support this assumption, they measured the circulation for translating flat plates at relatively high angles of attack (
 $25\sim 70^{\circ }$
) and showed that the steady wing-vortex theory is an appropriate model for flapping insect wings, even if flow separation occurs at the leading edge.
In the present study, we apply the steady wing-vortex theory (Lee et al. Reference Lee, Choi and Kim2015) to each wing section of autorotating falling seeds to obtain the sectional lift coefficient at terminal velocity and derive a scaling law for the lift force. To examine the validity of the results from the present theoretical approach, we perform an unsteady three-dimensional numerical simulation of flow around an autorotating seed (Acer palmatum) during free fall. The circulation and sectional lift coefficient predicted from the present approach are compared with those of the numerical simulation. Finally, we show that available data on various autorotating falling seeds fall on the scaling law derived. In appendix A, we show the derivation of the sectional lift coefficient using the actuator-disk theory. Its result is also compared with that from the numerical simulation.
2 Steady wing-vortex theory and scaling law
In this section, we consider a steady wing-vortex theory to derive a scaling law for the lift force of the autorotating seed at terminal velocity. In the steady wing-vortex theory, the strength of the leading-edge vortex (vortical strength) is scaled with the circulation around a wing and the lift force is modelled by the time derivative of the vortical impulse (Lee et al. Reference Lee, Park, Jeong, Cho and Kim2013, Reference Lee, Choi and Kim2015). In Lee et al. (Reference Lee, Choi and Kim2015), the strength of the leading-edge vortex, via the circulation around a three-dimensional wing, was scaled as
 $$\begin{eqnarray}\bar{\unicode[STIX]{x1D6E4}}\sim \bar{c}U_{\infty }\unicode[STIX]{x1D6EC}\sin \unicode[STIX]{x1D6FC}/(\unicode[STIX]{x1D6EC}+2),\end{eqnarray}$$
and its proportionality coefficient was found to be very close to
 $\unicode[STIX]{x03C0}$
(obtained experimentally for
 $\unicode[STIX]{x1D6FC}=25\sim 70^{\circ }$
), the value expected from conventional aerodynamics (Newman Reference Newman1977). Here,
 $U_{\infty }$
is the free-stream velocity,
 $\bar{c}$
is the mean chord length,
 $\unicode[STIX]{x1D6EC}$
is the wing aspect ratio and
 $\unicode[STIX]{x1D6FC}$
is the angle of attack. Then, since the pitch angles of autorotating falling seeds at terminal velocity are nearly zero (typically
 $-1\sim -2^{\circ }$
from Azuma & Yasuda (Reference Azuma and Yasuda1989); see also a movie in Lee & Choi (Reference Lee and Choi2017)), the sectional circulation of an autorotating seed,
 $\unicode[STIX]{x1D6E4}(r_{d})$
, having local chord length
 $c(r_{d})$
and angle of attack
 $\unicode[STIX]{x1D6FC}(r_{d})$
, can be written as:
 $$\begin{eqnarray}\unicode[STIX]{x1D6E4}(r_{d})=\unicode[STIX]{x03C0}cU\sin \unicode[STIX]{x1D6FC}=\unicode[STIX]{x03C0}cu_{T},\end{eqnarray}$$
where
 $U=\sqrt{u_{T}^{2}+r_{d}^{2}\unicode[STIX]{x1D714}_{T}^{2}}$
(local incoming velocity) and
 $\sin \unicode[STIX]{x1D6FC}=u_{T}/U$
(figure 1). This relation has been applied to estimate the lift force on rotating and flapping wings even at relatively high angles of attack (Dickinson, Lehmann & Sane Reference Dickinson, Lehmann and Sane1999; Birch, Dickson & Dickinson Reference Birch, Dickson and Dickinson2004; Kweon & Choi Reference Kweon and Choi2010; Lee et al.
Reference Lee, Choi and Kim2015).
Steady wing-vortex theory: schematic diagram of autorotating falling seed. Here,
 $u_{T}$
and
 $\unicode[STIX]{x1D714}_{T}$
are the terminal descending and rotating velocities,
 $R_{wt}$
is the wing span,
 $R_{d}=R_{wt}\cos \unicode[STIX]{x1D6FD}$
,
 $\unicode[STIX]{x1D6FD}$
is the coning angle,
 $r_{d}$
is the radial direction and
 $\unicode[STIX]{x1D6FC}$
is the angle of attack, respectively.

Three-dimensional seed model by scanning a maple seed (Acer palmatum). Here, the colours indicate the non-dimensional thickness (
 $t/\bar{c}$
) of the seed,
 $A_{w}$
is the wing planform area (area corresponding to
 $x_{r}\geqslant 0$
) and
 $\bar{c}(=A_{w}/R_{wt})$
is the mean chord length. (
 $x_{r},y_{r},z_{r}$
) are the coordinates in a non-inertial reference frame fixed to the centre of mass.

To estimate (2.2), we conduct an unsteady three-dimensional numerical simulation of flow around a freely falling maple seed. A three-dimensional seed model is obtained by scanning a maple seed (Acer palmatum), as shown in figure 2. We use an immersed boundary method in a non-inertial reference frame (Kim & Choi Reference Kim and Choi2006) fixed to the centre of mass for the simulation. The computational domain size is
 $-10\bar{c}\leqslant x_{r}\leqslant 10\bar{c}$
,
 $-10\bar{c}\leqslant y_{r}\leqslant 10\bar{c}$
,
 $-10\bar{c}\leqslant z_{r}\leqslant 10\bar{c}$
, and the number of grid points are
 $257\times 215\times 353$
in the
 $x_{r}$
,
 $y_{r}$
,
 $z_{r}$
directions, respectively. The Neumann boundary condition is used at whole boundaries, and the Reynolds and Froude numbers corresponding to the seed model are
 $Re=u_{g}\bar{c}/\unicode[STIX]{x1D708}=1171$
and
 $Fr=u_{g}/\sqrt{\bar{c}g}=20.1$
, respectively, where
 $\unicode[STIX]{x1D708}$
is the kinematic viscosity,
 $u_{g}(=\sqrt{(\unicode[STIX]{x1D70C}-1)\bar{c}g})$
is the characteristic velocity,
 $g$
is the gravitational acceleration and
 $\unicode[STIX]{x1D70C}(=\unicode[STIX]{x1D70C}_{s}/\unicode[STIX]{x1D70C}_{f})$
is the ratio of the solid to fluid (air) densities. More numerical details are given in Lee (Reference Lee2016).
Flow structure around the seed at terminal velocity in a non-inertial reference frame fixed to the rotating seed: instantaneous streamlines together with the contours of instantaneous spanwise velocity (
 $u_{xr}$
).

Figure 3 shows an instantaneous flow structure around the seed at terminal velocity in a non-inertial reference frame fixed to the rotating seed, showing the instantaneous streamlines together with the contours of instantaneous spanwise velocity. One can clearly observe a strong leading-edge vortex and high spanwise velocity toward the wing tip near the wing surface. This spanwise flow is known as a key feature of maintaining stable leading-edge vortex, and this vortex produces high lift (Birch & Dickinson Reference Birch and Dickinson2001; Lentink et al. Reference Lentink, Dickson, van Leeuwen and Dickinson2009; Limacher & Rival Reference Limacher and Rival2015). Therefore, we apply the steady wing-vortex theory for the present autorotating falling seed, because the spanwise flow near the wing surface keeps the leading-edge vortex nearly steady in time (Lentink et al. Reference Lentink, Dickson, van Leeuwen and Dickinson2009).
Comparison of the sectional circulation between the steady wing-vortex theory and present numerical simulation: (a) contours of the instantaneous spanwise vorticity (
 $\unicode[STIX]{x1D714}_{xr}$
) at four different spanwise locations; (b) sectional circulations of the leading-edge vortex. In (b), ▪ denotes data averaged over five rotation periods from the numerical simulation.

Figure 4(a) shows the contours of the instantaneous spanwise vorticity around the rotating wing at four different spanwise locations (
 $r_{d}/R_{d}$
= 0.2, 0.4, 0.6 and 0.8, respectively) from the present numerical simulation. The leading-edge vortex is clearly observed in this figure, which looks quite similar to that of Lentink et al. (Reference Lentink, Dickson, van Leeuwen and Dickinson2009). The circulation
 $\unicode[STIX]{x1D6E4}(r_{d})$
from the leading-edge vortex is computed at each spanwise location by integrating the positive spanwise vorticity (
 $\unicode[STIX]{x1D714}_{xr}>0$
) over the area encircled by
 $10\,\%$
of its maximum value, and is averaged over five rotation periods. The computed circulation is given in figure 4(b), together with the theoretical one (2.2), i.e.
 $\unicode[STIX]{x1D6E4}(r_{d})/\bar{c}u_{T}=\unicode[STIX]{x03C0}c/\bar{c}$
. As shown, the circulation predicted by (2.2) agrees well with that from the present numerical simulation, except for the region close to the centre of mass where the angle of attack is very large (nearly
 $90^{\circ }$
). This good agreement suggests that a stable, attached leading-edge vortex produces a circulation comparable to the bound circulation by the potential flow theory (Lee et al.
Reference Lee, Choi and Kim2015). We cannot provide a clear reason why this is the case, but, to the best of our knowledge, there exists no theory to explain this observation.
Now, we assume the planform of the seed to be elliptically shaped, and the chord length for the elliptical planform is expressed as
 $$\begin{eqnarray}c(r_{d})=\bar{c}\sqrt{1-\frac{4}{\left(1+R_{bd}\right)^{2}}\left[\frac{r_{d}}{R_{d}}-\left(\frac{1-R_{bd}}{2}\right)\right]^{2}},\end{eqnarray}$$
where
 $R_{bd}=R_{b}/R_{d}(=R_{ba}/R_{wt})\approx 0.33$
for the present seed (figure 2). Then, the total sectional vortical impulse during a rotating period is
 $\unicode[STIX]{x0394}M_{V}(r_{d})=\unicode[STIX]{x1D70C}_{f}\unicode[STIX]{x1D6E4}c~(2\unicode[STIX]{x03C0}\unicode[STIX]{x0394}r_{d})$
, and the sectional lift force exerted on the wing is obtained by the time derivative of vortical impulse,
 $\unicode[STIX]{x0394}F_{L}(r_{d})=\unicode[STIX]{x0394}M_{V}/T$
, where
 $T(=2\unicode[STIX]{x03C0}/\unicode[STIX]{x1D714}_{T})$
is the rotating period. Therefore, the sectional lift force
 $\unicode[STIX]{x0394}F_{L}(r_{d})$
and its non-dimensional coefficient
 $C_{L,S}(r_{d})$
can be expressed as
 $$\begin{eqnarray}\displaystyle & \displaystyle \unicode[STIX]{x0394}F_{L}(r_{d})=\unicode[STIX]{x03C0}\unicode[STIX]{x1D70C}_{f}\unicode[STIX]{x1D714}_{T}u_{T}c^{2}\unicode[STIX]{x0394}r_{d}, & \displaystyle\end{eqnarray}$$
 $$\begin{eqnarray}\displaystyle & \displaystyle C_{L,S}(r_{d})=\frac{\unicode[STIX]{x0394}F_{L}(r_{d})}{0.5\unicode[STIX]{x1D70C}_{f}U^{2}c\unicode[STIX]{x0394}r_{d}}=\frac{2\unicode[STIX]{x03C0}c~\unicode[STIX]{x1D714}_{T}}{u_{T}[(r_{d}/R_{d})^{2}\unicode[STIX]{x1D706}^{2}+1]}, & \displaystyle\end{eqnarray}$$
where
 $\unicode[STIX]{x1D706}=R_{d}\unicode[STIX]{x1D714}_{T}/u_{T}$
(tip-speed ratio).
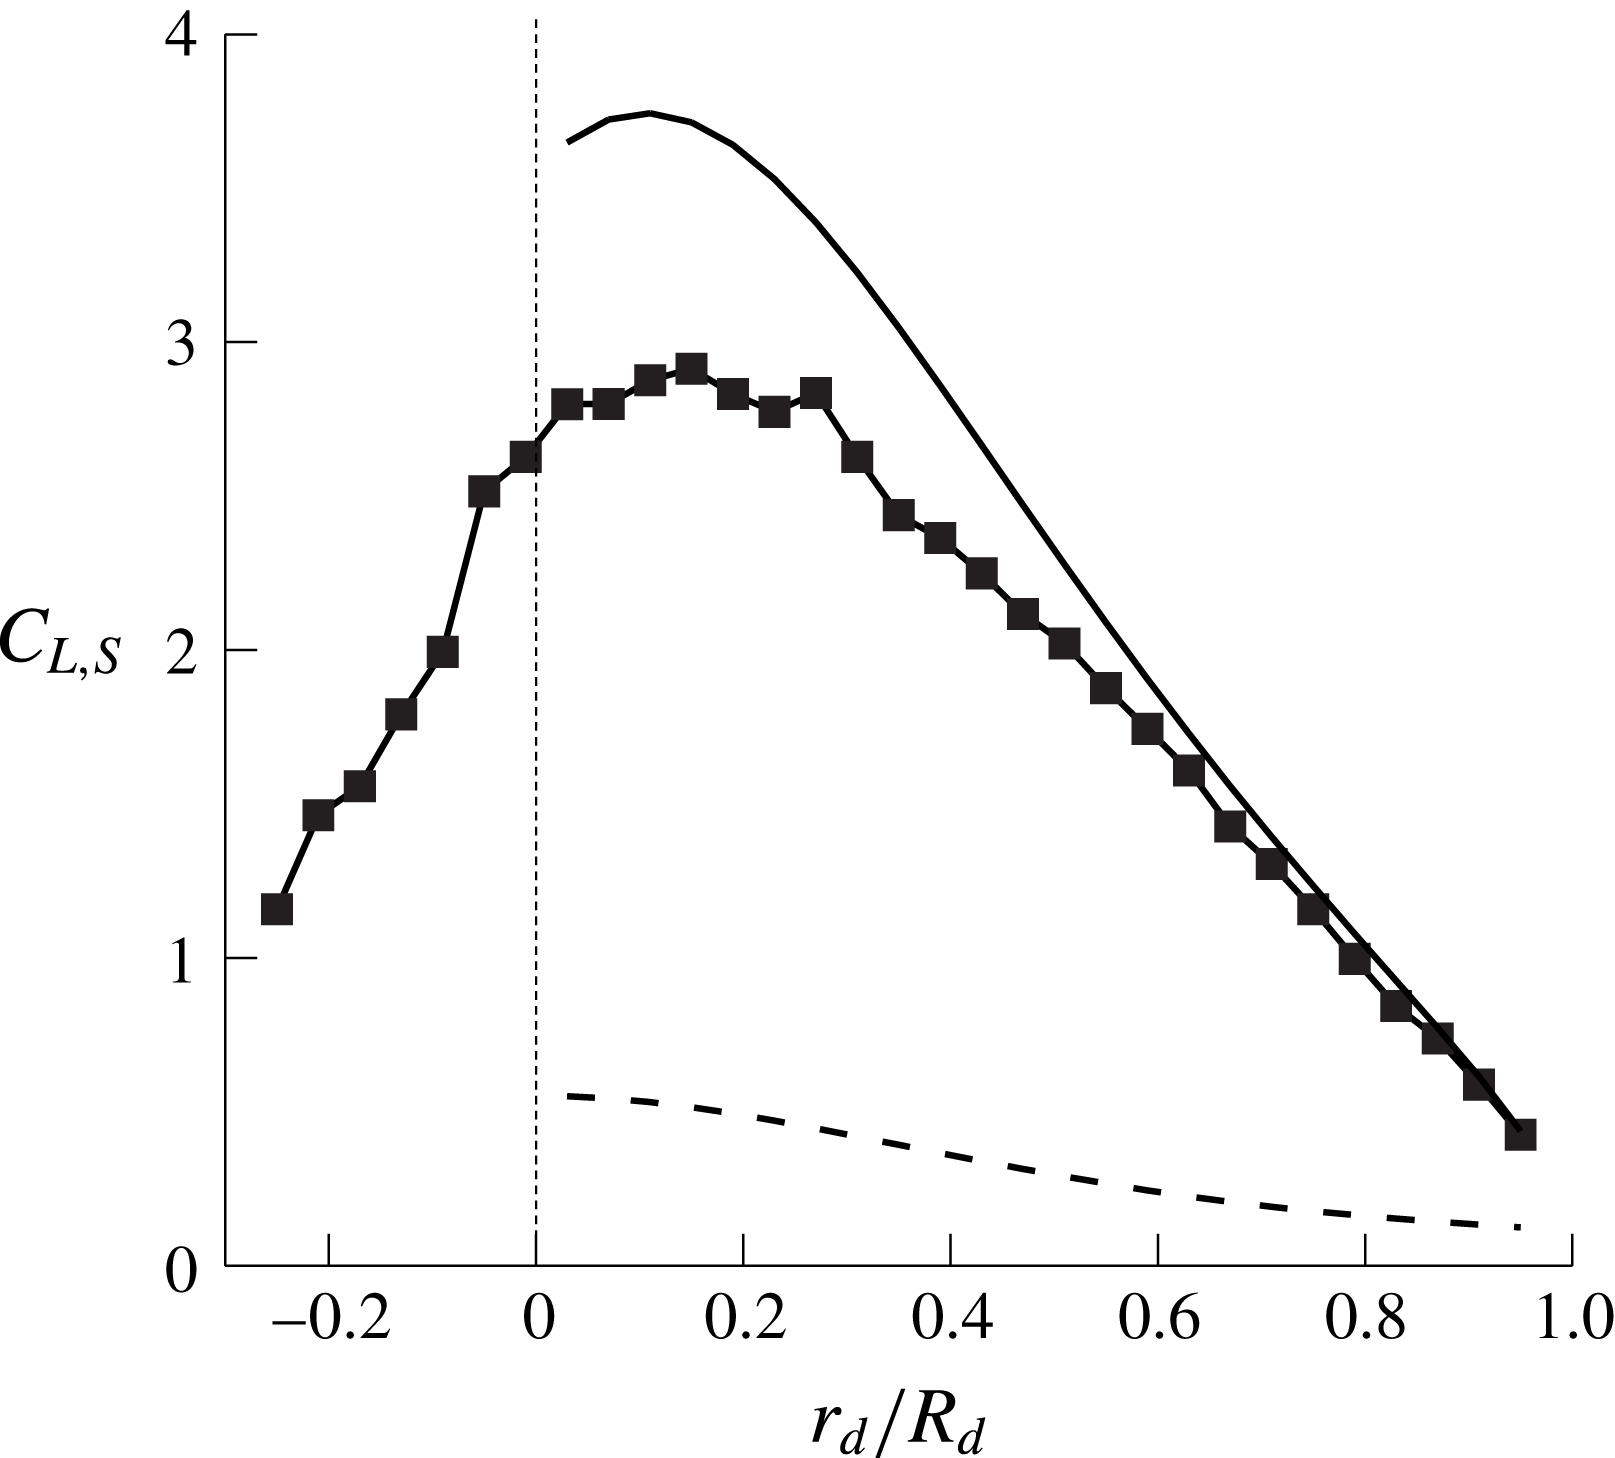
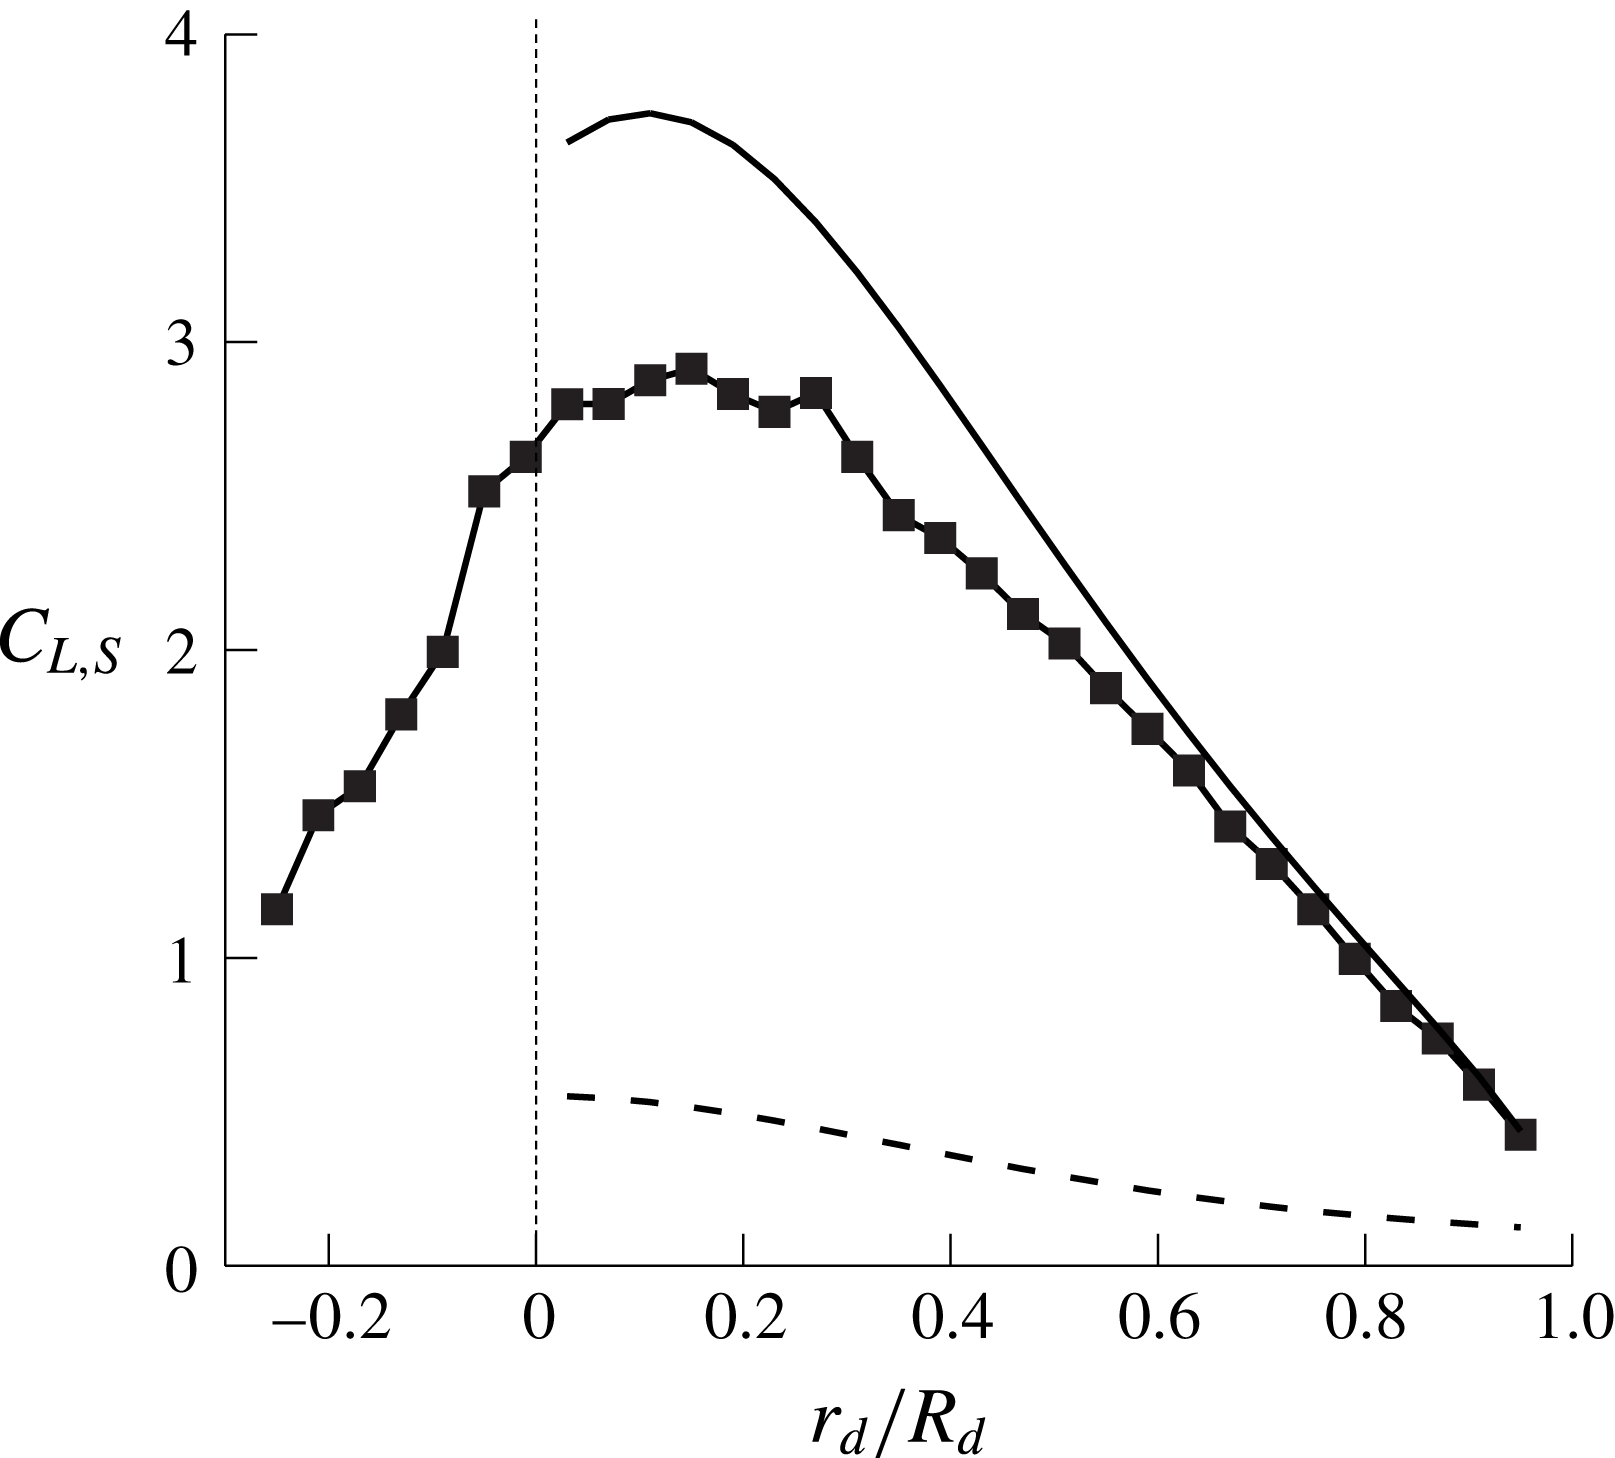
Figure 5 shows the radial distributions of the sectional lift coefficient
 $C_{L,S}(r_{d})$
on the wing obtained from the present numerical and theoretical approaches. Note from numerical simulation data that approximately
 $88\,\%$
of the total lift comes from the wing surface (i.e. from the centre of mass to wing tip),
 $C_{L,wing}(=L_{wing}/0.5\unicode[STIX]{x1D70C}_{f}u_{T}^{2}A_{d})=0.402$
, and only approximately
 $12\,\%$
comes from the nut,
 $C_{L,nut}(=L_{nut}/0.5\unicode[STIX]{x1D70C}_{f}u_{T}^{2}A_{d})=0.055$
(here, the lift is normalized by the terminal descending velocity and the disk area spanned by the rotating seed,
 $A_{d}=\unicode[STIX]{x03C0}R_{d}^{2}$
). As shown in this figure, the steady wing-vortex theory predicts the sectional lift coefficient quite well, indicating the validity of the scaling law (2.5). Note that the prediction by the steady wing-vortex theory is more accurate near the wing tip than near the centre of mass, because the angle of attack for the first (
 $\unicode[STIX]{x1D6FC}\approx 60^{\circ }$
) is much smaller than that for the latter (
 $\unicode[STIX]{x1D6FC}\approx 80\sim 90^{\circ }$
). In this figure, we also plot the results of the actuator-disk theory (see appendix A) which significantly underpredict the sectional lift coefficient. This underprediction by the actuator-disk theory seems to be caused by the fact that it does not consider the circulation from the stable leading-edge vortex (Lentink et al.
Reference Lentink, Dickson, van Leeuwen and Dickinson2009; Salcedo et al.
Reference Salcedo, Treviño, Vargas and Martínez-Suástegui2013; Limacher & Rival Reference Limacher and Rival2015).
By integrating (2.4) together with (2.3), a scaling law describing the relation among the lift force (same as the seed weight), seed geometry and terminal descending and rotating velocities is obtained as
 $$\begin{eqnarray}L_{T}=mg=\frac{(3R_{bd}+1)}{3(R_{bd}+1)^{2}}2\unicode[STIX]{x03C0}n\unicode[STIX]{x1D70C}_{f}\unicode[STIX]{x1D714}_{T}u_{T}R_{d}\bar{c}^{2},\end{eqnarray}$$
where
 $n$
is the number of wings of an autorotating seed, and
 $(3R_{bd}+1)/3(R_{bd}+1)^{2}\approx 0.375$
. The non-dimensional lift coefficient can be expressed as
 $$\begin{eqnarray}\frac{L_{T}}{0.5\unicode[STIX]{x1D70C}_{f}U^{2}(R_{d})R_{d}\bar{c}}=\frac{mg}{0.5\unicode[STIX]{x1D70C}_{f}U^{2}(R_{d})R_{d}\bar{c}}=\frac{(3R_{bd}+1)}{3(R_{bd}+1)^{2}}\frac{4\unicode[STIX]{x03C0}n}{AR\cos \unicode[STIX]{x1D6FD}}\frac{\unicode[STIX]{x1D706}}{(1+\unicode[STIX]{x1D706}^{2})},\end{eqnarray}$$
where
 $AR(=R_{wt}/\bar{c})$
is the aspect ratio of the seed wing. Here,
 $R_{bd}$
(
 $=R_{ba}/R_{wt}$
in figure 2) varies from seed to seed but does not have a significant effect on the result: e.g. the
 $R_{bd}$
values of autorotating seeds are
 $0.1\sim 0.2$
(Norberg Reference Norberg1973), which in turn provide only a small change in the value of
 $(3R_{bd}+1)/3(R_{bd}+1)^{2}(=0.358\sim 0.370)$
.
Seed weights (11 different species) versus (a) terminal descending velocity; (b) terminal rotating velocity; (c) scaling parameter in (2.6); (d) dimensionless seed weight versus the scaling parameter in (2.7). The symbols in this figure are from the present numerical study and previous experimental studies (Norberg Reference Norberg1973; Azuma & Yasuda Reference Azuma and Yasuda1989; Salcedo et al.
Reference Salcedo, Treviño, Vargas and Martínez-Suástegui2013; Lee et al.
Reference Lee, Lee and Sohn2014). Note that the Linden (
 $g$
in this figure) has two wings but only one wing actually rotates, so we use
 $n=1$
for this case. Dashed lines in (a) and (b) are from least-square fitting passing through
 $(mg,u_{T})=(0,0)$
and
 $(mg,\unicode[STIX]{x1D714}_{T})=(0,0)$
, respectively, and solid lines in (c) and (d) are from (2.6) and (2.7), respectively.

We compare the scaling law for the lift force (2.6) derived from the steady wing-vortex theory with the available data of autorotating seeds. Figure 6(a–c) shows the seed weight versus the terminal descending and rotating velocities, and the scaling law (2.6), respectively, together with the data of 11 different species of autorotating seeds (Norberg Reference Norberg1973; Azuma & Yasuda Reference Azuma and Yasuda1989; Salcedo et al.
Reference Salcedo, Treviño, Vargas and Martínez-Suástegui2013; Lee et al.
Reference Lee, Lee and Sohn2014). The seed data are widely scattered when their weights are plotted against the corresponding terminal descending and rotating velocities (figure 6
a,b). On the other hand, the seed data show excellent agreement with the scaling law derived using the steady wing-vortex theory (figure 6
c). The cases of
 $B$
and
 $h$
show some deviations from the scaling law, where the case of
 $h$
has four wings. Figure 6(d) shows the non-dimensional lift coefficient versus the scaling parameter in (2.7). It shows that most seed data follow the present scaling law very well, although two cases of
 $h$
and
 $B$
are far away from the scaling law. The reasons for these deviations are not clear at this moment, but one of them may be that the four rotating wings of
 $h$
may be affected by the wake of preceding wings much more than the single rotating wings of other seeds.
3 Conclusions
In the present study, a scaling law was suggested to describe the relation among the lift force, seed geometry and terminal descending and rotating velocities of autorotating seeds. To consider the circulation by stable leading-edge vortex (Lentink et al. Reference Lentink, Dickson, van Leeuwen and Dickinson2009), we employed a steady wing-vortex theory (Lee et al. Reference Lee, Choi and Kim2015) in which the vortical strength was scaled with the circulation around a wing and the lift force was obtained by the time derivative of vortical impulse. Assuming an elliptic wing planform, we derived the sectional lift coefficient from which a scaling law for the lift force of a seed was obtained. With this theory, the predicted sectional coefficient agreed well with that from present numerical simulation, validating the use of the steady wing-vortex theory. Available data of 11 species of autorotating falling seeds showed excellent agreement with the scaling law obtained, indicating that the present scaling law reasonably predicts the lift force of autorotating falling seeds at terminal velocity.
The scaling law obtained in this study involves the circulation from the leading-edge vortex and does not represent all the flow features observed in autorotating falling seeds. A future study may have to consider the circulations from the trailing-edge (see, for example, Pitt Ford & Babinsky (Reference Pitt Ford and Babinsky2013), Xia & Mohseni (Reference Xia and Mohseni2013)), wing-root and wing-tip vortices which dominate the wake behind the seeds (Lee & Choi Reference Lee and Choi2017).
Acknowledgement
This work was supported by the National Research Foundation through the Ministry of Science, ICT and Future Planning (no. 2016R1E1A1A02921549). We are also grateful for useful discussions with S. Oh.
Appendix A. Actuator-disk theory
As briefly described in the introduction, some studies have employed the actuator-disk theory to explain the relations among the lift force, seed geometry and terminal descending velocity. Norberg (Reference Norberg1973) employed the axial (linear) momentum theory and derived a relation of
 $mg\propto A_{d}u_{T}^{2}$
, where
 $m$
is the mass of the seed,
 $g$
is the gravitational acceleration,
 $A_{d}$
is the disk area spanned by the rotating seed and
 $u_{T}$
is the terminal descending velocity. Subsequently, an optimal model (a scaling law) of
 $mg=\unicode[STIX]{x1D70C}_{f}A_{d}u_{T}^{2}/2$
was suggested by requiring the axial velocity in far wake to be zero (Azuma & Yasuda Reference Azuma and Yasuda1989), which also provided a theoretical minimum descending velocity,
 $u_{T}=\sqrt{2mg/\unicode[STIX]{x1D70C}_{f}A_{d}}$
, of autorotating seeds. Here,
 $\unicode[STIX]{x1D70C}_{f}$
is the air density. Although these studies (Norberg Reference Norberg1973; Azuma & Yasuda Reference Azuma and Yasuda1989) provided a theoretical background for the dynamic behaviour of an autorotating falling seed, they did not consider the angular momentum conservation associated with the terminal rotating velocity, and the assumption of zero far-wake velocity in obtaining the optimal model violated mass conservation. Rao et al. (Reference Rao, Hoysall and Gopalan2014) measured the descending velocities of mahogany seeds and showed a discrepancy with the optimal model (Azuma & Yasuda Reference Azuma and Yasuda1989).
Schematic diagrams of an autorotating seed at periodic autorotation: (a) terminal descending and rotating velocities; (b) control volumes containing a rotating seed at a reference frame moving with the terminal descending velocity
 $u_{T}$
.
 $R_{d}$
and
 $r_{d}$
are the disk radius and radial direction, respectively, and
 $\unicode[STIX]{x1D6FD}$
is the coning angle.

We revisit the actuator-disk theory (Glauert Reference Glauert1935; Phillips Reference Phillips2002; Hunsaker & Phillips Reference Hunsaker and Phillips2013) to derive a scaling law for the lift force of an autorotating falling seed at terminal velocity. When a seed falls with autorotation, it reaches terminal descending and rotating velocities,
 $u_{T}$
and
 $\unicode[STIX]{x1D714}_{T}$
, respectively (figure 7
a). We consider a reference frame moving with
 $u_{T}$
(figure 7
b). Then, we apply the conservation of mass, linear and angular momentum and kinetic energy to the control volumes shown in figure 7(b). Note that previous studies (Norberg Reference Norberg1973; Azuma & Yasuda Reference Azuma and Yasuda1989; Rao et al.
Reference Rao, Hoysall and Gopalan2014) derived scaling laws for the lift force of autorotating seeds without considering the conservation of angular momentum and kinetic energy.
Assuming an inviscid flow before (inflow to 1) and after (2 to far wake) the disk (i.e. a rotating seed), we apply the Bernoulli’s equation to these regions:
 $$\begin{eqnarray}\displaystyle & \displaystyle \frac{p_{\infty }}{\unicode[STIX]{x1D70C}_{f}}+\frac{u_{T}^{2}}{2}=\frac{p_{1}}{\unicode[STIX]{x1D70C}_{f}}+\frac{u_{z1}^{2}+u_{r1}^{2}+u_{\unicode[STIX]{x1D703}1}^{2}}{2}, & \displaystyle\end{eqnarray}$$
 $$\begin{eqnarray}\displaystyle & \displaystyle \frac{p_{2}}{\unicode[STIX]{x1D70C}_{f}}+\frac{u_{z2}^{2}+u_{r2}^{2}+u_{\unicode[STIX]{x1D703}2}^{2}}{2}=\frac{p_{w}}{\unicode[STIX]{x1D70C}_{f}}+\frac{u_{zw}^{2}+u_{rw}^{2}+u_{\unicode[STIX]{x1D703}w}^{2}}{2}, & \displaystyle\end{eqnarray}$$
where
 $u_{z\,j}$
,
 $u_{rj}$
and
 $u_{\unicode[STIX]{x1D703}j}$
are the axial, radial and circumferential velocities, respectively,
 $p_{j}$
is the pressure and the subscript
 $j$
indicates each axial location (
 $i$
(inflow), 1, 2 or
 $w$
(far wake)). From the angular momentum conservation (
 $i$
to 1),
 $u_{\unicode[STIX]{x1D703}1}=0$
; from the continuity (1 to 2),
 $u_{z1}=u_{z2}$
; and from no lateral force on the disk,
 $u_{r1}=u_{r2}$
. At far wake, from the continuity and
 $r$
-momentum equation,
 $$\begin{eqnarray}u_{rw}=0\quad \text{and}\quad \frac{\text{d}p_{w}}{\text{d}r_{w}}=\unicode[STIX]{x1D70C}_{f}\frac{u_{\unicode[STIX]{x1D703}w}^{2}}{r_{w}}.\end{eqnarray}$$
The mass and angular momentum conservations for the control volume (2 to
 $w$
) provide
 $$\begin{eqnarray}r_{d}^{2}u_{z2}=r_{w}^{2}u_{zw}\quad \text{and}\quad r_{d}u_{\unicode[STIX]{x1D703}2}=r_{w}u_{\unicode[STIX]{x1D703}w}.\end{eqnarray}$$
Here we assume that the axial velocity component
 $u_{z\,j}$
varies only along the axial direction. Then, the pressure difference across the disk is obtained as
 $$\begin{eqnarray}\frac{p_{1}-p_{2}}{\unicode[STIX]{x1D70C}_{f}}=\frac{p_{\infty }-p_{w}}{\unicode[STIX]{x1D70C}_{f}}+\frac{u_{T}^{2}-u_{zw}^{2}}{2}+\frac{u_{\unicode[STIX]{x1D703}2}^{2}-u_{\unicode[STIX]{x1D703}w}^{2}}{2}.\end{eqnarray}$$
The integration of (A 5) over a disk area provides a lift force acting on the seed at periodic autorotation which should balance with the seed weight. To predict the lift force, the circumferential velocity at far wake,
 $u_{\unicode[STIX]{x1D703}w}(r_{w})$
, in (A 5) should be modelled. This velocity profile in the radial direction was modelled as a solid-body rotation in Hunsaker & Phillips (Reference Hunsaker and Phillips2013). To obtain a better model of this velocity distribution in the wake, we use the results from an unsteady three-dimensional numerical simulation of flow around a freely falling maple seed.
Time-averaged velocities in the wake and near the seed: (a) circumferential velocity profiles in the radial direction in the wake; (b) radial distribution of the induced velocity (
 $u_{T}-\bar{u}_{z2}$
) normalized by
 $u_{T}$
at the centre of mass (
 $z_{a}/R_{d}=0$
); (c) axial distribution of the induced velocity averaged over the disk area, ranging from centre of mass (
 $z_{a}/R_{d}=0$
) to wing tip (
 $z_{a}/R_{d}=0.175$
) of the seed.

Figure 8(a) shows the time-averaged circumferential velocity profiles in the radial direction at six different axial locations in the wake. As shown, the circumferential velocity first increases and then decreases in the radial direction. This velocity profile may be modelled with a Rankine vortex, i.e. a solid-body rotation within a core and an inviscid vortex outside:
 $$\begin{eqnarray}\displaystyle u_{\unicode[STIX]{x1D703}w}=\left\{\begin{array}{@{}ll@{}}\displaystyle r_{w}\unicode[STIX]{x1D714}_{w}\quad & \text{for }r_{w}<R_{wr},\\ \displaystyle \frac{R_{wr}^{2}\unicode[STIX]{x1D714}_{w}}{r_{w}}\quad & \text{for }r_{w}\geqslant R_{wr},\end{array}\right.\end{eqnarray}$$
where
 $\unicode[STIX]{x1D714}_{w}$
is the angular velocity at far wake and
 $R_{wr}\approx 0.6R_{d}$
(see figure 8
a). By integrating (A 3) for the pressure at the far wake with this Rankine vortex model (A 6), we obtain
 $$\begin{eqnarray}\frac{p_{\infty }-p_{w}}{\unicode[STIX]{x1D70C}_{f}}=\left\{\begin{array}{@{}ll@{}}\displaystyle \frac{\unicode[STIX]{x1D714}_{w}^{2}R_{wr}^{4}}{2}\left(\frac{2}{R_{wr}^{2}}-\frac{r_{w}^{2}}{R_{wr}^{4}}-\frac{1}{R_{w}^{2}}\right)\quad & \text{for }r_{w}<R_{wr},\\ \displaystyle \frac{\unicode[STIX]{x1D714}_{w}^{2}R_{wr}^{4}}{2}\left(-\frac{1}{R_{w}^{2}}+\frac{1}{r_{w}^{2}}\right)\quad & \text{for }r_{w}\geqslant R_{wr}.\end{array}\right.\end{eqnarray}$$
Substituting (A 7) into (A 5) provides (together with (A 4)):
 $$\begin{eqnarray}\frac{p_{1}-p_{2}}{\unicode[STIX]{x1D70C}_{f}}=\left\{\begin{array}{@{}l@{}}\displaystyle \frac{\unicode[STIX]{x1D714}_{w}^{2}R_{wr}^{4}}{2}\left[\frac{2}{R_{wr}^{2}}-\frac{u_{zw}}{u_{z2}}\frac{1}{R_{d}^{2}}-\left(2-\frac{u_{z2}}{u_{zw}}\right)\frac{u_{z2}}{u_{zw}}\frac{r_{d}^{2}}{R_{wr}^{4}}\right]+\frac{u_{T}^{2}-u_{zw}^{2}}{2}\quad \\ \displaystyle \qquad \qquad \text{for}\quad r_{d}<R_{wr}\sqrt{\frac{u_{zw}}{u_{z2}}},\quad \\ \displaystyle \frac{\unicode[STIX]{x1D714}_{w}^{2}R_{wr}^{4}}{2}\left(-\frac{u_{zw}}{u_{z2}}\frac{1}{R_{d}^{2}}+\frac{1}{r_{d}^{2}}\right)+\frac{u_{T}^{2}-u_{zw}^{2}}{2}\quad \text{for}\quad r_{d}\geqslant R_{wr}\sqrt{\frac{u_{zw}}{u_{z2}}}.\quad \end{array}\right.\end{eqnarray}$$
The lift force acting on the disk is obtained by integrating (A 8) over the disk area:
 $$\begin{eqnarray}\displaystyle L_{T} & = & \displaystyle \int _{0}^{R_{d}}(p_{1}-p_{2})2\unicode[STIX]{x03C0}r_{d}\,\text{d}r_{d}\nonumber\\ \displaystyle & = & \displaystyle \unicode[STIX]{x03C0}\unicode[STIX]{x1D70C}_{f}\left\{(u_{T}^{2}-u_{zw}^{2})\frac{R_{d}^{2}}{2}+\frac{\unicode[STIX]{x1D714}_{w}^{2}R_{wr}^{4}}{2}\left[\frac{1}{2}-\ln \left(\frac{R_{wr}^{2}}{R_{d}^{2}}\frac{u_{zw}}{u_{z2}}\right)\right]\right\}.\end{eqnarray}$$
On the other hand, the lift force on the disk can be obtained using the linear momentum conservation for the control volume (
 $i$
to
 $w$
; figure 7
b) together with (A 7):
 $$\begin{eqnarray}\displaystyle L_{T} & = & \displaystyle \int _{0}^{R_{w}}(p_{\infty }-p_{w})2\unicode[STIX]{x03C0}r_{w}\,\text{d}r_{w}-\int _{0}^{R_{w}}\unicode[STIX]{x1D70C}_{f}u_{zw}(u_{zw}-u_{T})2\unicode[STIX]{x03C0}r_{w}\,\text{d}r_{w}\nonumber\\ \displaystyle & = & \displaystyle \unicode[STIX]{x03C0}\unicode[STIX]{x1D70C}_{f}\left\{(u_{T}-u_{zw})u_{z2}R_{d}^{2}+\frac{\unicode[STIX]{x1D714}_{w}^{2}R_{wr}^{4}}{2}\left[\frac{1}{2}-\ln \left(\frac{R_{wr}^{2}}{R_{d}^{2}}\frac{u_{zw}}{u_{z2}}\right)\right]\right\}.\end{eqnarray}$$
Then, from (A 9) and (A 10), we obtain
 $$\begin{eqnarray}u_{z2}={\textstyle \frac{1}{2}}(u_{T}+u_{zw}).\end{eqnarray}$$
We also obtain the torque and power on the disk by applying angular momentum and kinetic energy conservation to the control volume (
 $i$
to
 $w$
), together with (A 7) and the Rankine vortex model (A 6):
 $$\begin{eqnarray}\displaystyle & \displaystyle T_{0}=\unicode[STIX]{x03C0}\unicode[STIX]{x1D70C}_{f}u_{zw}\unicode[STIX]{x1D714}_{w}R_{wr}^{4}\left(\frac{1}{2}-\frac{R_{d}^{2}}{R_{wr}^{2}}\frac{u_{z2}}{u_{zw}}\right), & \displaystyle\end{eqnarray}$$
 $$\begin{eqnarray}\displaystyle & P_{0}={\textstyle \frac{1}{2}}\unicode[STIX]{x03C0}\unicode[STIX]{x1D70C}_{f}R_{d}^{2}u_{z2}(u_{T}^{2}-u_{zw}^{2}). & \displaystyle\end{eqnarray}$$
Since
 $T_{0}\unicode[STIX]{x1D714}_{T}=P_{0}$
, we obtain the angular velocity at the far wake:
 $$\begin{eqnarray}\unicode[STIX]{x1D714}_{w}=-\frac{u_{T}^{2}-u_{zw}^{2}}{\unicode[STIX]{x1D714}_{T}R_{wr}^{2}[2-(R_{wr}^{2}/R_{d}^{2})(u_{zw}/u_{z2})]}.\end{eqnarray}$$
With (A 11) and (A 14), (A 9) becomes (the lift force is equal to the seed weight)
 $$\begin{eqnarray}L_{T}=mg=2\unicode[STIX]{x1D70C}_{f}a(1-a)A_{d}u_{T}^{2}\left[1+\frac{4a(1-a)}{(2-R_{rd}^{2}b)^{2}\unicode[STIX]{x1D706}^{2}}\left(\frac{1}{2}-\ln R_{rd}^{2}b\right)\right],\end{eqnarray}$$
where
 $R_{rd}=R_{wr}/R_{d}\approx 0.6$
(figure 8
a),
 $A_{d}(=\unicode[STIX]{x03C0}R_{d}^{2})$
is the disk area,
 $a(=1-u_{z2}/u_{T}=0.5(1-u_{zw}/u_{T}))$
is a model constant, called the axial induction factor,
 $b=(1-2a)/(1-a)=u_{zw}/u_{z2}$
and
 $\unicode[STIX]{x1D706}=R_{d}\unicode[STIX]{x1D714}_{T}/u_{T}$
(tip-speed ratio).
The sectional lift coefficient
 $C_{L,S}(r_{d})$
is frequently used during the development of wing shape with blade element theory. The sectional lift coefficient normalized by the local incoming velocity
 $U(r_{d})(=\sqrt{u_{T}^{2}+r_{d}^{2}\unicode[STIX]{x1D714}_{T}^{2}})$
and the local chord length
 $c(r_{d})$
is obtained from the pressure difference across the disk (A 8) as follows:
 $$\begin{eqnarray}\displaystyle C_{L,S}(r_{d}) & = & \displaystyle \frac{\unicode[STIX]{x0394}F_{L}(r_{d})}{0.5\unicode[STIX]{x1D70C}_{f}U^{2}c\unicode[STIX]{x0394}r_{d}}=\frac{p_{1}-p_{2}}{0.5\unicode[STIX]{x1D70C}_{f}U^{2}}\nonumber\\ \displaystyle & = & \displaystyle \frac{2}{U^{2}}\left\{\begin{array}{@{}l@{}}\displaystyle \frac{\unicode[STIX]{x1D714}_{w}^{2}R_{wr}^{4}}{2}\left[\frac{2}{R_{wr}^{2}}-\frac{b}{R_{d}^{2}}-\left(2-\frac{1}{b}\right)\frac{r_{d}^{2}}{bR_{wr}^{4}}\right]+2a(1-a)u_{T}^{2}\quad \\ \displaystyle \qquad \qquad \text{for}\quad r_{d}<R_{wr}\sqrt{b},\quad \\ \displaystyle \frac{\unicode[STIX]{x1D714}_{w}^{2}R_{wr}^{4}}{2}\left\{-\frac{b}{R_{d}^{2}}+\frac{1}{r_{d}^{2}}\right\}+2a(1-a)u_{T}^{2}\quad \\ \displaystyle \qquad \qquad \text{for}\quad r_{d}\geqslant R_{wr}\sqrt{b}.\quad \end{array}\right.\end{eqnarray}$$
The axial induction factor
 $a$
in (A 15) and (A 16) is unknown and is obtained from the present numerical simulation. Figure 8(b,c) shows the radial distribution of the time-averaged normalized induced velocity
 $(u_{T}-\bar{u}_{z2})/u_{T}$
at the centre of mass, and the axial distribution of the induced velocity averaged over disk area (1 to 2 in figure 7
b), respectively. By the volume averaging of the induced velocity from the centre of mass to wing tip, the axial induction factor is obtained to be
 $a=0.126$
, and thus
 $b=0.856$
. Also, from numerical simulation,
 $R_{rd}=0.6$
and
 $\unicode[STIX]{x1D706}=1.683$
. Then, the weight of the seed is predicted as
 $mg/0.5\unicode[STIX]{x1D70C}_{f}A_{d}u_{T}^{2}=0.481$
. This value agrees very well with the non-dimensional weight of present seed (Acer palmatum), 0.462. The value of
 $a=0.126$
obtained in the present study is much smaller than the optimal one
 $(a=0.5)$
corresponding to maximum lift assuming zero axial velocity at the far wake (Azuma & Yasuda Reference Azuma and Yasuda1989). As mentioned before, this assumption violates mass conservation, and thus
 $a=0.5$
is not realizable. Note that the axial induction factor can be obtained directly from the weight of the seed together with the geometric and kinematic information in (A 15), which is
 $a=0.121$
. This value is nearly the same as that obtained from the present numerical simulation
 $(a=0.126)$
, again showing the validity of the present numerical simulation. Note also that the magnitude of the second term in the square brackets on the right-hand side of (A 15) is calculated to be approximately 0.1 or less, and thus (A 15) should be very similar to that obtained by the actuator-disk theory without wake rotation, indicating that angular momentum conservation may not be required although it affects the magnitude of the terminal descending velocity.
The sectional lift coefficient (A 16) is compared with the present numerical result in figure 5, showing a poor agreement. This indicates that the actuator-disk theory is not an adequate model to predict the lift force of autorotating falling seeds.