Introduction
In efforts to create new management options for herbicide-resistant weeds, dicamba-resistant cotton and soybean have been developed. The adoption of this technology and the increased use of dicamba have greatly expanded the use of this herbicide, resulting in major concerns of injury potential and injury to sensitive crops from off-target movement (Jones et al. Reference Jones, Norsworthy, Barber, Gbur and Kruger2018). Dicamba can move off-target due to particle drift, volatilization, or through contamination from spray equipment (Behrens and Lueschen Reference Behrens and Lueschen1979; Egan et al. Reference Egan, Barlow and Mortensen2014; Mortensen et al. Reference Mortensen, Egan, Maxwell, Ryan and Smith2012). Many environmental factors, including temperature, humidity, and wind, can dictate the movement of spray droplets or volatility of an herbicide, including dicamba (Strachan et al. Reference Strachan, Ferry and Cooper2013). Auxin herbicides are difficult to remove from the plastic and rubber parts of commercial spray equipment (Steckel et al. Reference Steckel, Craig and Thompson2005). While evaluating dicamba retention of different sprayer-hose types, Cundiff et al. (Reference Cundiff, Reynolds and Mueller2017) reported a 7% to 19% yield reduction in soybean, depending on hose type. Boerboom (Reference Boerboom2004) reported 0.024% and 0.63% dicamba residue of the original concentration from a spray tank and boom, respectively, after a standard cleanout procedure that included an ammonia-water solution.
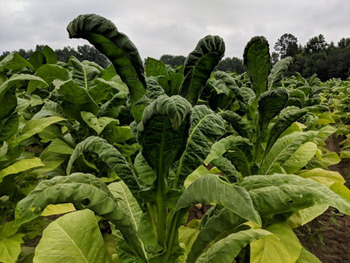
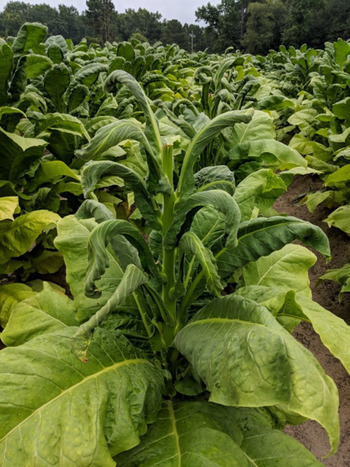
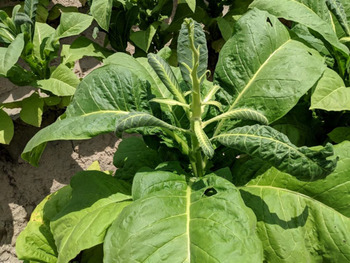
Low-doses of synthetic auxins are injurious to numerous crops, including soybean (Solomon and Bradley, Reference Solomon and Bradley2014), cotton (Johnson et al. Reference Johnson, Fisher, Jordan, Edmisten, Stewart and York2012), tomato (Solanum lycopersicum L.) (Bauerle et al. Reference Bauerle, Griffin, Alford, Curry and Kenty2015), and watermelon [Citrullus lanatus (Thunb.) Matsum. & Nakai] (Culpepper et al. Reference Culpepper, Sosnoskie, Shugart, Leifheit, Curry and Gray2018). Tobacco is sensitive to auxin herbicides from foliar and soil exposure. Typical symptomology of tobacco is described as downward cupping of leaves (Figure 1), epinastic leaf growth (Figure 2), and reduced leaf expansion with loss of apical dominance and abortion of meristem (Figure 3) in severe cases (Fung et al. Reference Fung, Belcher and Whitfield1973; Sheets and Worsham Reference Sheets and Worsham1991). In a simulated drift study, Lewis et al. (Reference Lewis, Hoyle, Fisher, Yelverton and Richardson2011) reported injury in flue-cured tobacco of up to 32% 12 wk after transplanting (WAT) from 0.31 g ae ha−1 (1/1,000 the labeled rate) of aminocyclopyrachlor. Klingman and Guedez (Reference Klingman and Guedez1967) reported no reduction in yield at one location and a 57% reduction in yield at another when picloram was applied pretransplant incorporated at 1.2 g ai ha−1. Although minimal, symptoms were observed when 0.025 g ha−1 picloram and 6.4 g ha−1 dicamba were applied pretransplant incorporated (Sheets and Worsham Reference Sheets and Worsham1991). Depending on environment, visual injury 2 wk after application (WAA) ranged from <5% to 40% and 10% to 95% when dicamba was applied 6 WAT at 0.6 and 11 g ha−1, respectively (Johnson Reference Johnson2011).
Example of downward cupping in flue-cured tobacco.

Example of epinastic leaf growth in flue-cured tobacco.

Example of reduced leaf expansion with loss of apical dominance and abortion of meristem in flue-cured tobacco.

North Carolina is the number one producer of flue-cured tobacco in the United States. In 2017, North Carolina growers harvested 65,990 ha, generating more than $720 million in production value, making it the most economically important crop in the state (NCDA&CS 2018). In tobacco-producing regions, soybean and cotton are regularly grown and often used as rotational crops. In 2018, approximately 55% and 56% of soybean and cotton planted in North Carolina were dicamba-resistant varieties, respectively (R.A. Vann, personal communication; USDA-AMS 2018). With trends in adoption rates associated with new technology, it is likely dicamba-resistant varieties will increase even more in coming years (Mortensen et al. Reference Mortensen, Egan, Maxwell, Ryan and Smith2012). Depending on the part of the state and tobacco-planting dates, dicamba applications in cotton and soybean can occur during all aspects of tobacco-plant development. The off-target movement of dicamba has great potential to affect the growth, development, and marketability of tobacco grown near fields where soybean and cotton are co-existing. Tobacco exhibiting injury symptoms and/or residues from nonlabeled pesticides can be considered nonmarketable by tobacco buyers. Furthermore, tobacco-farming operations using dicamba for dicamba-resistant soybean and cotton are at greater risk for equipment contamination. However, limited information exists on the exposure of flue-cured tobacco to off-target dicamba applications. The objectives for this study were to (1) document the contamination potential of dicamba in a spray tank following various rinse procedures; (2) compare contamination differences between dicamba formulations dimethylamine, diglycolamine, and N,N-Bis(3-aminopropyl)methylamine; and (3) evaluate the response of flue-cured tobacco to a single, foliar exposure event from dicamba applied early or late in the growing season.
Materials and Methods
Sprayer-Tank Cleanout Procedure
Tank cleanouts were performed in 2016, 2017, and 2018 to compare tank cleanout procedures and efficiency after the addition of the suggested use rate of three formulations of dicamba. Polyethylene vessels (9.5 L; ULINE, Braselton, GA) consistent with commercial sprayer equipment were used to evaluate each herbicide cleanout procedure. Dicamba products used were dimethylamine salt (Rifle; Loveland Products Inc., Greeley, CO), diglycolamine salt (Xtendimax; Monsanto Company, St. Louis, MO), and N, N-Bis-(aminopropyl) methylamine salt (Engenia; BASF, Research Triangle Park, NC). Cleaning agents consisted of water only, 5% ammonia solution, a commercial tank cleaner (All Clear; Loveland Products Inc.), or no rinse. Ammonia was used in a 1% v/v solution as suggested by Steckel et al. (Reference Steckel, Craig and Thompson2005). The tank cleaner was used as a 0.5%v/v solution as suggested by the manufacturer label for auxin herbicides. All water in the experiment was used from the same source and had a pH of 8.3.
At the experiment initiation, each spray tank was contaminated with 560 g ai ha−1 dicamba as a 140 L ha−1 solution in a 7.57-L mix, agitated for approximately 15 s, and allowed to sit for 24 h. After the incubation period, a 20-mL sample was collected from each tank to ensure contamination rates were similar. Each spray tank then underwent a triple-rinse cleanout procedure with water. Tank cleaners were added, with the second rinse cycle among treatments including ammonia or tank cleaner. Rinse times were approximately 15 s each and rinse volume was 10% of the original tank mix. After each rinse, a 20-mL sample was collected and analyzed to quantify dicamba residue. Simulating sprayer equipment use and cleanout, each tank was filled with water to a volume of 7.57 L, and a fourth sample was collected after the triple-rinse procedure.
Dicamba residue was quantified using high-performance liquid chromatography (HPLC)-diode array detector instrumentation (Agilent-1260 Infinity; Agilent Technologies, Inc., Wilmington, DE) by the Pesticide and Trace Element Environmental Fate and Behavior Laboratory at North Carolina State University. All reagents and solvents used for extraction and residue analysis were HPLC grade. Dicamba residue sample-preparation analysis was conducted as described by Fogarty et al. (Reference Fogarty, Traina and Tuovinen1994). Prior to injection, samples were centrifuged for 15 min at 3,500 rpm and then filtered using 0.45-µm nylon membrane. Analyte concentrations were quantified using peak area measurements (OpenLAB CDS ChemStation, version C.01.04; Agilent Technologies Inc.), and concentrations above the calibration curve were diluted and re-injected for analysis. Limits of quantification and detection were 0.156 and 0.05 mg L−1 (ppm), respectively. Standard solutions were included with each injection.
Fifteen treatments were evaluated for each herbicide. Treatments included: no rinse, one rinse, two rinses, three rinses, and a refill with each of the three cleaning agents. Three replications of each treatment were used in the experiment, with two runs per herbicide.
Field Experiment
Field studies were conducted in North Carolina at Oxford (36.3115°N, 78.6155°W), Kinston (35.3019°N, 77.5729°W), and Whiteville (34.4153°N, 78.7892°W) in 2018. Soils included a Helena sandy loam (fine, mixed, semi-active, thermic Aquic Hapludults), a Norfolk sandy loam (fine-loamy, kaolinitic, thermic Typic Kandiudults), and a Wagram loamy fine sand (loamy, kaolinitic, thermic Arenic Kandiudults) at those respective sites. Soil pH at all field sites ranged from 5.8 to 6.2 with less than 1% organic matter. Standard field preparation was performed before planting each year. Test sites were plowed, disked, and bedded approximately 3 wk prior to transplanting.
Tobacco was transplanted on May 14, April 30, and April 24 at Oxford, Kinston, and Whiteville, respectively. Individual plots contained three rows, each 3.4 m wide by 13.7 m long in Kinston and 3.6 m wide by 13.7 m at the other two locations. The center row of each plot was treated and used for data collection and harvest. The flue-cured tobacco cultivar NC 196 (Gold Leaf Seed Co., Hartsville, SC) was produced at all locations at a planting density of 14,820 plants ha−1. Tobacco at all sites was produced according to North Carolina Cooperative Extension Service recommendations throughout the duration of the study (Fisher, Reference Fisher2018).
Dicamba was applied at the following rates (g ae ha−1 [log g ae ha−1]): 0.056 (−1.25), 0.112 (−0.95), 0.224 (−0.65), 0.56 (−0.25), 1.12 (0.05), 2.24 (0.35), 5.6 (0.75), 28 (1.45), and 112 (2.05). Data for dicamba rates are presented hereafter as log g ae ha−1. Rates coincide with 1/5 to 1/10,000 of a labeled rate (560 g ae ha−1) and were derived from the tank cleanout data. A nontreated control was also included.
All herbicide rates were applied POST over-the-top at 7 or 11 WAT. Plant heights were approximately 76 cm with 14 leaves and 182 cm with 24 leaves at 7 and 11 WAT, respectively. Application timings were chosen to represent potential timings of POST applications of dicamba in dicamba-resistant soybean or cotton. All herbicide applications were applied using CO2-pressurized backpack sprayers equipped with TTI 110025 Turbo TeeJet® Induction nozzles (TeeJet Technologies, Wheaton, IL) delivering 140 L ha−1 at 165 kPa. Water used for the field experiments, at all locations, came from the same source as the tank cleanout experiment.
The experimental design was a randomized, complete block design with a factorial arrangement of nine dicamba rates and two application timings with three or four replications, depending on growing environment. Visual estimates of tobacco injury were recorded at 7, 14, and 24 days after application (DAA) for each application on a 0% to 100% scale (0%, no visible injury; 100%, complete plant death) derived from Lewis et al. (Reference Lewis, Hoyle, Fisher, Yelverton and Richardson2011). Plots were harvested four times in each growing environment and leaves were cured in a forced-air bulk-curing barn. Cured-leaf was then weighed to quantify yield and assigned a US Department of Agriculture government grade. Each government grade is associated with a numeric grade index value ranging from 1 to 100, which describes leaf maturity and ripeness (Bowman et al. Reference Bowman, Tart, Wernsman and Corbin1988) as well as an associated financial value that reflects modern price indices (Fisher, Reference Fisher2018). Composite cured leaf samples (50 g each) were also collected from each treatment for analysis of percent total alkaloids and percent reducing sugars using the methods outlined by Davis (Reference Davis1976).
Data for both the tank cleanout and field studies were checked for normality and homogeneity of variance by plotting residuals prior to statistical analyses. All data were subjected to ANOVA using the PROC Mixed procedure in SAS, version 9.4 (SAS Institute, Cary, NC). All data met model assumptions. Treatments were considered a fixed factor, and replication and environment were considered random factors. Treatment interactions containing replication or environment were set as random effects. Treatment means were reported using least square means. Means were separated using Fisher protected LSD at P ≤ 0.05. Field study data were further evaluated using linear and nonlinear regression models to determine relationships between herbicide rates and application timings. The linear regression analysis was chosen because they were the simplest models that properly described the data. Correlation analysis was conducted to determine the relationship between visual injury and tobacco quality, yield reduction, value reduction, total alkaloids, and reducing sugars.
Results and Discussion
Sprayer-Tank Cleanout
No significant interactions for dicamba formulation, number of rinses, or cleaning agent were observed when evaluating sprayer-tank cleanout efficiency (Table 1). Additionally, the main effect of formulation and cleaning agent did not modify dicamba retention in a sprayer tank. Therefore, data were analyzed across formulation and cleaning agent, and the main effect of rinse number is presented.
Probability and F values for dicamba tank-cleanout study conducted in North Carolina during 2016, 2017, and 2018.

Dicamba was recovered from all three rinses as well as from the refill treatment (Table 2). Dicamba retention decreased with each rinse; however, there was no difference between the third rinse and subsequent tank use. A single rinse removed approximately 80% of the initial 560 g ha−1 concentration. In contrast, Osborne et al. (Reference Osborne, Xu, Swanson, Walker and Farmer2015) reported that in all but three samples of dicamba and 2,4-D, 90% to 95% of the prerinse solution was removed from a single rinse. However, by the third rinse, greater than 95% of dicamba was removed relative to the initial concentration, similar to results of this study. Boerboom (Reference Boerboom2004) reported recovery of 0.021% of the original concentration of dicamba in subsequent tank use after standard cleanout procedure. In this study, dicamba recovered from a similar treatment was 0.006% of the original concentration. Differences across studies show the extreme variability that can occur during cleanout procedures and among various equipment types. Recovered amounts were minute; however, small amounts can be injurious to sensitive crops (Bauerle et al. Reference Bauerle, Griffin, Alford, Curry and Kenty2015; Culpepper et al. Reference Culpepper, Sosnoskie, Shugart, Leifheit, Curry and Gray2018; Johnson et al. Reference Johnson, Fisher, Jordan, Edmisten, Stewart and York2012; Solomon and Bradley Reference Solomon and Bradley2014).
Percent dicamba recovered from spray tanks by rinse and subsequent tank use following a labeled use rate.

a Means followed by the same letter are not significantly different at p ≤ 0.05. Data are pooled across formulations and cleaning agents.
b Tank was refilled with water to simulate subsequent tank use.
Flue-Cured Tobacco Response
The interaction of environment by rate by timing was significant (P ≤ 0.0001) for visual injury 7, 14, and 24 DAA. Additionally, the rate by timing interaction was significant for all environments (P ≤ 0.0001); therefore, this interaction is presented for each individual environment. Significant linear regressions were noted for all evaluation dates for both application timings across all three environments (Figures 4–6).
Tobacco injury 7, 14, and 24 d after application (DAA) at Oxford, NC, in response to dicamba rate and application timing. Regression expressions are as follows. Early application: 7 DAA, y = 36.78 + 25.95x; P ≤ 0.0001; r 2 = 0.96; 14 DAA, y = 43.25 + 24.62x; P ≤ 0.0001; r 2 = 0.95; and 24 DAA, y = 51.44 + 23.57x; P ≤ 0.0001; r 2 = 0.91. Late application: 7 DAA, y = 3.49 + 8.73x; P ≤ 0.0001; r 2 = 0.40; 14 DAA, y = 7.81 + 14.83x; P ≤ 0.0001; r 2 = 0.50; and 24 DAA, y = 11.29 + 14.09x; P ≤ 0.0001; r 2 = 0.45. Error bars represent 95% confidence intervals.

At Oxford, visual injury ratings ranged from 4% to 98% and 0% to 40% with early and late applications, respectively (Figure 4). On average, the early application was more injurious across all rates when compared with the late application. Rates of 1.45 log g ae ha−1 (1/20×) and higher, applied early, caused severe growth reduction and complete reduction of lateral leaf expansion in the upper stem region. By 24 DAA, visual injury increased to approximately 22% in the lowest evaluated rate (1/10,000×). With the late application, visual injury was not more than 33% in the highest rate across the three evaluation dates. Minimal differences were observed with rates of −0.65 log g ae ha−1 (1/2,500×) and lower when applied at the late application timing. At Kinston, visual injury ranged from 0% to 100% and 0% to 51% with the early and late application timings, respectively (Figure 5). The lowest rate, −1.25 log g ae ha−1 (1/10,000×), produced 13% visual injury with the early application. The highest two rates (1.45 and 2.05 log g ae ha−1) resulted in severe growth reduction, abortion of the meristem, and plant death in some cases. Rates higher than 0.05 log g ae ha−1 (1/500×) were required to produce greater than 10% visual injury within the late application. Across all three evaluation dates, minimal differences were noted within each rate with the late application. This can be attributed to the overall advanced maturity of the crop at the time of the late application. At Whiteville, injury ranged from 0% to 97% and 0% to 66% with the early and late application, respectively (Figure 6). In contrast to the other environments, greatest injury symptoms from the early application were achieved 14 DAA compared with 24 DAA across all rates. Growing conditions were optimal in this environment, resulting in rapidly growing plants. Abortion of the meristem was noted with rates of 1.45 log g ae ha−1 (1/20×) and higher. Differences in visual injury across environments are not uncommon. Johnson (Reference Johnson2011) reported visual injury on tobacco ranging from 10% to 90% within the same rate of dicamba across four environments.
Tobacco injury 7, 14, and 24 d after application (DAA) at Kinston, NC, in response to dicamba rate and application timing. Regression expressions are as follows, Early application: 7 DAA, y = 33.77 + 26.64x; P ≤ 0.0001; r 2 = 0.94; 14 DAA, y = 42.68 + 26.64x; P ≤ 0.0001; r 2 = 0.86; and 24 DAA, y = 47.67 + 27.35x; P ≤ 0.0001; r 2 = 0.93. Late application: 7 DAA, y = 6.18 + 14.59x; P ≤ 0.0001; r 2 = 0.48; 14 DAA, y = 8.38 + 19.06x; P ≤ 0.0001; r 2 = 0.56; and 24 DAA, y = 9.22 + 20.61x; P ≤ 0.0001; r 2 = 0.58. Error bars represent 95% confidence intervals.

Tobacco injury 7, 14, and 24 d after application (DAA) at Whiteville, NC, in response to dicamba rate and application timing. Regression expressions are as follows. Early application: 7 DAA, y = 19.81 + 18.06x; P ≤ 0.0001; r 2 = 0.87; 14 DAA, y = 38.25 + 28.22x; P ≤ 0.0001; r 2 = 0.97; and 24 DAA, y = 37.84 + 28.64x; P ≤ 0.0001; r 2 = 0.98. Late application: 7 DAA, y = 3.62 + 5.16x; P ≤ 0.0001; r 2 = 0.49; 14 DAA, y = 10.19 + 18.36x; P ≤ 0.0001; r 2 = 0.64; and 24 DAA, y = 14.75 + 25.07x; P ≤ 0.0001; r 2 = 0.69. Error bars represent 95% confidence intervals.

A significant environment by rate by timing interaction (P = 0.0155) was observed for percent yield reduction. At Oxford and Kinston, percent yield reductions were influenced by the rate and timing of application interaction (P = 0.0185 and <.0001, respectively). At Whiteville, the rate by timing interaction was not significant (P = 0.4460) and percent yield reductions were only influenced by the main effect of rate (P = 0.0276).
At Oxford, significant linear regressions were noted for both application timings (Figure 7), with all dicamba rates causing significant yield reductions. The highest rate caused a 47% and 28% yield reduction when applied at the early and late timings, respectively. Rates of −0.65 log g ae ha−1 (1/2,500×) and lower provided similar reductions (15% and 19%) in yield across both application timings, respectively. There was a 16% difference between the highest and lowest rate in yield reductions with the later application timing. At Kinston, a significant linear regression was noted for the early application (Figure 8). A 62% yield reduction was observed with the highest rate in this environment. Yield reductions were less than 10% with rates of −0.95 and −1.25 log g ae ha−1 (1/5,000× and 1/10,000×). On average, there was an approximate 23% yield reduction across all rates with the late application, with no differences among rates. At Whiteville, percent yield reduction was not affected by timing of dicamba application (Figure 9). Significant yield reductions were observed across all rates and ranged from 11% to 28%. There were no differences with rates lower than −0.65 LOG g ae ha−1 (1/2,500×). It is plausible that favorable growing conditions in this environment allowed for plant recovery compared with the other environments. Although injury trends were similar with higher rates across environments, there was wide variability in how the observed injury translated to yield reductions.
Percent tobacco yield reduction at Oxford, NC, in response to dicamba rate and application timing. Regression expressions are as follows. Early application: y = 26.05 + 10.31x; P ≤ 0.0001; r 2 = 0.41. Late application: y = 18.05 + 4.68x; P = 0.0341; r 2 = 0.13. Error bars represent 95% confidence intervals. Nontreated control total yield: 4,460 and 4,210 kg ha−1, early and late applications, respectively.

Percent tobacco yield reduction at Kinston, NC, in response to dicamba rate and application timing. Regression expressions are as follows. Early application: y = 24.72 + 18x; P ≤ 0.0001; r 2 = 0.45. Late application: y = 22.22 + 3.36x; P = 0.1860; r 2 = 0.05. Error bars represent 95% confidence intervals. Nontreated control total yield: 2,530 and 2,815 kg ha−1, early and late applications, respectively.

Percent tobacco yield reduction at Whiteville, NC, in response to dicamba rate. Regression expression: y = 17.77 + 5.19x; P = 0.0018; r 2 = 0.17. Error bars represent 95% confidence intervals. Nontreated control total yield: 4,320 kg ha−1. Data are pooled over application timing.

The interaction of environment by rate by timing was significant (P = 0.0019) for percent value reduction. Although the rate and timing interaction was significant (P = 0.0153) at Oxford, trends among application timing were similar (Figure 10). For both timings, as herbicide rate increased, percent value reduction increased. Maximum value reductions were 40% and 36% for the early and late timing, respectively. There was no difference between timings among any rate. Similarly, the interaction of rate and timing (P = 0.0007) influenced value reduction at Kinston (Figure 11). With the early application, value reductions ranged from 11% to 59%, linearly increasing as herbicide rate increased. Similar to yield, there were no differences in value reductions across rates with the late application. Plants were near or at physiological maturity, and plant growth had ceased prior to the late application. At Whiteville, neither the interaction (P = 0.3909) nor main effects of herbicide rate (P = 0.0640) nor application timing (P = 0.7508) were significant. However, a significant linear regression was noted for value reduction (Figure 12). Value reductions ranged from 12% to 34%. Previous research has shown no difference in value when dicamba was applied 3–7 days prior to harvest at 224 and 448 g ai ha−1 (Seltmann et al. Reference Seltmann, Sheets, Campbell and Quick1989).
Percent tobacco value reduction at Oxford, NC, in response to dicamba rate and application timing. Regression expressions are as follows. Early application, y = 25.97 + 6.92x; P = 0.0060; r 2 = 0.20; Late application, y = 22.15 + 6.66x; P = 0.0090; r 2 = 0.18. Error bars represent 95% confidence intervals. Nontreated control value: $16,050 and $16,405 ha−1, early and late applications, respectively.

Percent tobacco value reduction at Kinston, NC, in response to dicamba rate and application timing. Regression expressions are as follows. Early application: y = 29.26 + 14.46x; P = 0.0008; r 2 = 0.29. Late application: y = 26.67 + 1.09x; P = 0.6853; r 2 = 0.01. Error bars represent 95% confidence intervals. Nontreated control value: $8,650 and $9,840 ha−1, early and late applications, respectively.

Percent tobacco value reduction at Whiteville, NC, in response to dicamba rate. Regression expression: y = 20.03 + 6.67x; P = 0.0009; r 2 = 0.19. Error bars represent 95% confidence intervals. Nontreated control value: $16,125 ha−1. Data are pooled over application timing.

Cured-leaf quality was not affected by the interaction (P = 0.2774) or main effects of herbicide rate (P = 0.2974) and application timing (P = 0.1512; data not shown). Johnson (Reference Johnson2011) reported a reduction in quality in two of four environments with the highest rate of dicamba (140 g ae ha−1) only. Seltmann et al. (Reference Seltmann, Sheets, Campbell and Quick1989) reported no reductions in cured-leaf quality when dicamba was applied to plants 3–7 days before harvest at 224 or 448 g ae ha−1. Total alkaloids were slightly increased with the early application compared with the late application at Whiteville and Oxford; no difference was observed at Kinston (Table 3). Previous work has shown an increase in nicotine content when an auxin herbicide was applied to tobacco compared with the nontreated (L.R. Fisher, personal communication). However, many factors can influence nicotine production, including environmental conditions, management practices, and overall plant stress (Bush Reference Bush, Layten and Nielsen1999). These data show maximum nicotine production can be obtained in more favorable environments. Reducing sugars were not altered regardless of herbicide rate, timing, or environment (data not shown).
Percent total alkaloids in response to dicamba application timing.

a Abbreviation: WAT, weeks after transplanting.
b Means followed by the same letter are not significantly different at P ≤ 0.05. Data are pooled across dicamba rate.
The correlation analysis confirmed significance between visual injury and percent yield reduction (Table 4). Pearson correlation coefficients ranged from 0.28 to 0.63, depending on application timing and injury assessment timing. Visual injury with the early application timing was a stronger indicator of potential yield loss when compared with the late application; however, this prediction indicator is moderate at best. The relationship between visual injury and leaf quality was significant for the early application; however, low coefficient values showed this was an inconsistent trend. Value reduction in response to visual injury was significant for both application timings. Similar to yield, visual injury from the early application is a moderate to poor indicator of value reduction. Trends with reducing sugars showed a negative impact with the early application timing; however, correlation values were poor. There was no significant relationship with total alkaloids and visual injury at either application timing. In previous research, Johnson (Reference Johnson2011) observed similar relationships between early injury symptoms from dicamba and yield and quality of flue-cured tobacco.
Pearson correlations for tobacco quality, yield reduction, value reduction, total alkaloids, and reducing sugars in response to visual injury 7, 14, and 24 DAA by application timing.

a Abbreviation: DAA, days after application.
Practical Implications
Results from these studies show the importance of spray-equipment cleaning efficiency when using dicamba. Regardless of dicamba formulation and additional cleaning agents, rinse frequency is the most important factor in removing dicamba residue from a spray tank. Dicamba concentrations collected from the three rinses resulted in significant injury and yield reductions. The drastic decline in dicamba concentration between the third rinse and the subsequent tank-use refill suggests more rinses could be warranted after dicamba use. Although not quantified in this study, it can be argued that these data are a best-case scenario because the spray tank was the only equipment evaluated. It has been documented that herbicide residue can stick or become trapped in a variety of places within a sprayer system, with the potential of the plumbing (eg, hoses, pumps, screens) being the most difficult to clean because of the lack of access (Cundiff et al. Reference Cundiff, Reynolds and Mueller2017; Whitford et al. Reference Whitford, Nowaskie, Young, Foreman, Spradley, Walker, Becovitz, Obermeyer, Reynolds, Johnson and Leigh Smith2015). Additionally, water was used as a subsequent tank-use refill as opposed to an herbicide such as glyphosate, which is efficient at removing residue from internal spray parts (Steckel et al. Reference Steckel, Craig and Thompson2005). These data show the sensitivity of flue-cured tobacco to dicamba.
Tobacco injury and plant response varied greatly across environments. This is common among other crops because variability in response to auxin herbicides are highly dependent on many environmental factors (Egan et al. Reference Egan, Barlow and Mortensen2014; Leon et al. Reference Leon, Ferrell and Brecke2014). In general, the early timing was more injurious than the later application timing, which was not surprising, because plants were near physiological maturity at the later application timing. Maturity of leaf tissue can greatly affect the sensitivity and response of a tobacco plant exposed to an auxin herbicide (White and Hemphill Reference White and Hemphill1972). Furthermore, differences in plant stresses and management factors can greatly affect leaf maturity and ripening as well as the timing of harvest of tobacco. Because of the variable response of plants exposed to auxin herbicides, predictions of yield and value reductions are inconsistent. Yield reductions were not always apparent; however, visual symptoms are cause for a crop to be rendered unmarketable and deemed a total loss. However, this information can aid decision-making for growers and advisors after an herbicide exposure event. To address other herbicide technology concerns, more research is needed to evaluate flue-cured tobacco response to 2,4-D. Furthermore, evaluation of crop response across a greater range of tobacco growing areas would be of value.
Acknowledgments
Great appreciation is extended to the North Carolina Tobacco Research Commission for funding this research. Thanks to the staff at the Oxford Tobacco Research Station, Lower Coastal Plain Research Station, and Border Belt Research Station for their assistance in maintaining research plots. No conflict of interest has been declared.