Introduction
Deficits in visuospatial attention have long been associated with right hemisphere brain injury (Albert, Reference Albert1973; Bartolomeo, Reference Bartolomeo2014; Leibovitch et al., Reference Leibovitch, Black, Caldwell, Ebert, Ehrlich and Szalai1998). However, recent functional neuroimaging findings in healthy adults suggest that perisylvian networks in both hemispheres are involved in spatial attention and exploration (Corbetta & Shulman, Reference Corbetta and Shulman2011; Hopfinger, Buonocore, & Mangun, Reference Hopfinger, Buonocore and Mangun2000; Suchan et al., Reference Suchan, Umarova, Schnell, Himmelbach, Weiller, Karnath and Saur2014). Although functional imaging cannot dictate the necessity of regions for a given function, there have also been reports of hemineglect or perceptual bias following left hemisphere brain injury (Beis et al., Reference Beis, Keller, Morin, Bartolomeo, Bernati, Chokron and Azouvi2004; Kleinman et al., Reference Kleinman, Newhart, Davis, Heidler-Gary, Gottesman and Hillis2007; Ogden, Reference Ogden1987; Suchan, Rorden, & Karnath, Reference Suchan, Rorden and Karnath2012; Woods et al., Reference Woods, Mennemeier, Garcia-Rill, Meythaler, Mark, Jewel and Murphy2006). Nonetheless, the severity and chronicity of attentional deficits that are observed after left hemisphere injury is still heavily debated, with many studies reporting less severe or more transient deficits after left hemisphere injury (Albert, Reference Albert1973; Behrmann, Ebert, & Black, Reference Behrmann, Ebert and Black2004; Gainotti, Messerli, & Tissot, Reference Gainotti, Messerli and Tissot1972; List et al., Reference List, Brooks, Esterman, Flevaris, Landau, Bowman and Schendel2008; Ogden, Reference Ogden1987). Thus, there is currently poor consensus on the role of the left hemisphere in visuospatial attention.
The stronger association of visuospatial deficits with right brain injury has been associated with a greater incidence of clinical hemineglect following right hemisphere injury. This has been hypothesized to be due to a greater specialization of the right hemisphere for distributing attention across both visual hemifields, while the left hemisphere demonstrates greater specialization for language and directing attention toward the right side of space (Kinsbourne, Reference Kinsbourne1977; Mesulam, Reference Mesulam1981). This has been followed by neuroimaging reports of right hemisphere dominance of structures making up a ventral attention network (VAN) that appear to be specialized for target detection and attentional re-orienting in both visual fields (Shulman et al., Reference Shulman, Pope, Astafiev, McAvoy, Snyder and Corbetta2010). However, few behavioral studies have specifically targeted patients with language impairments whose lesions likely encompass similar regions within the left hemisphere.
Of interest, both hemispheres are thought to contain a dorsal attention network for directing attention to features on the opposite side of space (Corbetta & Shulman, Reference Corbetta and Shulman2002). Thus, disruption of this network in either hemisphere should create an imbalance of attention. However, the degree to which left hemisphere injury also produces a lateralized attentional impairment has been somewhat controversial owing to the wide range of tests used, chronicity at the time of assessment, and the degree to which aphasic patients have been included in such assessments (Kleinman et al., Reference Kleinman, Newhart, Davis, Heidler-Gary, Gottesman and Hillis2007; Ogden, Reference Ogden1987). Although some studies have attempted to control for several of these factors (e.g., Behrman et al., Reference Behrmann, Ebert and Black2004), few studies have specifically targeted left hemisphere stroke patients in the chronic phase of recovery.
Further complicating the issue is the fact that visuospatial impairments have been measured in ways that often confound several contributing factors. Bedside assessments of hemineglect (such as the Behavioral Inattention Test [BITC]), for example, include copying, drawing, line bisection, and cancellation tasks which require patients to draw, copy, or write. In such tasks, patients often omit items or details presented on the side of the page that is contralateral to their lesion. Unfortunately, these tasks necessarily confound perception, attention, and motor response systems (e.g., Leibovitch et al., Reference Leibovitch, Black, Caldwell, Ebert, Ehrlich and Szalai1998). In addition, these types of tasks can be difficult to administer to left hemisphere stroke patients due to the fact that their dominant hand is often affected.
Other experimental measures of attention have relied on simpler manual responses (e.g., button press), typically emphasizing response times and accuracy (see Deouell, Sacher, & Soroker, Reference Douell, Sacher and Soroker2005; Schendel & Robertson, Reference Schendel and Robertson2002). In these cases, deficits in attention are typically measured under conditions requiring speeded responses. This is a common issue within the attention literature, and it remains an ongoing challenge to disentangle attentional impairments from more basic sensory or motor impairments (Bartolomeo, D’Erme, Perri, & Gainotti, Reference Bartolomeo, D’Erme, Perri and Gainotti1998; Leibovitch et al., Reference Leibovitch, Black, Caldwell, Ebert, Ehrlich and Szalai1998).
In the current study, we used an adaptive visual conjunction search paradigm. The visual search paradigm is a well-studied method that has contributed much in the way of documenting attentional deficits in the presence of intact visual perception. In particular, visual conjunction search tasks, in which an individual is asked to search for a target that is defined by a conjunction of features (e.g., a red square presented amidst red triangles and blue squares), have been associated with a serial, or controlled, attentional search process in healthy adults (see Treisman & Gelade, Reference Treisman and Gelade1980).
As would be expected, these tasks have likewise revealed contralesional attentional impairments in right-hemisphere patients with hemineglect (Behrman et al., Reference Behrmann, Ebert and Black2004; Eglin, Robertson, & Knight, Reference Eglin, Robertson and Knight1989; List, et al., Reference List, Brooks, Esterman, Flevaris, Landau, Bowman and Schendel2008; Pavlovskaya, Ring, Groswasser, & Hochstein, Reference Pavlovskaya, Ring, Groswasser and Hochstein2002). Moreover, the impairments observed in these serial (attentionally demanding) search tasks are typically much greater than in parallel visual search tasks (where the target is a single feature) involving identical colors or shapes (see List et al., Reference List, Brooks, Esterman, Flevaris, Landau, Bowman and Schendel2008; Eglin et al., Reference Eglin, Robertson and Knight1989; Eglin, Robertson, & Knight, Reference Eglin, Robertson and Knight1991). Together, these findings support the idea that the process of accurately detecting a conjunction of features requires additional (attentional) processing and can be impaired despite intact perception of component features. The degree to which such contralesional conjunction search impairments may manifest after left hemisphere stroke has not been as thoroughly investigated.
Typically, visual search tasks involve speeded responding. As an exception, however, our research group introduced an adaptive visual search paradigm in which stimulus set sizes remain constant while stimulus presentation time is manipulated (see List et al., Reference List, Brooks, Esterman, Flevaris, Landau, Bowman and Schendel2008). In other words, instead of giving participants long or unlimited viewing time, they are given unlimited time to respond while stimulus presentation time is manipulated. By incorporating an adaptive staircase procedure within this paradigm, the prior study (List et al., Reference List, Brooks, Esterman, Flevaris, Landau, Bowman and Schendel2008) measured viewing time thresholds for both visual feature (singleton) and visual conjunction search in a cohort of stroke patients and controls. The findings supported the notion that visual conjunction search required greater attentional resources and, importantly, demonstrated significant contralesional impairment in the visual conjunction search task in right hemisphere stroke patients. Furthermore, by using such an adaptive psychometric procedure, it was demonstrated that significant contralesional attentional impairments could be observed even in the chronic state.
With regard to examining the role of the left hemisphere in attention, only a few studies have used psychophysical measures. In one study, Woods et al. (Reference Woods, Mennemeier, Garcia-Rill, Meythaler, Mark, Jewel and Murphy2006) used a psychophysical measure of perceived stimulus intensity to demonstrate that two left hemisphere injured individuals experienced reduced perceptual intensity on their contralesional side. Nonetheless, reduced perceptual intensity estimates may reflect either an attentional or a sensory deficit. In another study, our research group (List et al., Reference List, Brooks, Esterman, Flevaris, Landau, Bowman and Schendel2008) assessed 10 left hemisphere stroke patients on the adaptive visual search tasks and reported less severe contralesional impairment after left-hemisphere stroke. This finding, however, is limited by the small number of patients tested as well as the fact that those participants had little to no persisting language deficits and thus may have had more restricted lesions.
This latter point represents a final problem for addressing the role of the left hemisphere in visuospatial attention. Language impairments are more predominant and potentially limiting after left hemisphere brain injury, thus detracting from objective assessment of visuospatial functioning. As such, patients with moderate to severe language impairments are often not included in studies of visual attention due to the possibility that any observed impairment may be attributed to a lack of comprehension rather than attention, per se. Thus, more data are needed to better understand the role of the left hemisphere in spatial attention.
The adaptive visual conjunction search paradigm described above is particularly advantageous in that it offers a means of assessing attentional bias in patients without the requirement of speeded responses or intact language abilities. In the present study, we administered this same visual conjunction search task to a large group of chronic left hemisphere injured patients, who suffered from a range of language impairments. The goal was to determine the degree to which chronic left hemisphere injured patients, with lesions including perisylvian language networks, experience lateralized attentional bias in visual search. Patients were assessed with the psychometric visual conjunction search task described by List et al. (Reference List, Brooks, Esterman, Flevaris, Landau, Bowman and Schendel2008), as well as the subtests of the BITC (a paper and pencil assessment comprised of copying, drawing, bisection and cancellation tasks; Wilson, Cockburn, & Halligan, Reference Wilson, Cockburn and Halligan1987). We predicted that the adaptive conjunction search task would provide a means of detecting persisting attentional bias in this cohort, independent of their level of language functioning. Since the assessment of visuospatial attention in chronic left-hemisphere injured individuals with language impairments is not typically addressed, the outcome of this study has relevance to both clinical care and theories of visuospatial attention.
Methods
Participants
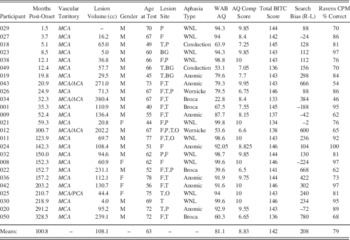
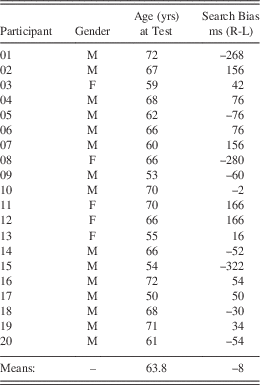
Stroke participants included 25 individuals who had a single left hemisphere stroke (20 male, see Table 1). Participants were enrolled as part of a larger, ongoing stroke study. The majority of test sessions were conducted at least 12 months post-stroke (84%), while 16% were conducted in the 1.5- to 12-month range. Mean time post-stroke was 8.4 years and mean age upon testing was 63 years (range, 39–77 years). Twenty age-matched controls (15 male) were also assessed (mean age: 63.8 years, range 53–72 years, see Table 2). All participants were right-handed, English speakers, with available structural brain imaging and no prior psychiatric or neurologic history.Footnote 1 Lesion reconstructions were manually drawn on native T1-weighted MRI images for each participant using MRICron software. Lesion volume (cc) was calculated from these reconstructions after they were normalized to standardized Montreal Neurological Institute coordinates. Participants provided informed consent before participating, and all study procedures were approved by the local institutional review board committee and were in accordance with the Declaration of Helsinki.
Patient Characterization

Notes. -- signifies data are not available; MCA=Middle Cerebral Artery; ACA=Anterior Cerebral Artery; PCA=Posterior Cerebral Artery; F=Frontal; P= Parietal; T=Temporal; BG=Basal Ganglia; O=Occipital; WNL=within normal limits; WAB=Western Aphasia Battery; AQ=Aphasia Quotient; Comp=Comprehension; (R-L)=Right TPT minus Left TPT; CPM=Colored Progressive Matrices
Control Participants

Stroke-related tissue damage in the stroke group largely involved the middle cerebral artery distribution, commonly encompassing the perisylvian language areas (see Table 1). Patients with visual field defects on confrontation, self-reported impairments in color vision, or an inability to detect singleton color features in a cluttered array, were not included. Language skills were assessed in all patients using the Western Aphasia Battery (WAB). The overall aphasia severity score was 81.1 (SD=22; range=22.8–99.6). Ten patients scored within normal limits,Footnote 2 but others were classified as Broca’s (n=4), Wernicke’s (n=2), Anomic (n=7), or Conduction (n=2). In addition, Raven’s Colored Progressive Matrices were also administered to the stroke patients as a means of assessing their current non-verbal IQ (see Table 1 for patient characterization and test scores).
Administration of the Behavioral Inattention Test
The Conventional Behavioral Inattention Test (BITC) was administered to the stroke patients in a quiet, private testing room on the VA Martinez campus. The subtests included: line crossing, letter cancellation, star cancellation, figure and shape copying, line bisection, and representational drawing. The total score derived from the BITC has been used for determining the presence/absence of visual neglect. The maximum score of the BITC is 146, with lower scores indicating greater impairment. A score of less than 129 is indicative of the presence of hemineglect (Wilson et al., Reference Wilson, Cockburn and Halligan1987).
Adaptive Conjunction Search Task
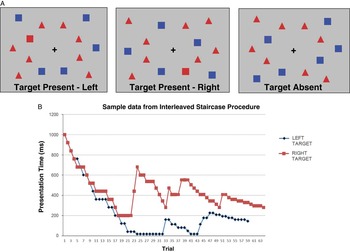
The adaptive visual conjunction search task (as described in List et al., Reference List, Brooks, Esterman, Flevaris, Landau, Bowman and Schendel2008) was individually administered via computer to both the patients and age-matched controls in a noise-attenuated, private testing room. The task was programmed and presented with Neurobehavioral Systems Presentation visual presentation software. At the start of each trial, participants were asked to view a central fixation cross that was followed by the stimulus display. Participants were asked to indicate whether or not a red square had been present (Figure 1). The target was present 50% of the time and was shown amidst other red distractors (triangles) and non-target squares (blue). Participants could take as long as they needed to respond, as it was the stimulus presentation duration that was the critical measure.
A: Examples of the three types of conjunction search displays. Participants see one such display on each trial and are required to indicate whether or not a red square is present. The target could appear in the left visual field (left), right visual field (middle), or not at all (right). B: Sample output from one stroke participant depicting the staircase progression in the visual conjunction search task. Presentation times started at 1000 ms for both left (blue) and right staircases (red). Subsequent presentation times were adjusted according to performance, as per List et al., Reference List, Brooks, Esterman, Flevaris, Landau, Bowman and Schendel2008. Each individual’s threshold presentation time (TPT), or viewing time required to achieve a 75% adjusted accuracy level, was calculated from the average of the last 8 reversal points. The fastest presentation duration that could be achieved was 16 ms, indicated by the near-zero points in the Left Target staircase (blue). In this case, the participant accurately detected several left-sided targets at this shortest presentation duration but eventually did make an error resulting in increased presentation durations on subsequent trials.

Participants were given verbal and pictorial instructions and were encouraged to use a yes–no response, if possible, to indicate whether or not the target was present. Other acceptable responses included head nods and hand signals. Comprehension of task instructions was assessed in an initial practice session that began with a long, fixed viewing time (2000 ms). All participants showed appropriate responses and an ability to detect the target at the longer presentation times. The dependent measure was how long the stimuli needed to be present (threshold) to achieve a targeted accuracy level for target detection on each side of the stimulus display.Footnote 3
Using the adaptive, yes–no staircase procedure reported by List et al. (Reference List, Brooks, Esterman, Flevaris, Landau, Bowman and Schendel2008), the stimulus presentation time was decreased following correct responses and increased following incorrect responses, thereby adapting to each individual’s performance level (see Supplementary Material for more detail). Trial order (left target, right target, no target) was random such that neither the participant nor experimenter could predict which type of trial was forthcoming.
Participants were instructed to fixate on a cross that was presented alone in the center of the display before stimulus onset to center their focus in the middle of the display before each trial. Trials continued until 10 reversals in stimulus presentation time were achieved within each staircase, indicating a stable plateau in performance. Stimulus presentation times at the last eight reversal points were then averaged to estimate the viewing time, or threshold, required to achieve an adjusted accuracy level of 75% (see Kaernbach, Reference Kaernbach1990). By using two randomly interleaved staircases, a separate left and right-sided viewing time threshold was obtained for each participant. Lateralized visuospatial bias was then quantified as the difference between each individual’s right- and left-sided viewing thresholds, with positive values indicating more viewing time needed to detect right-sided (contralesional) than left-sided (ipsilesional) conjunction targets.
Data Analysis
Left and Right viewing thresholds, or threshold presentation times (TPTs), for each subject were analyzed in a two-way analysis of variance with one within-subjects factor of Target Side (Left, Right) and one between-subjects factor of Group [left hemisphere damaged (LHD), Control]. In addition, the degree of visuospatial bias experienced by each participant was calculated by subtracting the Left TPT from the Right TPT. These visuospatial bias scores were then examined with non-parametric single sample Kolmogrov-Smirnov tests to confirm whether or not the visuospatial bias scores were normally distributed within each group and to test whether the median score of each group was significantly different from zero.
To examine whether other factors (months post-stroke, AQ comprehension scores, or BITC Score) correlated with the magnitude of visuospatial bias in the patient group, Pearson Correlation Coefficients were calculated between each of these factors and the magnitude of visuospatial bias observed in each patient. In addition, a repeated measures analysis of co-variance (ANCOVA) was conducted on the patients’ TPTs to examine the extent to which the effect of Target Side (Left, Right) remained significant when months post-stroke, WAB AQ comprehension scores, and BITC Scores were included as covariates.
Results
Patients’ performance on the two types of tasks (BITC vs. Adaptive Visual Search) provided contrasting results. Minimal visuospatial impairment was observed in this chronic left hemisphere stroke group as assessed via the BITC. No patient had a total score lower than the neglect cutoff score of 129. Even when considering just the cancellation tasks from the BITC (line, shape, and letter cancellation) only a modest contralateral decrement was observed. Twelve (48%) of the patients showed no difference at all between the number of targets detected on the two sides of space, and only 9 (36%) showed negligibly poorer contralateral performance, with scores ranging from 1 to 4 fewer contralesional targets found (out of a total of 65).Footnote 4
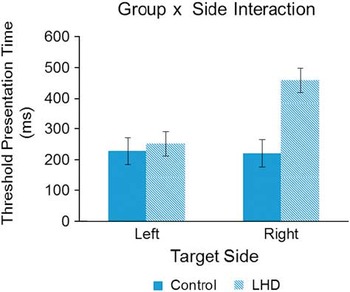
In contrast, the computerized adaptive visual search task in the same patients, revealed significant visuospatial bias. A significant main effect of Target Side indicated that longer viewing times were required for right-sided targets [F(1,43)=9.36; p<.01]. Importantly, a significant Target Side x Group interaction [F(1,43)=10.84; p<0.01, Partial Eta Squared=0.201] confirmed that it was the patients’ right-sided (contralesional) performance that was impaired (see Figure 2).
Results from the Adaptive Conjunction Search Task. Threshold presentation time (TPT), or the length of time the visual stimulus display needed to be present to achieve an adjusted accuracy level of 75%, is plotted as a function of target side (Left, Right) and study group (Controls, LHD). The left hemisphere stroke patients required greater viewing time to achieve the same level accuracy for targets on their right (contralesional) side of the display. On average, age-matched controls showed an 8-ms, non-significant, difference between their right and left conjunction search thresholds on this task, while the stroke group demonstrated a significant difference (right minus left) of 208 ms.

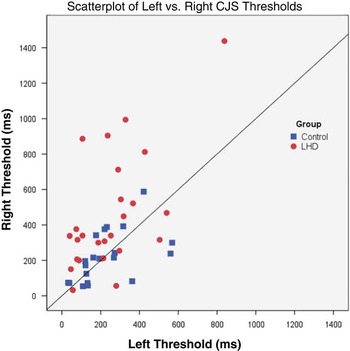
Single sample Kolmogrov-Smirnov tests for each study group further confirmed that the visuospatial bias scores, as defined by the difference in right and left thresholds (Right TPT – Left TPT), were normally distributed for both groups but that only the patients’ median difference score was statistically greater than the null hypothesis of zero (LHD Group Median: 130 ms; p<0.01; Control Median=25 ms; p=.81). For better illustration of the consistency and magnitude of the effect, a scatterplot indicating each participant’s right versus left visual search threshold is shown in Figure 3.
Scatterplot contrasting each participant’s left- versus right-sided visual conjunction search thresholds. Right threshold presentation time (ms) is plotted on the y-axis, while left threshold presentation time is plotted on the x-axis, with Controls depicted by blue squares and left hemisphere damaged (LHD) individuals indicated by red circles. The solid black line represents perfectly symmetrical (balanced) thresholds. Thus, participants requiring longer presentation times for detecting targets on the right (contralesional) side of the display appear above the solid line.

When the number of missed visual search targets was examined according to Target Side, 16/25 patients (64%) were found to have missed more targets on their contralesional (right) side. Although the overall mean targets missed was quite small (Mean=3.96 contralesionally vs. 2.44 ipsilesionally), the pattern is reminiscent of the contralesional deficit observed in hemineglect.
Lateralized Visuospatial Bias Does not Correlate With Comprehension or Chronicity
To examine whether recovery time or language impairments affected patients’ visual search performance, correlations were analyzed between the patients’ lateralized visuospatial bias score (the difference between their left and right TPTs), their AQ comprehension scores, and the elapsed time post-stroke. Neither the comprehension scores nor months post-stroke were significantly correlated with lateralized visuospatial bias (r=−0.34 and r=0.27, respectively, both p>.1). There was also no significant correlation between the patients’ BITC scores and lateralized visuospatial bias (r=−0.29; p>.1). Although not statistically significant, it is possible that these correlation values represent trends. However, when the stroke patient’s TPTs were entered into an ANCOVA with months post-onset, WAB comprehension scores, and BITC scores as covariates, the main effect of Target Side (left, right) still remained significant [F(1,21)=8.07; p=.01, partial eta squared=0.278].
It should be noted that lateralized visuospatial bias was found to correlate with lesion volume (r=0.63; p<.01). This is not unexpected, as the more tissue and pathways that are damaged, the greater the likelihood of an imbalance between existing spared networks. Future research will need to investigate which structures or pathways, when spared, confer the greatest advantage in terms of re-establishing attentional balance (i.e., which pathways may help ameliorate persisting attentional bias).
Discussion
Visual search is a frequent daily task (e.g., finding a friend in a crowd or an item on grocery store shelf). In the current study, chronic left hemisphere stroke patients, with a range of language impairments, were specifically assessed for the presence of lateralized attentional bias using a refined psychometric visual conjunction search paradigm. Despite the lengthy time post-stroke onset, a significant contralesional search impairment was observed in this left hemisphere stroke cohort. This finding indicates that left hemisphere injury can influence the balance of attention across space during visual search.
Neuropsychological data from the Conventional subtests of the BITC were collected along with the results of a psychometric visual conjunction search task in a group of 25 chronic left hemisphere stroke patients. Although flagrant symptoms of lateralized attentional bias were not present on the paper and pencil test (BITC), there was a significant contralesional impairment on the adaptive visual search task in these left hemisphere patients. Thus, by using an adaptive measure that did not rely on speeded responses or a high level of language functioning, this study revealed appreciable contralesional visual search bias (in visual conjunction search) in a chronic, left hemisphere-injured group. This suggests that persisting attentional bias may be under-appreciated in left-hemisphere injured individuals (Beis et al., Reference Beis, Keller, Morin, Bartolomeo, Bernati, Chokron and Azouvi2004; Fortenbaugh, Schendel, Robertson, Dronkers, & Baldo, Reference Fortenbaugh, Schendel, Robertson, Dronkers and Baldoin preparation).
The finding of contralesional impairment on a psychometric visual task after left hemisphere injury is consistent with a previous case report by Woods et al. (Reference Woods, Mennemeier, Garcia-Rill, Meythaler, Mark, Jewel and Murphy2006) in which a psychometric measure of perceptual intensity revealed a similar lateralized deficit in a single chronic left hemisphere stroke patient with expressive aphasia. By using a visual conjunction search task, however, the current study extends this prior finding, to a larger patient cohort, and into the realm of attentionally demanding serial visual search. The observation of poorer performance on the contralesional side in the current task indicates that contralesional impairments after left hemisphere injury are not limited to perceptual deficits or to rare cases, but likely involve an imbalance of attention across space.
Clinically speaking, this suggests that all patients with unilateral brain injury may experience some degree of imbalanced attentional processing and, more importantly, that this imbalance can persist for years or possibly even indefinitely. It is reasonable to assume that such imbalances may also be augmented under conditions including fatigue, illness, cluttered environments, or high task demands such as driving in traffic. Thus, knowledge of such vulnerabilities may enhance treatment and recovery in patients with unilateral brain injury, as it is possible that such attentional impairments may influence performance or impede recovery. This is consistent with a growing awareness among rehabilitation specialists that other non-linguistic domains of cognition are important in aphasia therapy outcomes (Helm-Estabrooks, Reference Helm-Estabrooks2002; Seniów, Litwin & Leśniak, Reference Seniów, Litwin and Leśniak2009). With the adaptive visual search paradigm used here, future directions for research could more systematically investigate the role of attentional bias in aphasia and speech therapy outcomes.
Also of importance is the chronic nature of the attentional bias observed in this left hemisphere stroke group, as some patients in this cohort were as much as 25 years post-stroke. The persisting nature of this contralesional impairment indicates that imbalances in visual attention can persist for years after unilateral brain injury, and not just after right hemisphere injury but in left hemisphere injury as well. This is consistent with a model of attention in which potentially homologous dorsal frontal-parietal brain networks for attention exist in both hemispheres (Corbetta & Shulman, Reference Corbetta and Shulman2002) such that injury to either hemisphere may create a systematic imbalance resulting in reduced attention to the contralesional side. Alternatively, it could be the case that left hemisphere damage within and around the left perisylvian region indirectly affects functioning of the right lateralized VAN via compromised connections/pathways.
The fact that attentional imbalance has not been reported or is not deemed as severe after left hemisphere damage may be due to several factors. There are often barriers to accurate visuospatial assessment in this population. For one, left hemisphere injury is more likely to cause language problems that can preclude accurate verbal responses or comprehension of task instructions. Second, many bedside assessments of attention, including the BITC, require substantial drawing or copying. Yet, in left brain-injured individuals the dominant hand is also often affected, making such tasks more difficult to administer, especially in the acute stage when symptoms would be most flagrant.
In contrast, the adaptive testing procedure used here is advantageous because it can be demonstrated non-verbally and the use of thresholds as the dependent measure precludes the need for speeded verbal or motor responses. This is an important contrast as it offers a sensitive measure that can be administered even to hemiparetic patients with language deficits. Although we did not have the opportunity to assess any globally aphasic patients, it is possible that this paradigm could be administered to such persons, especially since no verbal response is required and each participant’s contralesional performance is compared to their own performance for ipsilesional targets.
It should be noted that others have indeed reported contralesional impairments in as many as 30% of left-hemisphere injured patients when using elegant measures that require speeded responses (e.g., Deouell et al., Reference Douell, Sacher and Soroker2005). As a complement to this, the current study establishes a significant group-level effect even when participants had unlimited time to respond and a variety of ways to do so (a hand raise, nod, grunt, or simple verbal utterance).
Another reason that attentional imbalance may be less commonly reported after left hemisphere injury could be due to the presence of a right hemisphere dominant VAN (Shulman et al., Reference Shulman, Pope, Astafiev, McAvoy, Snyder and Corbetta2010), allowing for greater compensation when the right hemisphere remains intact. This would be consistent with reports that find less severe attentional impairments after left-sided strokes and also with the fact that more subtle psychometric measures may be needed to measure such attentional imbalances in the chronic state. A testable prediction from this latter explanation is that contralateral cues should decrease attentional biases after left-sided brain injury, while not being as helpful after damage directly affecting the right hemisphere VAN. The present study did not test this prediction, but it merits future attention.
Of note, the prior List et al. study (Reference List, Brooks, Esterman, Flevaris, Landau, Bowman and Schendel2008) using this same paradigm reported a 589-ms mean advantage for ipsilesional targets in a right hemisphere stroke group, while the current study found a significant, but smaller, 208-ms advantage in a group of chronic left hemisphere stroke patients. Although the search bias observed here after left hemisphere stroke is smaller in magnitude, a direct comparison is difficult for two reasons. First, the initial stimulus presentation duration was shortened by 1000 ms in the current study to increase the speed with which the required 10 reversal points were achieved. Second, the participants in the current study were tested at much longer post-stroke delays.Footnote 5 Thus, the primary finding here is that significant contralesional impairment can also be demonstrated in patients with chronic left hemisphere injury.
It should be noted that a few cases (5/25) in our patient cohort showed a pattern consistent with a reversed, ipsilesional, attentional impairment (illustrated by negative values greater than 10 ms in Table 1). Ipsilesional attentional deficits can be observed after right hemisphere injury in as many as 16% of cases (Kim et al., Reference Kim, Na, Kim, Adair, Lee and Heilman1999). The frequency of the ipsilesional impairment observed here after left hemisphere injury (20%) is similar. Whether these few cases represent a distinct ipsilesional attentional impairment as suggested by Kim et al. (Reference Kim, Na, Kim, Adair, Lee and Heilman1999), a compensatory effect (4/5 were at least 3 years post-stroke), or some other non-lateralized attentional deficit remains a topic for further study.
Nonetheless, the majority (76%) of our left hemisphere-stroke cohort demonstrated longer TPTs for contra- compared to ipsi-lesional targets,Footnote 6 reminiscent of the type of imbalance present in hemispatial neglect. Indeed, 44% (11/25) demonstrated a contralesional search asymmetry that was greater than 1.5 standard deviations from the mean of the age-matched controls. Visual hemineglect is most commonly reported in clinical settings after right hemisphere brain injury and has been widely examined as a means of understanding cerebral lateralization of visual attention. The neglect syndrome consists of a constellation of symptoms in which patients fail to report, respond, or to attend to visual stimuli on one side of space (Bartolomeo, Reference Bartolomeo2014; Kinsbourne, Reference Kinsbourne1977; Vallar, Reference Vallar1993).
In severe cases, patients may be unable to find or attend to objects located on the affected side of space, including people, or even the food on their plates. In milder cases, it takes extra time and increased effort to attend to items on the affected side. Moreover, deficits of hemineglect can manifest in many ways including spatial bias within different spatial reference frames, in attentional orienting, in motor responses, and even within different sensory modalities. Thus, there are many components of visuospatial attention that may be impacted in hemineglect, but the most common underlying symptom is an imbalance of visual attention across space.
Right hemisphere specialization for the orienting of attention across both visual fields is often cited as the reason for the higher incidence and more severe instances of hemineglect after right hemisphere brain injury (Mesulam, Reference Mesulam1981). Although this is broadly consistent with the asymmetrical VAN described by Corbetta and Shulman (Reference Corbetta and Shulman2002), the VAN is thought to be involved in more bottom-up stimulus-driven orienting, which would mean that higher level top-down, goal directed orienting (mediated via the bilaterally represented dorsal attention network, or DAN) should be able to overcome such imbalances during goal-directed tasks (like visual conjunction search), especially when time to respond is not limited. The present study used such a task but still demonstrated a significant visual search bias in a cohort of chronic left hemisphere stroke patients. This adds weight to the idea that bilateral attention networks are engaged in a delicate balance that can be disrupted by damage within either hemisphere.
It has also been previously argued that the directionality of spatial attention deficits such as hemineglect can be influenced by the specific response types (manual vs. verbal) or nature of the task (reading vs. spelling or verbal vs. visuospatial). For example, Riddoch, Humphreys, Luckhurst, Burroughs, and Bateman, Reference Riddoch, Humphreys, Luckhurst, Burroughs and Bateman1995, argued that some tasks inherently cue attention toward one side of space. For example, in one case, left neglect was observed for reading whole words (which induces a tendency to orient attention rightward), while right neglect was observed when the same participant was required to spell each letter of the word individually (which requires one to initially focus on the leftmost letter). This is consistent with the idea that the presence and direction of hemineglect may depend on the extent to which attention is cued by task demands to a particular side of space or within a particular reference frame (Behrmann & Tipper, Reference Behrmann and Tipper1999; Kleinman et al., Reference Kleinman, Newhart, Davis, Heidler-Gary, Gottesman and Hillis2007).
The current study did not specifically investigate the role of attentional cueing, but it should be noted that for any given trial, the initial fixation stimulus cued attention to the center of the display. In addition, the stimuli were non-verbal and equally balanced across the screen and, therefore, should not have engendered any preference to start on any particular side of the display, as in reading or spelling tasks. Moreover, there was no lateralized motor response. If anything, verbal responding was encouraged which, according to the arguments above, should have activated the left hemisphere thereby increasing attention toward the right (the opposite direction of the bias that was, in fact, found).
Although attentional bias across a visual array is just one symptom that patients diagnosed with hemineglect may experience, it is one of the most classic elements of the syndrome. Nevertheless, we do not suggest that the presence of attentional bias in this paradigm signifies the presence of hemineglect. Rather, we think this paradigm is well-designed to reveal lateralized attentional biases that are likely due to an imbalance of attention networks in the two cerebral hemispheres. It does seem probable, however, that such imbalances after brain injury are likely a contributing factor in hemispatial neglect. The key may be the degree to which the spared hemisphere can compensate for this imbalance. Even so, this study suggests that complete compensation may be unlikely and that residual imbalances in visual attention can persist for years.
In sum, theories of visual attention have primarily emphasized the role of the right cerebral hemisphere in aspects of visuospatial attention. The current study demonstrates that the left hemisphere also plays a role in the balance of visual attention across space and that damage to the left hemisphere can have long lasting consequences. These results are consistent with findings from functional neuroimaging studies in healthy adults that indicate both left and right hemisphere involvement in the control of spatially directed attention (Corbetta & Shulman, Reference Corbetta and Shulman2011; Hopfinger et al., Reference Hopfinger, Buonocore and Mangun2000; Suchan et al., Reference Suchan, Umarova, Schnell, Himmelbach, Weiller, Karnath and Saur2014). Therefore, neuropsychological models of visuospatial attention must continue to address the role of the left hemisphere, and the pathways by which attentional networks in the left hemisphere interact with those in the right.
Acknowledgments
Conflicts of Interest: The authors report no personal or financial conflicts of interest. Funding: This work was supported by grants from the Department of Veteran Affairs, Clinical Sciences Research & Development Program (Merit Award CX000586-01 to A. Turken, and a VA CSR&D Research Career Scientist Award to N. Dronkers). The authors also thank Lynn C. Robertson, Ph.D. for the use of the computerized adaptive visual search task scripts and Brian Curran for assisting with patient recruitment and scheduling. The contents of this report do not represent the views of the U.S. Department of Veterans Affairs or the United States Government.
Supplementary material
To view supplementary material for this article, please visit http://dx.doi.org/10.1017/S1355617716000515