1. INTRODUCTION
In Global Navigation Satellite Systems (GNSS), the satellite signals are extremely susceptible to the surrounding environment and human factors, such as multipath in urban canyons and spoofing. Therefore, it is rather difficult to guarantee accuracy and reliability of positioning in applications concerning safety of human life. Integrity is defined by the International Civil Aviation Organization's GNSS Standards and Recommended Practices (SARPS), which is used to describe the availability and reliability of a navigation system (Innac et al., Reference Innac, Bhuiyan, Söderholm, Kuusniemi and Gaglione2016). An integrity service can provide timely warnings to users when the system or certain parts of it are unreliable for navigation (Yang and Xu, Reference Yang and Xu2016).
Receiver Autonomous Integrity Monitoring (RAIM) is a common method for providing an integrity service, which includes Fault Detection and Exclusion (FDE). Lee (Reference Lee1986) first proposed that Global Positioning System (GPS) integrity could be provided in the user receiver by using redundant measurement information in a range and position comparison scheme for fault detection. Following this work, many RAIM schemes have been proposed and studied. In general, range comparison (Lee, Reference Lee1986), least squares residuals (Parkinson and Penina, Reference Parkinson and Penina1988), parity vector (Sturza, Reference Sturza1988) and maximum solution separation (Brown and McBurney, Reference Brown and McBurney1988) are known as the conventional methods. The latter three methods have the same principle in that they perform a self-consistency check among redundant measurements using a statistical hypothesis test based on least squares residuals (Brown, Reference Brown1992). One of the conventional RAIM algorithms is the “Snapshot” algorithm which is based on the current measurements. It is widely used due to it not needing to consider the pre-state and post-state of the navigation system. As the conventional methods are based on the assumption of a single fault, they have a high accuracy of FDE in the case of a single fault but an unsatisfactory performance in cases of multiple faults. In order to improve the performance of RAIM in multiple FDE, some researchers have proposed to use a priori knowledge to achieve FDE. For example, McBurney and Brown (Reference McBurney and Brown1989) and Ren and Ching-Fang (Reference Ren and Ching-Fang1995) proposed to use a Kalman filter to achieve GPS integrity monitoring. Yoo et al. (Reference Yoo, Ahn, Lee and Sung2012) proposed a new method to achieve GPS fault detection and isolation by comparing the measured pseudorange and the predicted pseudorange information obtained by a pseudorange prediction model. In addition, Yang et al. (Reference Yang, Li, Wu and Rizos2014) proposed to use supplementary information provided by external sensors to achieve integrity monitoring. These methods can improve the ability of FDE in the case of multiple faults. However, the performance of the prior knowledge-based FDE methods depends on the accuracy of prior error estimation and the speed of detection is slow, and for the methods based on supplementary sensor information, the reliability and accuracy of the sensor needs to be obtained in advance.
Using conventional RAIM algorithms as the basis, some improved solutions have been proposed. Hewitson and Wang (Reference Hewiston and Wang2006) presented an extended w-test method for the simultaneous removal of multiple outliers in measurements. Ni et al. (Reference Ni, Zhu and Guo2007) and Knight et al. (Reference Knight, Wang and Rizos2009) proposed an improved scheme assuming two satellite faults and Knight et al. (Reference Knight, Wang and Rizos2010) further extended this reliability theory so that it can be applied to detect multiple faults. Cao et al. (Reference Cao, Hu, Xu and Li2013) introduced an improved RAIM algorithm based on a parity vector method, which can effectively improve the availability of fault detection in the case of one or two faults. Yang et al. (Reference Yang, Wang, Knight and Shen2013) extended the theory of outlier separability to the general case, where there are multiple alternative hypotheses. Joerger and Pervan (Reference Joerger and Pervan2014) developed a new Chi-squared (Chi2) RAIM approach which can improve the performance of FDE in the case of two faults. Wang (Reference Wang2015) proposed an improved RAIM algorithm for two simultaneously faulty satellites on the basis of a QR-decomposition on a fault features plan. These methods can improve the performance of RAIM in the case of two faults to some degree, but in the case of more than two faults, there is no significant improvement in performance. In order to exclude multiple faults as accurately as possible, conventional RAIM algorithms typically use the forward-backward method based on the w-test to exclude the faults (Kuusniemi et al., Reference Kuusniemi, Wieser, Lachapelle and Takala2007), but the method often misleads, fails to identify the fault and has a low computational efficiency. In view of the shortcomings of the w-test-based fault identification method, some researchers have proposed to use correlation analysis methods to detect and locate faults (Bei et al., Reference Bei, Gu and Fang2010; Hu et al., Reference Hu, Lu, Cao and Li2014). However, in some cases, for example, when the correlation is not significant due to the interaction of multiple outliers, the correlation analysis method cannot get any better results (Tang et al., Reference Tang, Wang and Peng2011). In order to improve the performance of RAIM in regard to single and multiple faults, we studied the traditional fault exclusion methods and proposed an improved method based on consensus voting of the w-test and correlation analysis methods.
We first introduce the error model of least squares estimation and describe the methods of fault detection. Then we present and discuss the conventional fault exclusion methods including the w-test and the correlation analysis methods and propose an improved method for single and multiple faults exclusion. Finally, we give test and experimental analysis and summarise the findings and conclusions.
2. SINGLE POINT POSITIONING AND ERROR MODEL
The code pseudorange measurement between the satellite and the receiver can be written as follows (Kaplan and Hegarty, Reference Kaplan and Hegarty2006):
 $$\rho = R + c\lpar dt_{r} - dt_{s}\rpar + \Delta I + \Delta T + \varepsilon $$
where ρ is the measurement pseudorange, R is the geometric distance between the receiver and the satellite, c is the speed of light, dt r and dt s are the receiver and satellite clock offset, respectively, Δ T and Δ I are the tropospheric and ionospheric delay corrections, respectively and ε is the sum of unmodeled measurement errors. For simplicity, Equation (1) does not specify parameters such effects as antenna phase centre, hardware delays, multipath and windup angle.
According to Equation (1), the navigation equations system of Single Point Positioning (SPP) can be written in compact form as:
 $${{\bi L}} = {\bf Ax} + {\brvarepsilon} $$
where L is an measurement vector containing the residuals between the measured and predicted pseudoranges. The elements of L can be obtained by:
 $$L^{i} = \rho^{i} - R_0^i + {cdt}_{s}^{i} - \Delta I^{i} - \Delta T^{i} $$
The superscript i indicates the i-th satellite, L i is the corresponding measurement, R 0 is the initial value of geometric distance and A is the design matrix containing the receiver-satellite geometry. x is the estimated parameters vector, for the single system, which is defined as follows:
 $${{\bi x}} = \lpar {dx}\comma \; {dy}\comma \; {dz}\comma \; \delta t_{r}\rpar ^{T} $$
where (dx, dy, dz) indicates the deviation between the true and approximate coordinates and δ t r is the receiver clock offset. For multiple systems, such as a GPS/BeiDou System (BDS) combined system, there is an Inter-System Bias (ISB) between GPS and BDS due to the different coordinate frames and time references. In general, the difference of the coordinate frame between GPS and BDS has little influence on SPP and could be ignored. Thus, the ISB shows up as the receiver clock difference between GPS and BDS, which is usually treated as a parameter to be estimated (Chen et al., Reference Chen, Wang, Zhang, Yang, Chen and Gong2016; Pan et al., Reference Pan, Chai and Kong2017).
It is assumed that the measurement error is a normally distributed random variable with zero mean and a standard deviation of σ i. For the i-th visible satellite, the measurement variance  $\sigma_{i}^{2}$ of L i can be obtained by (Takasu and Yasuda, Reference Takasu and Yasuda2013):
 $$\sigma_i^2 = R_{r} \lpar a_{\sigma}^{2} + b_{\sigma}^2/\sin {El}_{r}^{s}\rpar + \sigma_{{eph}}^{2} + \sigma_{{ion}}^{2} + \sigma_{{trop}}^{2} + \sigma_{{bias}}^{2} $$
where R r is the code/carrier-phase error ratio, a σ and b σ are the carrier-phase error factors (m), El is the elevation angle of the satellite, σ eph is the standard deviation of ephemeris and clock errors (m), σ ion is the standard deviation of the ionosphere correction model error (m), σ trop is the standard deviation of the troposphere correction model error (m) and σ bias is the standard deviation of the code bias error (m). According to the principle of weighted least squares, the estimated parameters vector  $\hat{\bi x}$ can be calculated as follows:
 $$\hat{\bi x} = \lpar {{\bi A}}^{T}\overline{{{\bi P}}}{{\bi A}}\rpar ^{-1} {{\bi A}}^{T}\overline{{{\bi P}}}{{\bi L}} $$
where:
 $$\overline{{{\bi P}}} = {diag}\lcub 1/\sigma_{1}^{2}\comma \; 1/\sigma_{2}^{2}\comma \; \ldots\comma \; 1/\sigma_{m}^{2}\rcub $$
which is the diagonal weight matrix, and each element is the reciprocal of the variance of each measurement.
The residual vector v is defined as the difference between measurements L and the fitted model  ${{\bi A}}\hat{\bi x}$:
 $${{\bi v}} = {{\bi L}} - {{\bi A}}\hat{\bi x} $$
Substituting Equations (2) and (6) into Equation (8), the residual vector v can be written as:
 $${{\bi v}} = {{\bi L}} - {{\bi A}}\lpar {{\bi A}}^{T} \overline{{{\bi P}}}{{\bi A}}\rpar ^{-1} {{\bi A}}^{T}\overline{{{\bi P}}}{{\bi L}} = \lpar {{\bi I}} - {{\bi Q}}\rpar {{\bi L}} = {{\bi S}}{\brvarepsilon} $$
where Q is an idempotent matrix, I is the identity matrix and S = I−Q is called the mapping matrix.
As can be seen from Equation (9), the residual vector v is the mapping of random error vector  ${\brvarepsilon}$ though the mapping matrix S. There is a linear relationship between the measurement residual and the measurement error, so they should have the same random distribution characters. If there is an outlier in the measurement, it will be shown in the residual vector v through the mapping S. Therefore, an outlier can be detected and identified by analysing the residual vector.
3. FAULT DETECTION METHOD
Fault detection is one of the important functions of RAIM, which is based on hypothesis testing. The hypothesis test is:
 $$\left\{\matrix{H_{0}\colon & r \leq T \cr H_{1}\colon & r \gt T \cr}\right. $$
where r is the test statistic, T is the threshold, H 0 is the hypothesis that there is no fault and H 1 is the hypothesis that there are one or more faults. The process of fault detection is implemented by comparing the test statistic r and threshold T. If r > T, it indicates hypothesis H 1 is accepted, and a fault is detected.
The Weighted Sum Squared of Residual (WSSR) calculated by Equation (9) is subject to a Chi-square distribution in the fault-free case, and non-central Chi-squared distribution in the faulty case (Parkinson and Penina, Reference Parkinson and Penina1988). Hence the test statistic can be formulated as:
 $$r = \displaystyle{{{{\bi v}}^{T}\overline{{{\bi P}}}{{\bi v}}}\over{\sigma_{0}^{2}}} \sim \chi_{1-a\comma f}^{2} \quad \lpar f = n - m\rpar $$
where  $\sigma_{0}^{2}$ is the prior variance factor, a is the significance level of the Chi-square test and f is the number of redundancies and is equal to the difference between the number of observations n and the number of estimated parameters m. It is determined whether there are faults by comparing the test statistic r and detection threshold T calculated by the significance level a.
Despite the use of the rigorous Chi-square testing procedures, there are still two types of error that can occur (Feng et al., Reference Feng, Ochieng, Walsh and Ioannides2006). A type I error occurs when the null hypothesis H 0 is true but is rejected. A type II error occurs when the null hypothesis H 0 is false but erroneously fails to be rejected. In fault detection, type I and II errors are also called false alert and missed detection, respectively. Their probabilities are expressed by the following equations (Sturza, Reference Sturza1988; Salos et al., Reference Salos, Martineau, Macabiau, Bonhoure and Kubrak2014):
 $$P_{{FA}} = P\lcub \hbox{r} \gt T\ \vert\ H_0\colon \hbox{r} \sim \chi_{f}^{2}\rcub = 1 - {CDF}_{\chi_{f}^{2}} \lpar T\rpar $$
 $$P_{{MD}} = P\lcub r \leq T\ \vert\ H_{1}\colon r \sim \chi_{f\comma \lambda}^{2}\rcub = {CDF}_{\lambda_{f\comma \lambda}^{2}} \lpar T\rpar $$
where CDF is the Cumulative Density Function;  $\chi_{f}^{2}$ is the Chi-square distribution with degree of freedom f and
 $\chi_{f\comma \lambda}^{2}$ is the non-central Chi-squared distribution with non-central parameter λ.
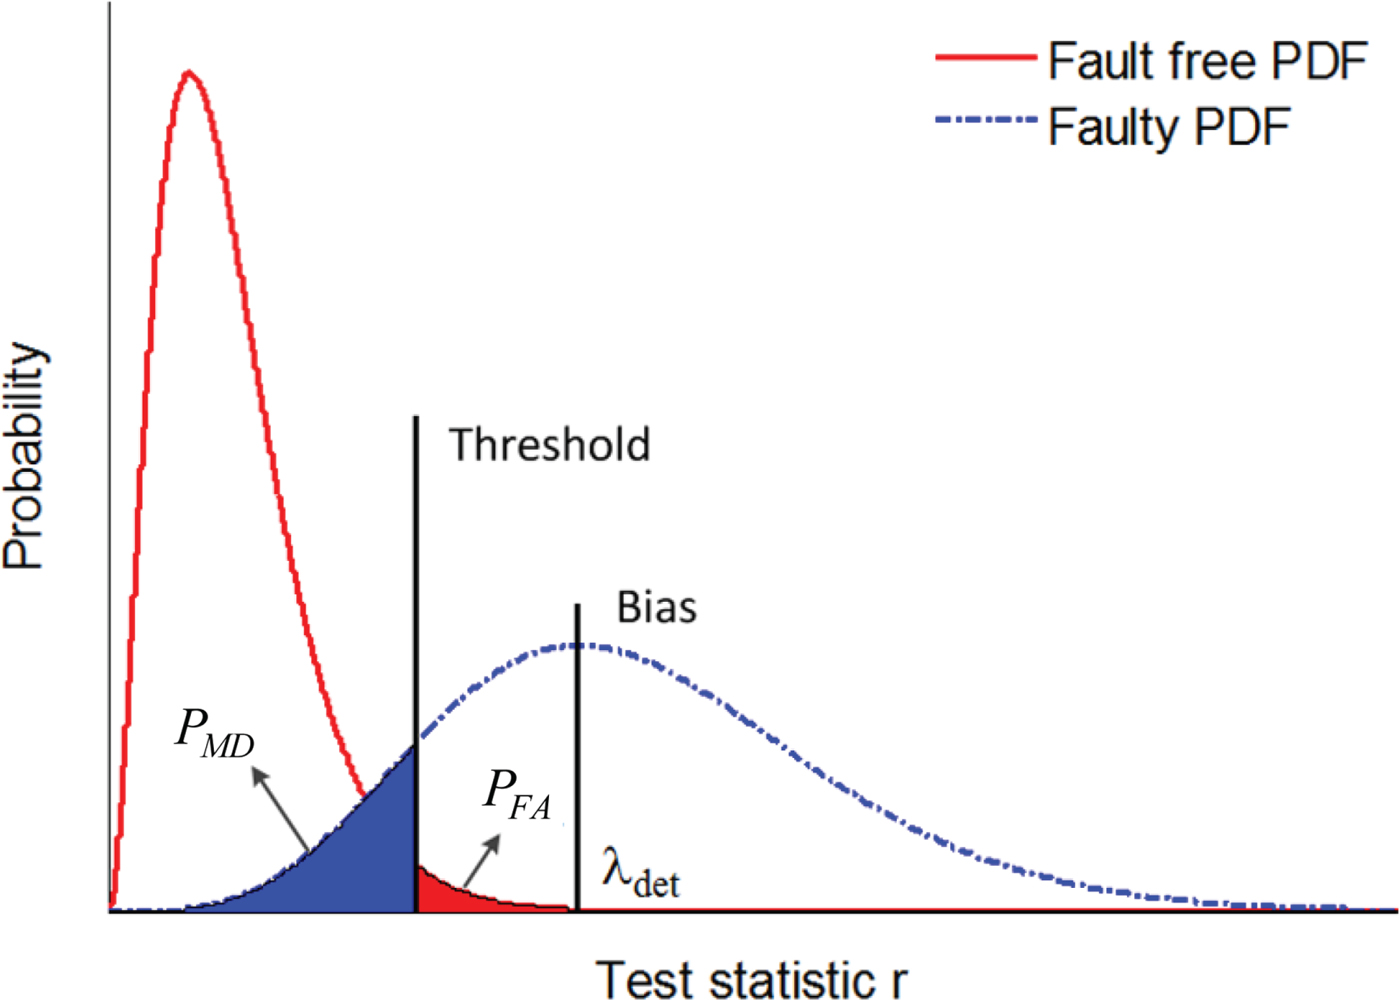
As can be seen from Equations (12) and (13), P FA is related to the threshold T, and the non-central parameter λ is related to P MD and T. The relationships between them are shown in Figure 1. We can see that P FA and P MD are contradictory in the case that the non-central parameter λ is known. For example, P FA decreases and P MD increases with the increases of threshold T and vice versa. Moreover, if P FA is known, then T can be determined. P MD is only related to λ and decreases with the increases of λ and vice versa. Similarly, if P FA and P MD are known, the non-central parameter can be calculated by the following function (Knight et al., Reference Knight, Wang and Rizos2010):
Relationship between the probability of false alert and missed detection.

 $$\lambda_{\rm det} = \lambda \lpar P_{{FA}}\comma \; P_{{MD}}\comma \; f\rpar $$
where λ det is called the minimum detectable non-centrality. According to the parameter λ det, if there is a single fault in measurement, the Minimum Detectable Bias (MDB) of each pseudorange measurement can be determined by (Knight et al., Reference Knight, Wang and Rizos2009):
 $$\nabla b_{i} = \displaystyle{{\lambda_{\rm det} \sigma_{0}}\over{\sqrt{P_{ii}S_{ii}}}} \quad \lpar i = 1\comma \; 2\comma \; \cdots\comma \; n\rpar $$
where ∇ b i is the minimum detectable bias of the i-th pseudorange measurement; P ii and S ii are the elements in the i-th row and i-th column of P and S, respectively. In regard to multiple faults, the MDB in the i-th pseudorange measurement is greater than or equal to the corresponding MDB for a single fault (Knight et al., Reference Knight, Wang and Rizos2010).
The Chi-square test based on the weighted sum of the squared residuals is a commonly used method for detecting outliers. The performance of the Chi-square test depends on P FA and P MD. The probability of successful detection is determined by P FA, and the sensitivity of fault detection is determined by P MD.
4. FAULT EXCLUSION METHODS
When faults are detected by the Chi-square test, it is necessary to identify and exclude the faults to ensure the reliability and accuracy of positioning. Common RAIM algorithms typically use the forward-backward method based on the w-test or correlation analysis methods to identify and exclude the faults (Hewiston et al., 2004; Hewitson and Wang, Reference Hewiston and Wang2006; Tang et al., Reference Tang, Wang and Peng2011). First, the forward fault exclusion is performed, the possible faults are excluded one by one based on the identification results of the w-test or correlation analysis methods until no fault is detected, and then a backward check is made to ensure the excluded faults are correct.
4.1. w-test method
The w-test is a test of normality in frequentist statistics. It can be used to identify outliers in measurements under the assumption that measurement errors are normally distributed. The test statistic is defined as follows (Baarda, Reference Baarda1968; Hewiston et al., 2004; Hewitson and Wang, Reference Hewiston and Wang2006):
 $$\omega \lpar i\rpar = \vert v_{i}\vert /\sigma_{v_{i}} = \vert v_{i}\vert /\sigma_{0} \sqrt{S_{ii}} \quad \lpar i = 1\comma \; 2\comma \; \ldots\comma \; n\rpar $$
where v i is the i-th element of v,  $\sigma_{v_{i}} = \sigma_{0} \sqrt{S_{ii}}$ is the standard deviation of v i and ω (i) is the test statistic for the i-th measurement, which has a standard normal distribution in the fault-free case and has a non-central normal distribution in the presence of a fault. The critical value for ω (i) to be tested against is N 1−a/2 (0, 1). If |ω(i)| > N 1−a/2(0, 1), the i-th measurement is assumed to be an outlier. The test is carried out with respect to each measurement; if the maximum value of ω(i)(i = 1, 2, · · · , n) exceeds the critical value, the corresponding measurement is deemed an outlier and is removed from the observation model.
4.2. Correlation analysis methods
The correlation analysis methods are based on the degree of correlation between the measurement error ε and the residual vector v to identify the outlier. According to Equation (9), the relationship between v and  ${\brvarepsilon}$ can be expressed as follows (Tang et al., Reference Tang, Wang and Peng2011):
 $${{\bi v}} = {{\bi S}}{\brvarepsilon} = \left[\matrix{S_{11} & S_{12} &\cdots & S_{1n} \cr S_{21} & S_{22} &\cdots & S_{2n} \cr \vdots &\vdots &\ddots &\vdots \cr S_{n1} & S_{n2} &\cdots & S_{nn}}\right]{\brvarepsilon} = {{\bi S}}_{1} \varepsilon_{1} + {{\bi S}}_{2}\varepsilon_{2} + \cdots + {{\bi S}}_{n} \varepsilon_{n} $$
where  ${{\bi S}}_{i} = \left[\matrix{S_{1i} &S_{2i} &\cdots &S_{ni}}\right]^{T} \quad \lpar i = 1\comma \; 2\comma \; \cdots\comma \; n\rpar $ is the impact vector of the error
 ${\brvarepsilon}_{i}$ on v. This reflects the contribution of measurement errors
 ${\brvarepsilon}_{i}$ to the residuals vector v, that is, if L i contains a gross error
 ${\brvarepsilon}_{i}$ this will be mapped to v through Si. In this case, v is mainly affected by Si. Consequently, the correlation between
 ${\brvarepsilon}$ and v can be replaced by the correlation between Si and v. There are two indicators used to characterise the degree of correlation: correlation coefficient and correlation distance. The calculation formulae for these indicators are (Bei et al., Reference Bei, Gu and Fang2010; Filliben, Reference Filliben1975; Hu et al., Reference Hu, Lu, Cao and Li2014; Tang et al., Reference Tang, Wang and Peng2011):
 $$c\lpar i\rpar = \displaystyle{{\sum\limits_{j = 1}^{n} \lpar S_{ji} - \overline{{{\bi S}}}_{i}\rpar \lpar v_{j} - {{\bi v}}\rpar }\over{\sqrt{\left(\sum\limits_{j = 1}^{n} \lpar S_{ji} - \overline{{{\bi S}}}_{i}\rpar^{2} \sum\limits_{j = 1}^{n} \lpar v_{j} - \overline{{{\bi v}}}\rpar^{2}\right)}}} \quad \lpar i = 1\comma \; 2\comma \; \cdots n\rpar $$
 $$d\lpar i\rpar = \sqrt{\displaystyle{{1}\over{n}} \sum\limits_{j = 1}^{n} \lpar S_{ij} - v_{j}\rpar ^{2}} \quad \lpar i = 1\comma \; 2\comma \; \cdots n\rpar $$
where c(i) and d(i) are the correlation coefficient and correlation distance, respectively.  $\overline{{{\bi S}}}_{i}$ and
 $\overline{{{\bi v}}}$ are the mean values of Si and v respectively. Sji is the j-th element of the Si, and vj is the j-th element of the v. According to the principle of correlation analysis, we take the measurement corresponding to the maximum of the absolute value of correlation coefficient c(i) or the minimum of correlation distance d(i) as an outlier.
The forward-backward fault exclusion methods based on w-test (FDE-w), correlation coefficient (FDE-c) or correlation distance (FDE-d) all show a good performance under the situation of a single fault. However, in the case of multiple faults, the three methods often falsely identify or fail to exclude faults due to the combined effect of multiple faults, and the efficiency is lower. These problems will be illustrated in Section 6.
5. AN IMPROVED METHOD FOR FAULT EXCLUSIONS
As is known, the w-test, the correlation coefficient, and the correlation distance are three methods that can be used to identify faults. In the case of a single fault, the three methods all have a comparatively high correction identification ratio and should have the same identification result. In the case of multiple faults, since the three methods use different test statistics and judgment mechanisms, they might get different identification results. As shown in Table 1, there are three situations that may occur if fault identification is based on the three methods at each time. In Table 1, k1, k2 and k3 indicate the identification results of w-test, correlation coefficient and correlation distance methods respectively.
Three situations that may occur at each time fault exclusion based on the identification results of w-test and correlation analysis methods.

On the basis of a consensus voting strategy (McAllister et al., Reference McAllister, Sun and Vouk1990; Zhao et al., Reference Zhao, Gao, Huang and Wang2015), the w-test, the correlation coefficient, and the correlation distance methods can be used to identify the fault at each time fault exclusion. If the identification results of the three methods meet situation I, then they have a good consistency. In this case, since the correct identification probability of the three methods are higher than the probability of false identification, the probability that the three methods have the same wrong identification result will be very low. So, when the identification results of the three methods meet situation I, the probability that the identification result is a fault will be very high. If the identification results of the three methods meet situation II, only two of the three identification results are consistent. In this case, the probability that two methods have the same wrong identification result will be high. According to the significance test of the correlation coefficient, if the maximum correlation coefficient is significant at a given significance level, then the probability that the corresponding measurement is an outlier is high (Tang et al., Reference Tang, Wang and Peng2011). In order to reduce the probability of a false identification in situation II, the significance of the correlation coefficient can be used as an additional condition. If the w-test and correlation coefficient, or the correlation distance and correlation coefficient methods have the same identification result, and the maximum correlation coefficient is significant, the probability that the identification result is a fault will also be high.
According to the above analysis, we propose an improved fault identification method based on consensus voting of the three methods under situations I and II, and the consensus voting model is given as follows:
 $${Result} = 1 \Rightarrow \left\{\matrix{k1 = k2 & \Vert & k2 = k3 & c\lpar i\rpar_{\max} \geq c_{d} \cr k1 = k2\ & \& & k2 = k3 & c\lpar i\rpar_{\max} \lt c_{d}}\right. $$
where c(i)max denotes the maximum of c(i) and c d is the threshold value with significance level β, which can be calculated by the probability density function of the correlation coefficient (Filliben, Reference Filliben1975; DeGroot and Schervish, Reference DeGroot and Schervish2011):
 $$f\lpar c\rpar = \displaystyle{{\Gamma \left(\displaystyle{{n - 1}\over{2}}\right)}\over{\sqrt{\pi} \Gamma \left(\displaystyle{{n}\over{2}} - 1\right)}} \lpar 1 - c^{2}\rpar ^{\displaystyle{{n - 4}\over{2}}} $$
where Γ is the gamma function. The threshold c d can also be obtained by checking the correlation coefficient table with significance level β and degree of freedom n − 2.
When the identification results of the three methods meet situation III or meet situation II but do not satisfy Equation (20), we cannot determine which identification result of the three methods is indeed a fault. In this case, we exclude the faults by building the fault set {F} and traversing all subsets F{l}(l = 1, 2, …, S). In order to cover all possible combinations of faults and reduce the computation burden as much as possible, the fault set {F} is constructed based on the following principles: as shown in Figure 2(a), a vector f is obtained by first sorting all the observations according to the fault probability that is calculated by:
 $$P_{i} = 1 - \lpar w_{i} + c_{i} + d_{i}\rpar /3n $$
where the subscript i indicates the i-th observation, w i, c i and d i are the index values of the statistics corresponding to the i-th observation in vectors w, c, and d, respectively. The fault set {F} can then be constructed according to f, as shown in Figure 2(b). The size of {F} is S = k − 1 + C(n, k), where k = n − n min and n min is the minimum number of observations required for FDE (for a single satellite system, n min = 5 and for a combined GPS/BDS system, n min = 6).
Schematic diagram of fault set construct.

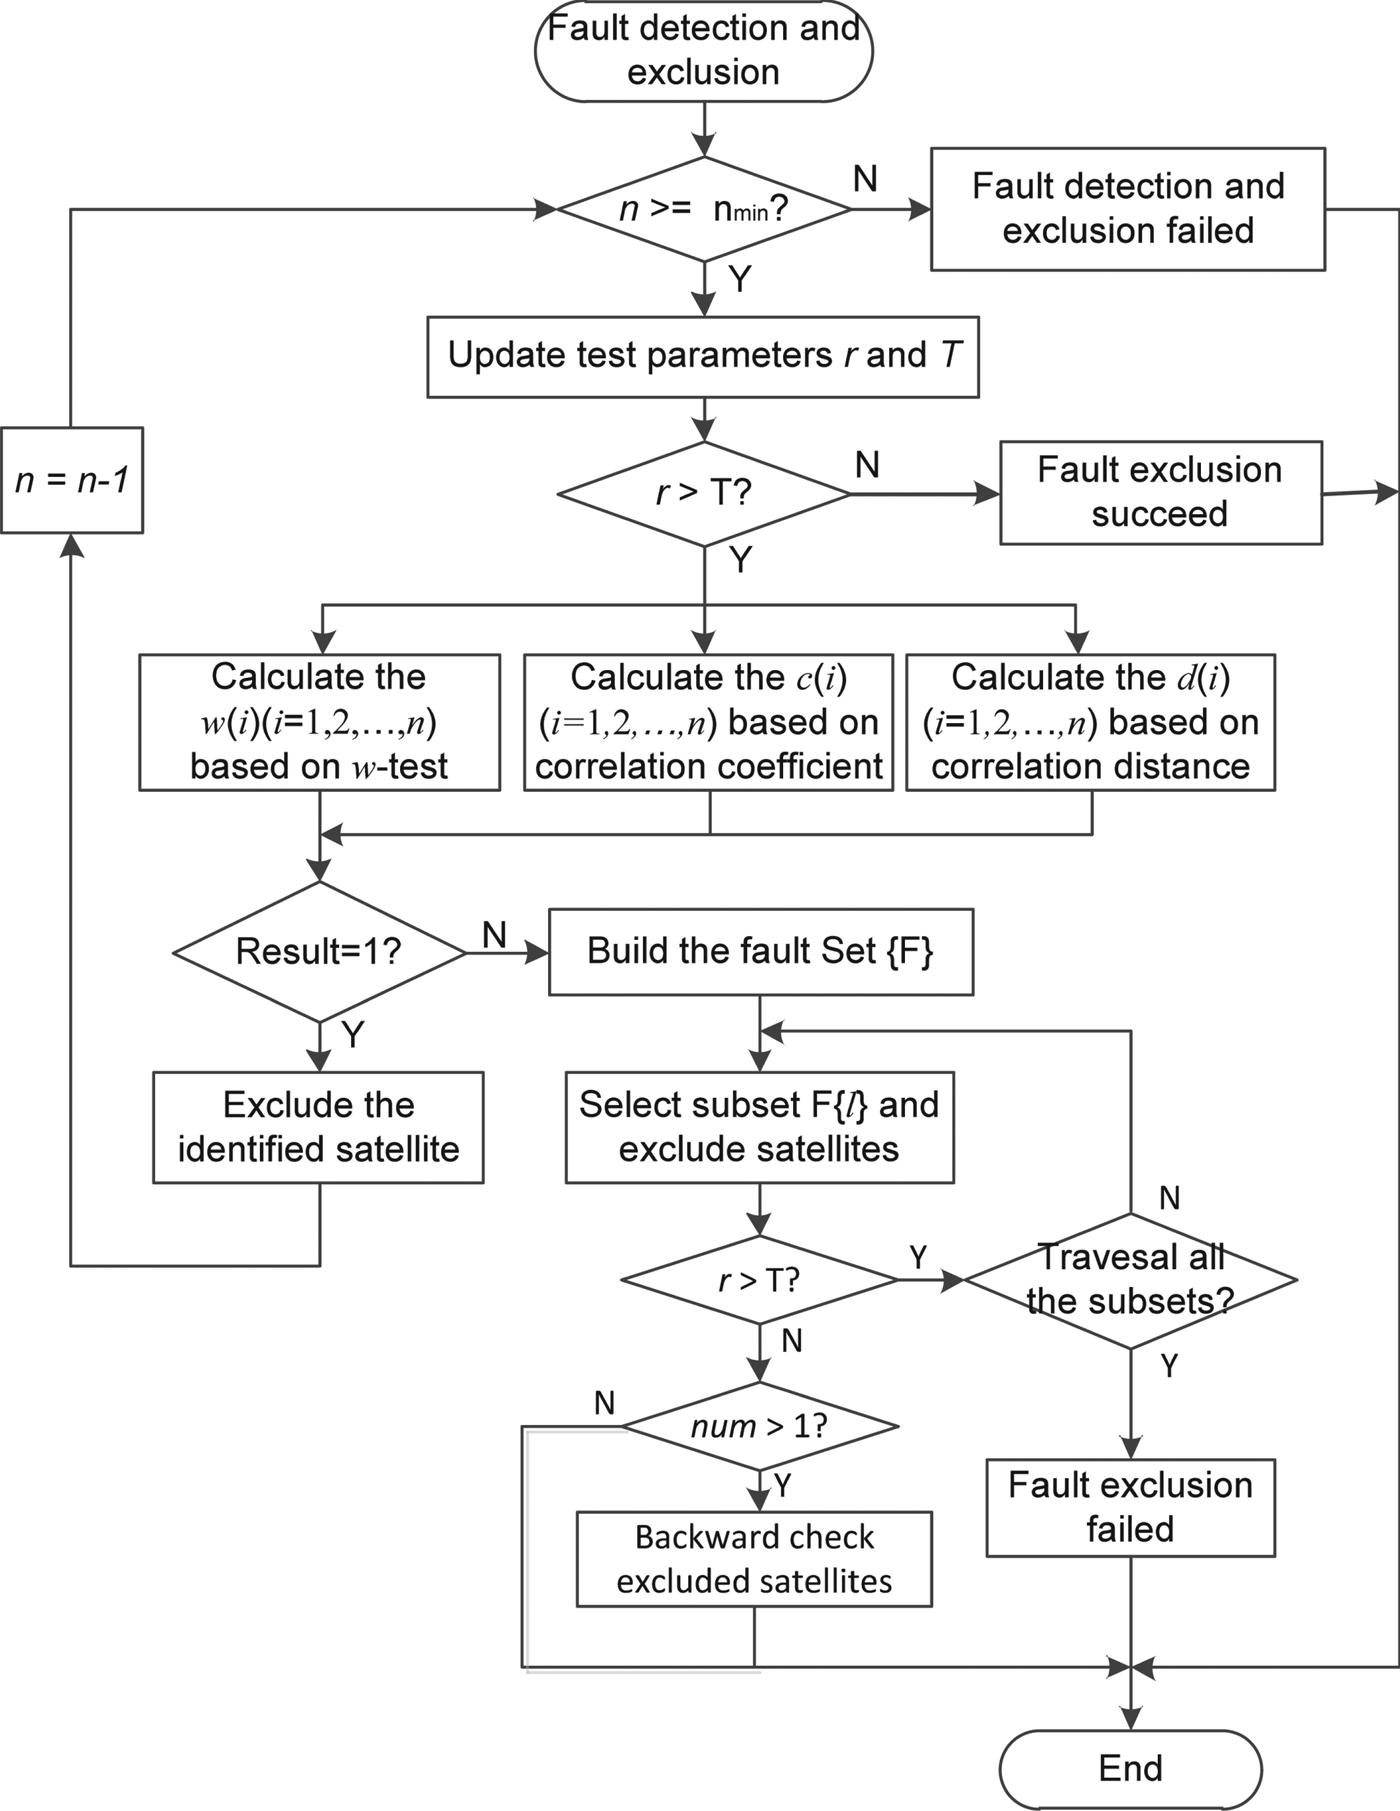
The flow chart of the improved faults detection and exclusion algorithm (FDE-u) is shown in Figure 3. The steps of the algorithm can be described as follows:
Step 1: Determine whether the FDE function is available according to the number of satellites or observations. If n < n min, fault detection and exclusion are unavailable or failed.
Step 2: Fault detection according to Chi-square test. Update the test parameters r according to Equation (11) and detection threshold T according to the Chi-square test table. If r > T, it indicates that some faults are detected. Otherwise, there are no faults detected or faults exclusion succeeded.
Step 3: Faults excluded based on the proposed improved fault exclusion method. If faults are detected by Chi-square test, then calculate w(i), c(i) and d(i) according to Equations (16), (18) and (19) respectively, and sort the w(i)(i = 1, 2, …, n) and c(i)(i = 1, 2, …, n) in descending order to get the vectors w and c, and sort d(i)(i = 1, 2, …, n) in an ascending order to get the vector d.
Steps 4: Faults excluded according to consensus voting model Equation (20). If the identification results of the three methods meet the model Equation (20), exclude the identified fault without checking it backwards, and then go to Step 1 and continue to detect and exclude the other faults.
Step 5: Faults excluded based on fault set {F}. In Step 4, if the identification results of the three methods do not meet the model Equation (20), build a fault set {F} which contains all possible combinations of faults, and then exclude the possible faults according to the subset F{l} obtained from the {F} until r ≤ T or all the subsets are traversed. If r ≤ T and the number of excluded faults num > 1, backward check the excluded satellites or observations. If all the subsets are traversed, and there are still faults, the fault exclusion failed.
Flow chart of the improved fault detection and exclusion algorithm.
6. TEST AND EXPERIMENT ANALYSIS
In this section, we first validate the effectiveness of the proposed consensus voting model by statistical analysis, and then further evaluate the performance of the improved fault detection and exclusion method by comparing the conventional methods based on GPS and BDS data with different simulated numbers of faulty satellites.
6.1. Effectiveness of consensus voting model
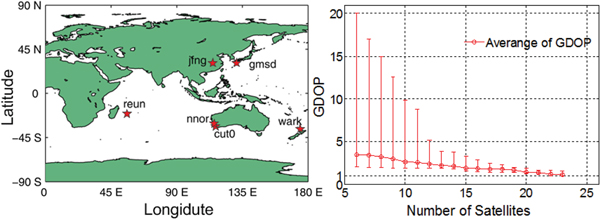
In order to verify the effectiveness of the consensus voting model described by Equation (20), we selected six IGS reference stations with GPS and BDS data. They are the stations JFNG (Wuhan, China), CUT0 (Curtin, Australia), NNOR (Perth, Australia), GMSD (Tanegashima, Japan), WARK (Warkworth, New Zealand) and REUN (Reunion, Indian Ocean). The stations' distribution is shown in Figure 4. The data span used covers seven days from 1–7 January 2017, and the sampling rate was every 30 s. The data sets cover a range of six to 23 visible satellites and Geometric Dilution of Precision (GDOP) from 1·0 to 20.
Stations distribution and data sets covering the number of visible satellites and the corresponding GDOP.

We simulated a different number of outliers for single GPS, BDS and combined GPS/BDS, and used the w-test, the correlation coefficient and the correlation distance methods to identify the outliers. The value of the bias for outliers was set to  $1\cdot5 \nabla b_{i}$, where ∇ b i is the minimum detectable bias of the i-th measurement, which is calculated by Equation (15). Assuming k1, k2 and k3 are the identification results of the three methods at the first-time exclusion, the significance level β is set as 0·01 for the correlation coefficient significance test. We acquired the probabilities that k1, k2 and k3 meet the following three situations in the case of different number of outliers respectively and calculated the corresponding correct probability of identification.
Situation 1: the identification results of the three methods meet k1 = k2 and k2 = k3.
Situation 2: the identification results meet k1 = k2 or k2 = k3, and the correlation coefficient is greater than the detection threshold with significance level  $\beta = 0\cdot01$.
Situation 3: the identification results meet k1 = k2 or k2 = k3, but correlation coefficient is less than the detection threshold with significance level  $\beta = 0\cdot01$.
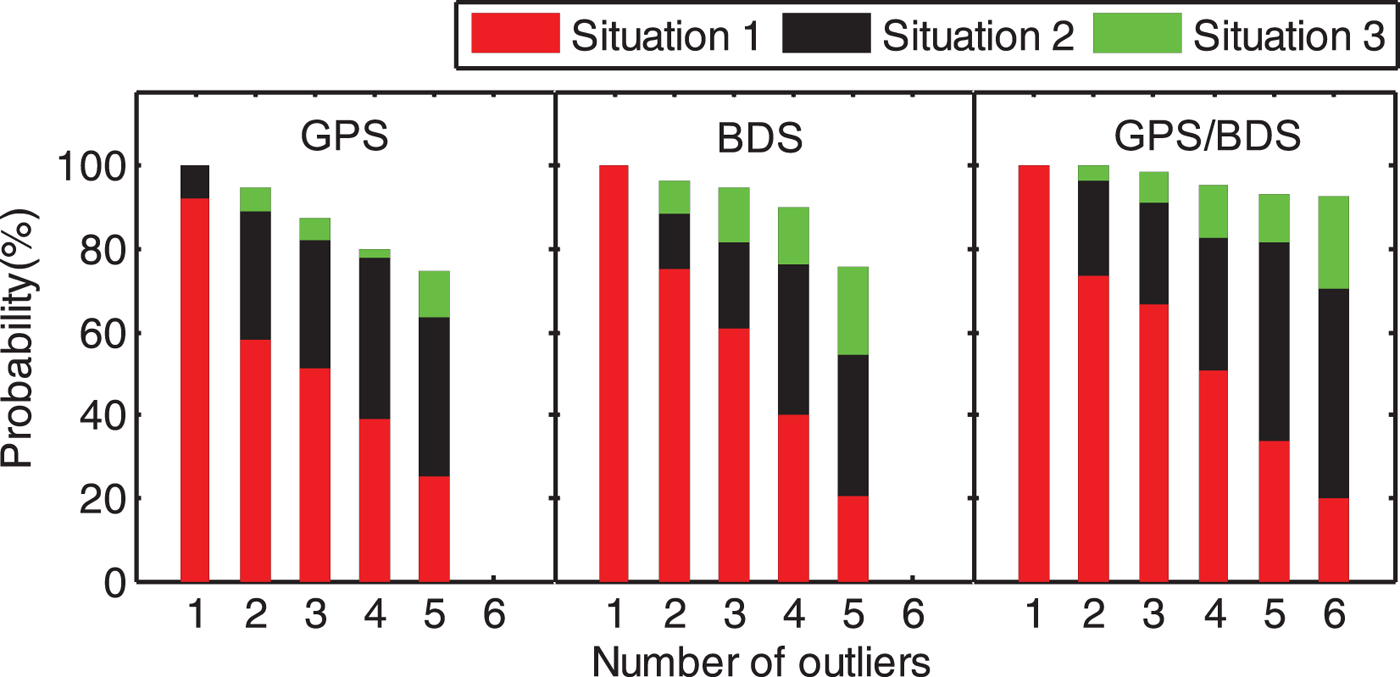
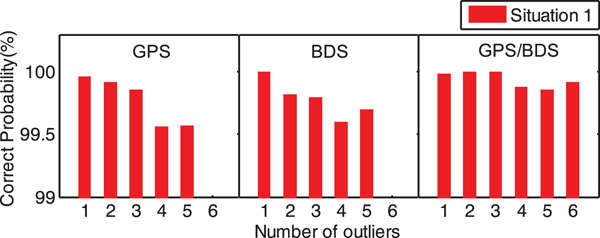
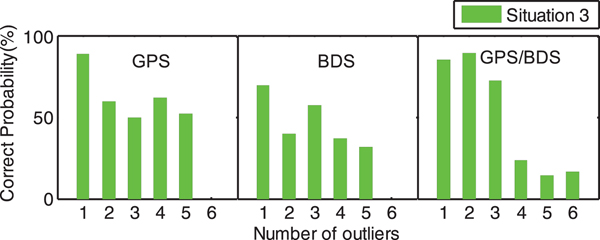
Figure 5 shows that the probability that the identification results of the three methods meet situation 1 decreases with the increases of the number of outliers. Instead, the probabilities that the identification results of the three methods meet situations 2 and 3 increases with the number of outliers. The statistical results show that the consistency of the identification results of the three methods decreases with the increase of the number of outliers. Moreover, the total probability that the identification results of the three methods meet situations 1 and 2 for combined GPS/BDS is greater than for single GPS and BDS in the case of the same number of outliers, which indicates that the consistency of the identification results of the three methods for combined GPS/BDS is better than for single GPS and BDS. The correct identification probabilities in situations 1, 2 and 3 are shown in Figures 7, 8 and 9. It is shown by statistical results that the correct identification probability that the identification results of the three methods meet the situation 1 or 2 are all greater than 99%, while the correct identification probability in situation 3 is in a range from 20% to 95%. So, the fault identification result is reliable when the identification results of the three methods meet either situation 1 or situation 2 that form the consensus voting model. Consequently, the consensus voting model is useful for determining the outliers.
Probability that the identification results of the three methods meet Situations 1, 2 and 3 in the case of different numbers of outliers for GPS, BDS and GPS/BDS.

Correct identification probability based on GPS, BDS and GPS/BDS with different numbers of outliers in situation 1.

Correct identification probability based on GPS, BDS and GPS/BDS with different numbers of outliers in situation 2.

Correct identification probability based on GPS, BDS and GPS/BDS with different numbers of outliers in situation 3.

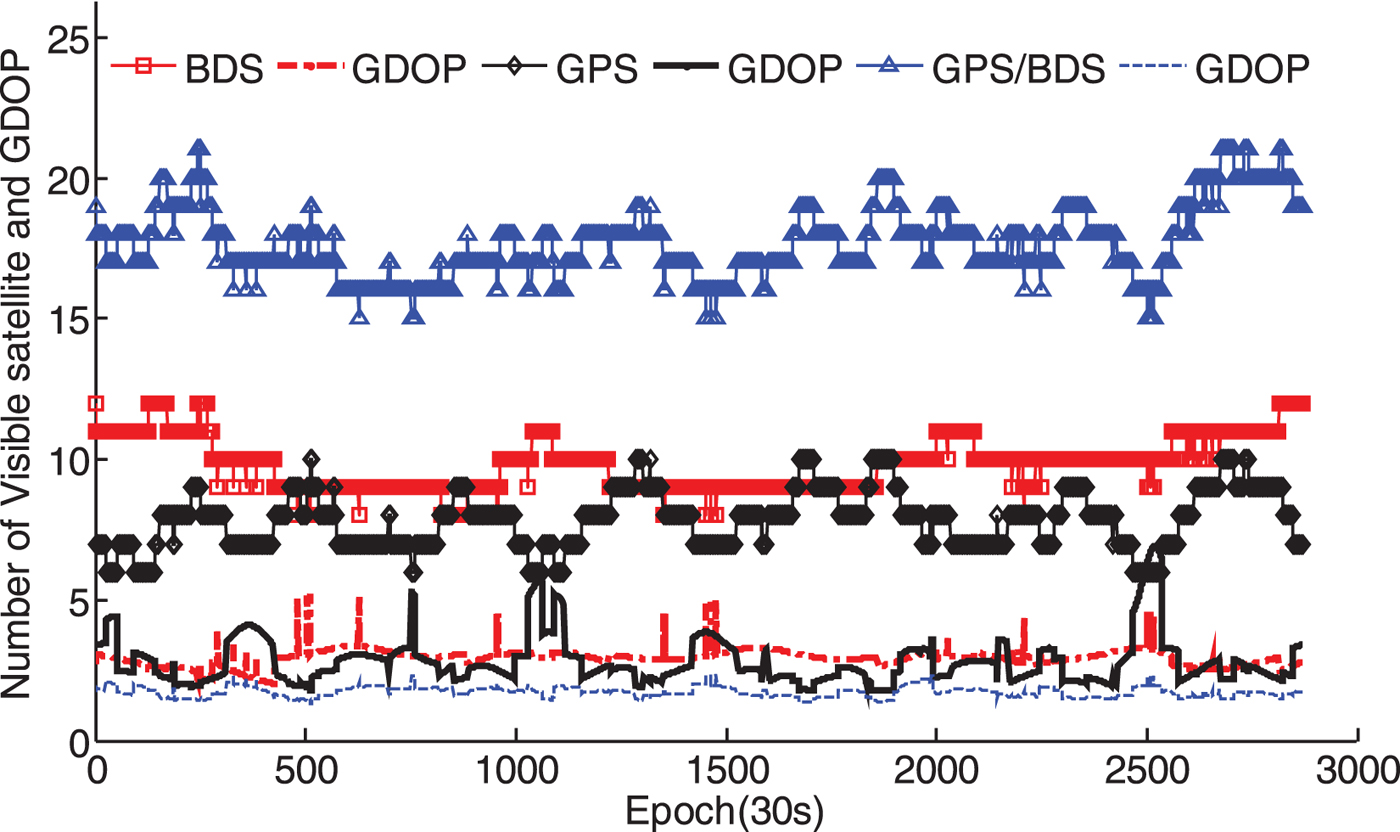
Number of visible satellites and GDOP at each epoch (cut angle 15°).

6.2. Performance test based on real data with single fault
The satellite identifiers of GPS and BDS are from C01 to C32 and C33 to C67 respectively. A real BDS satellite C34 failure occurred on 2 November 2016. Therefore, the data of the day from station JFNG is used to verify the performance of the improved method in the case of a single fault. The number of the visible satellites and GDOP of GPS, BDS and GPS/BDS are shown in Figure 9.
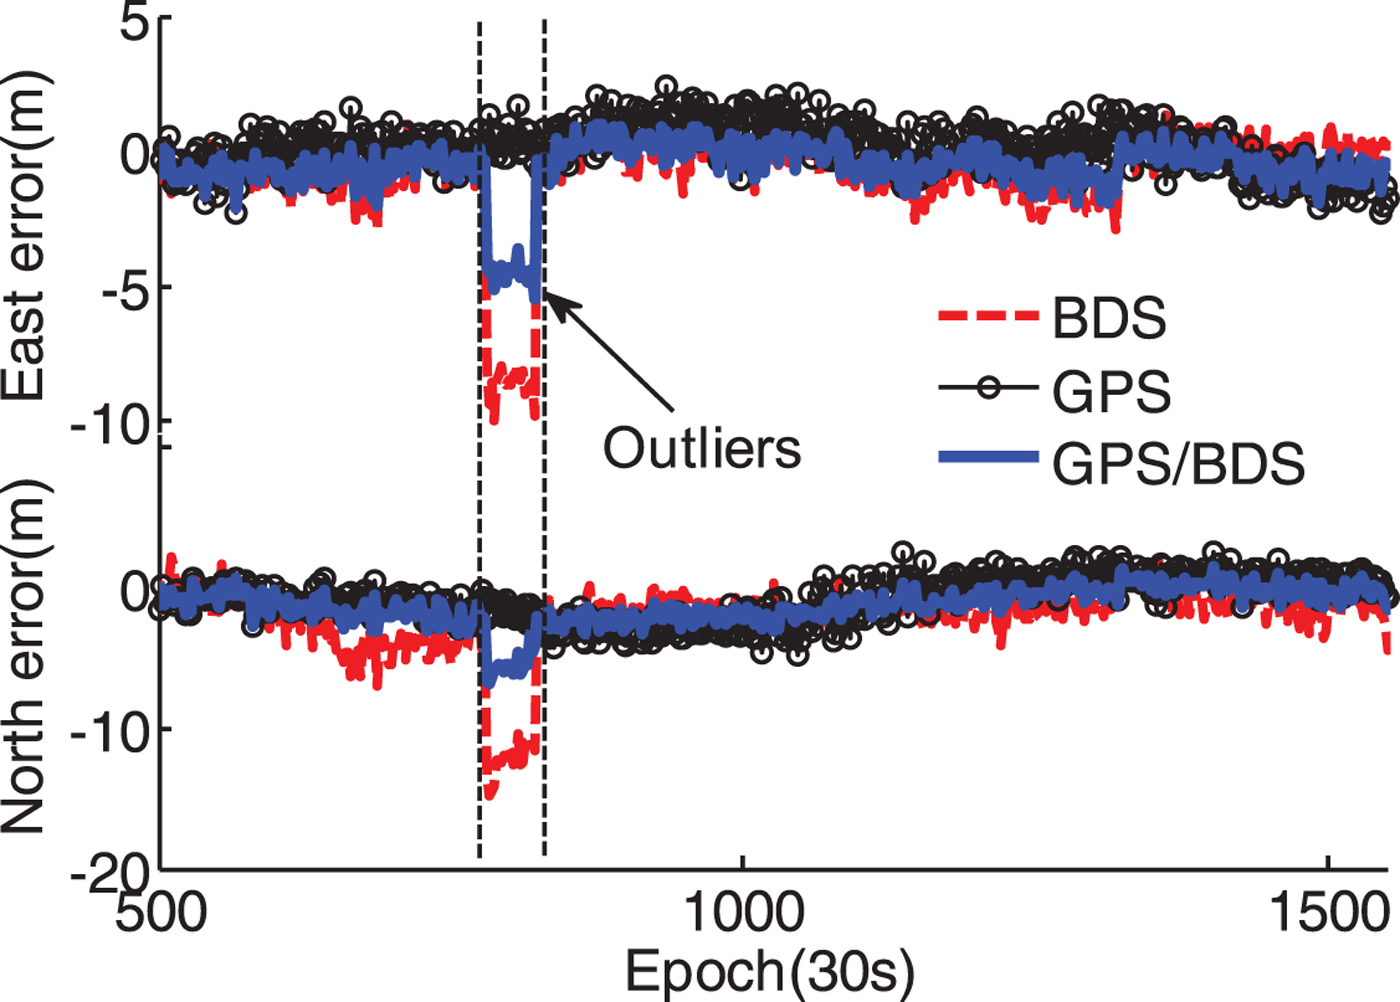
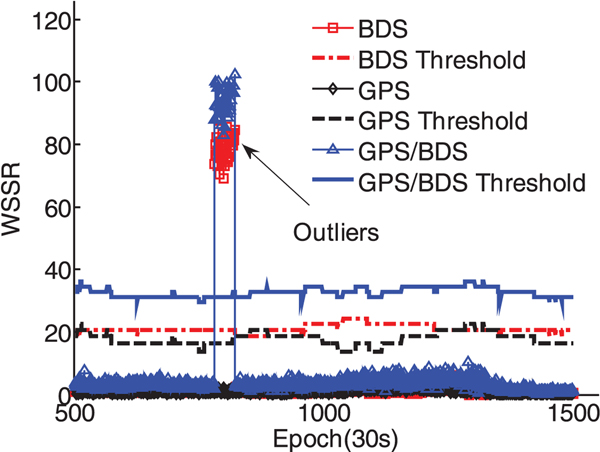
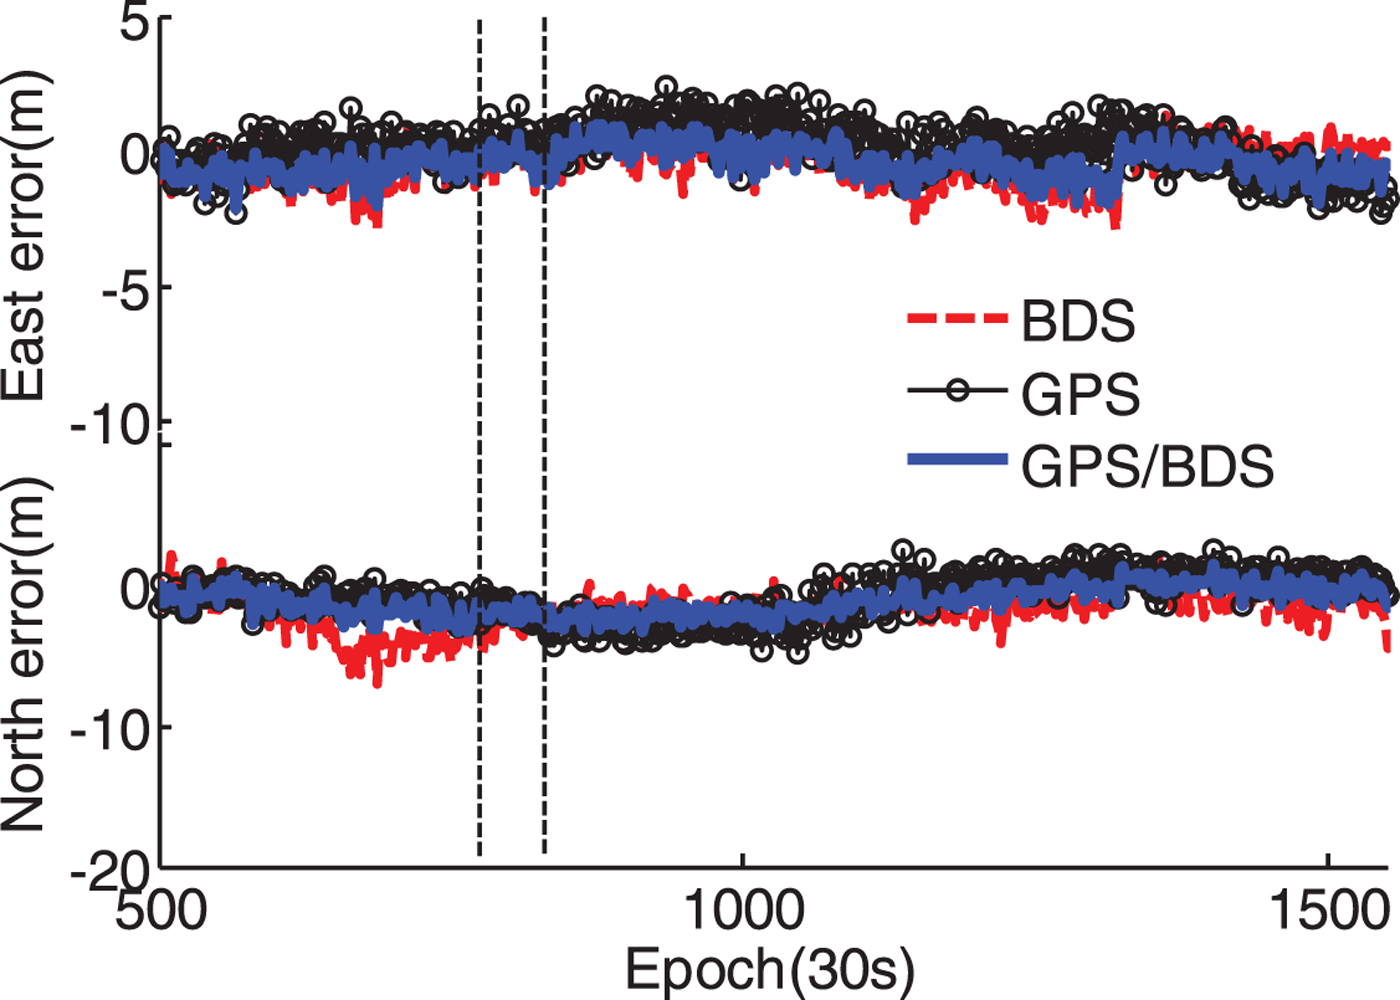
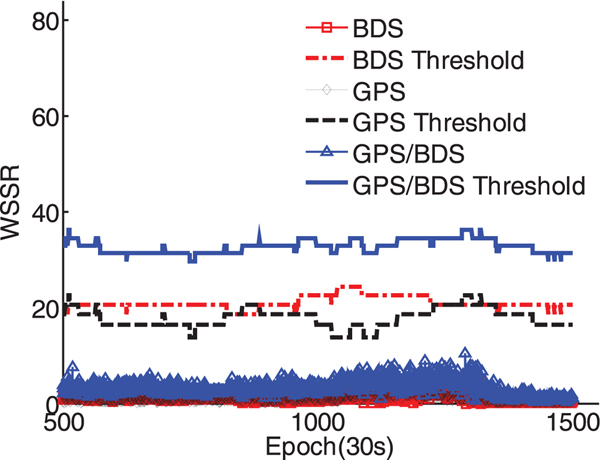
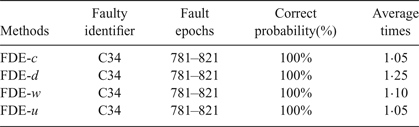
The Chi-square test was used to detect the fault and the significance level a was set to 0·001, namely  $P_{{FA}} = 0\cdot001$. As can be seen from Figure 10, the positioning errors of BDS and GPS/BDS from epochs 781 to 821 have an obvious increase, but the positioning errors of GPS do not show a significant change. In addition, the results of the Chi-square test in Figure 11 show that the WSSR of BDS and GPS/BDS are all larger than the corresponding threshold from epochs 781 to 821. Accordingly, we can determine that there should be a fault in BDS from epoch 781 to 821. Moreover, we can also find from Figure 10 that the positioning accuracy of the combined GPS/BDS is better than that of a single system GPS or BDS due to having more observations in the case of no outliers in observations. However, the positioning accuracy will be reduced when there is a fault in GPS or BDS. So, FDE is important in improving the positioning accuracy. We used the conventional methods and our improved method to detect and exclude the faults, respectively. The identification results, correction identification probability and computation complexity of each methods are listed in Table 2. In order to use statistics easily, the computational complexity is simply represented by the average times of Chi-square test performed to achieve fault exclusion. Figures 12 and 13 show the positioning errors and the results of the Chi-square test after fault exclusion by using the improved method. The results show that the four methods can all identify the faulty satellite correctly. However, FDE-c and FDE-u methods have higher efficiency.
Positioning error sequence in E and N directions for GPS, BDS and GPS/BDS.

Results of Chi-square test for GPS, BDS and GPS/BDS.

Positioning error sequence in E and N directions after fault exclusion by FDE-u.

Results of Chi-square test after fault exclusion by FDE-u.

Identification results and performance of the four methods

6.3. Performance test based on simulation data with multiple faults
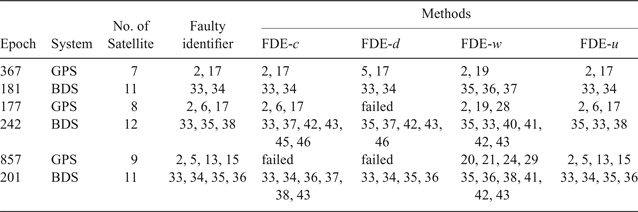
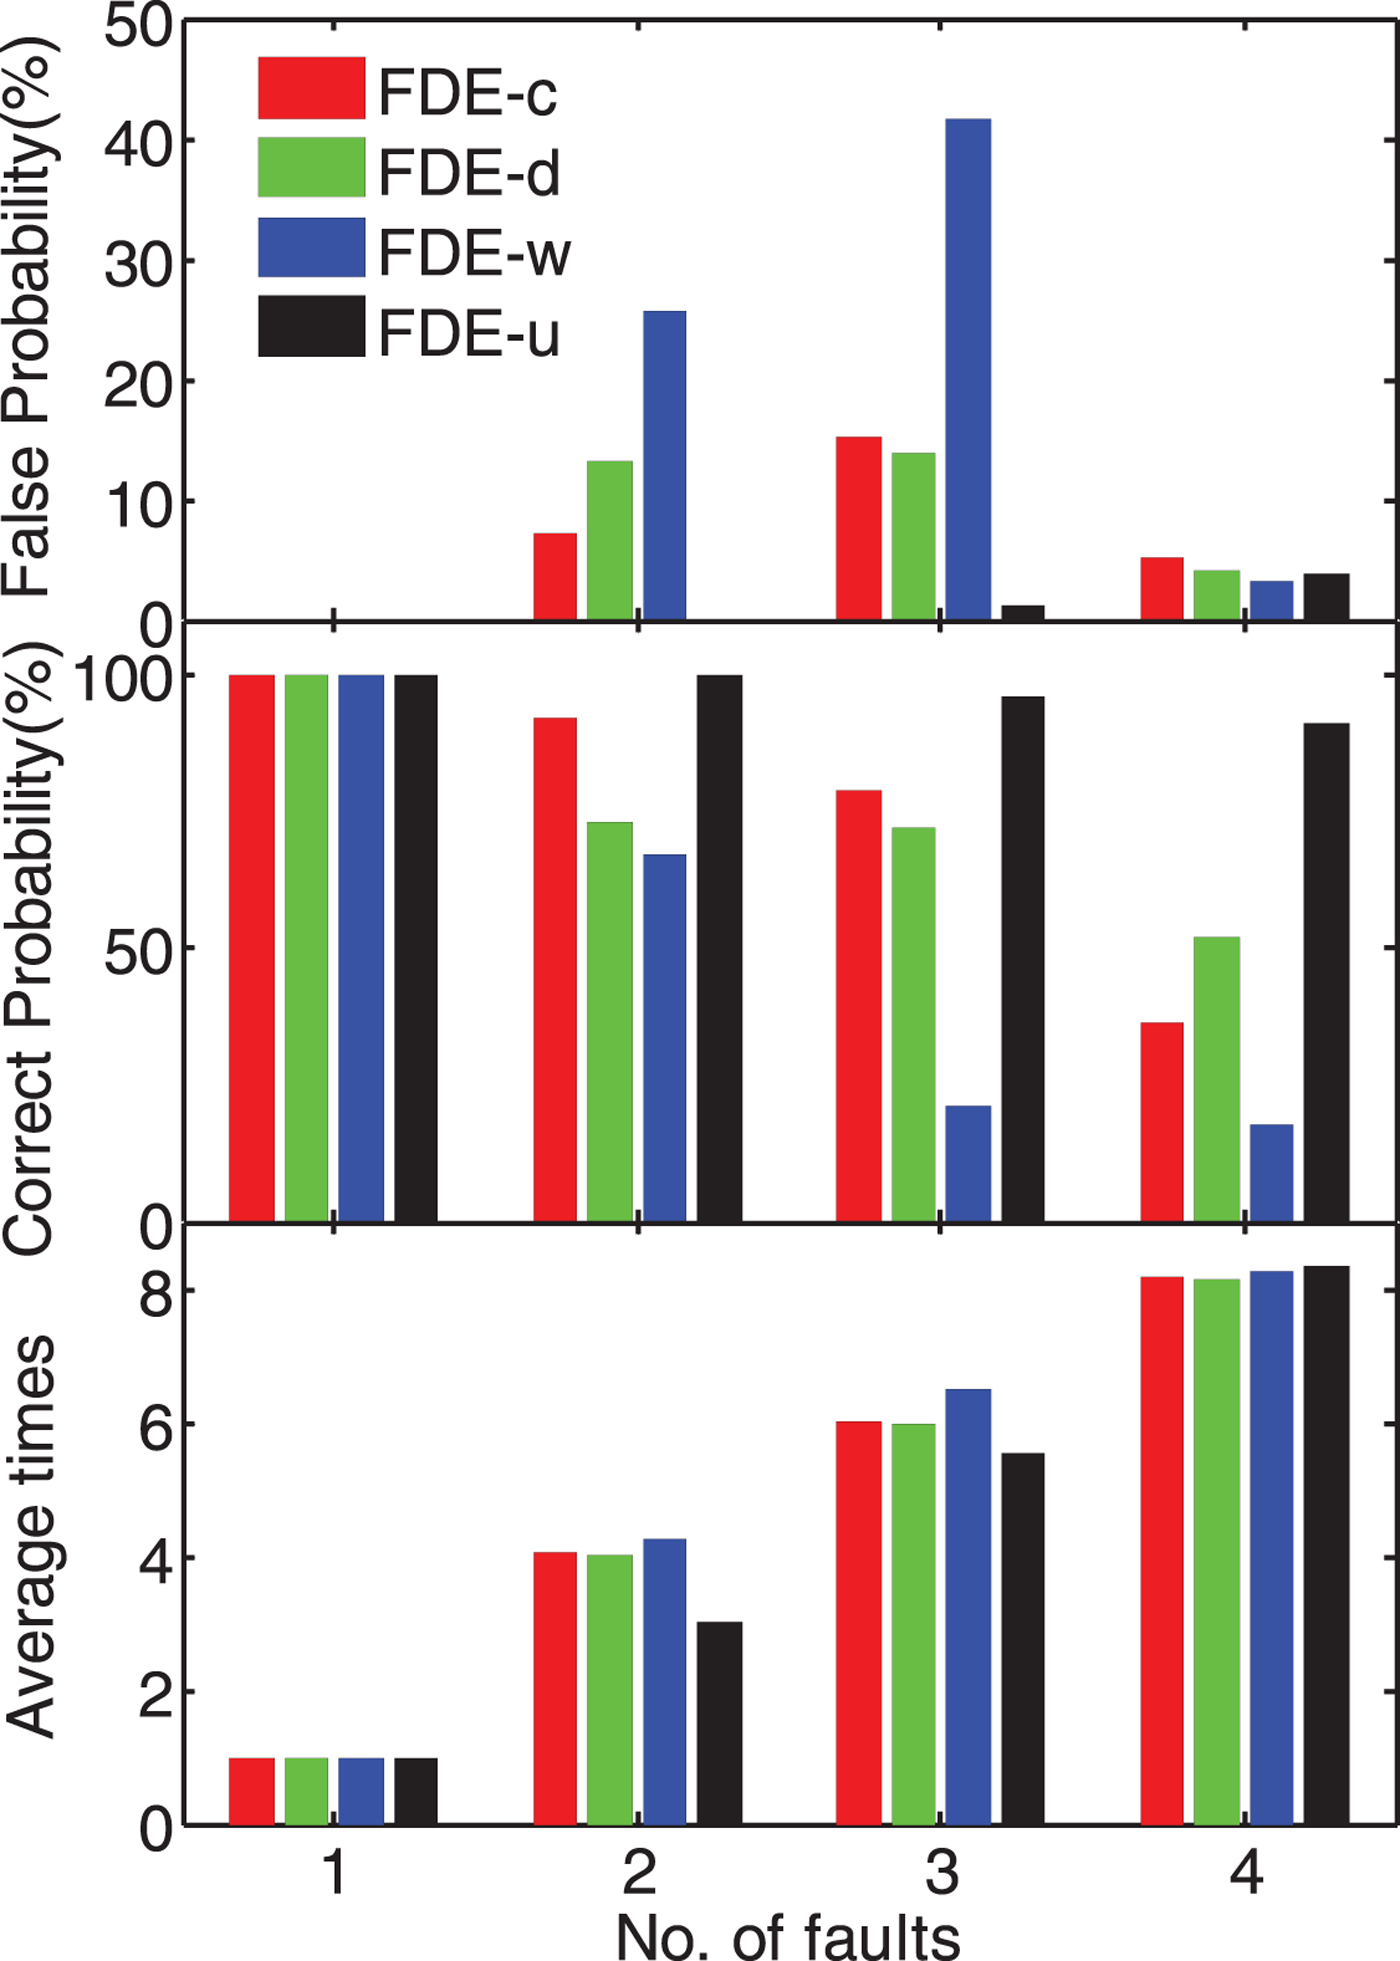
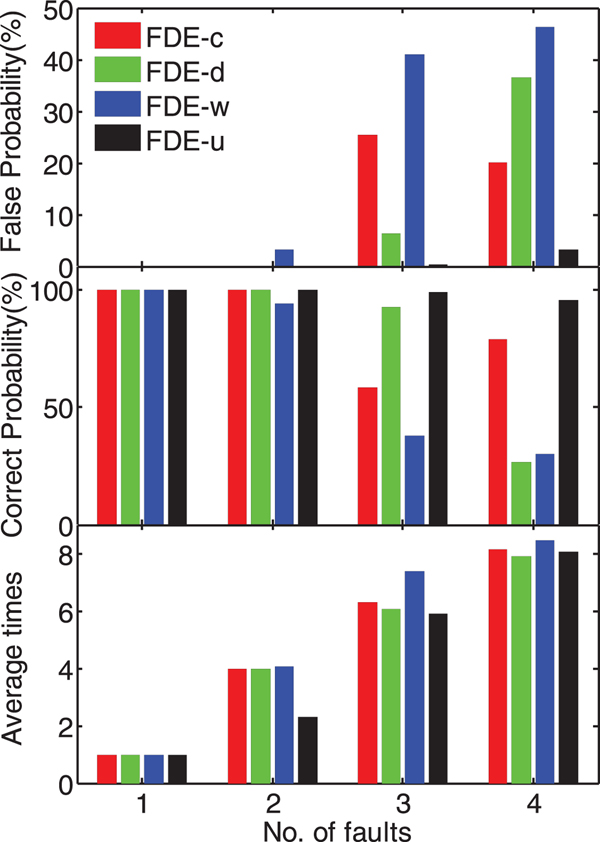
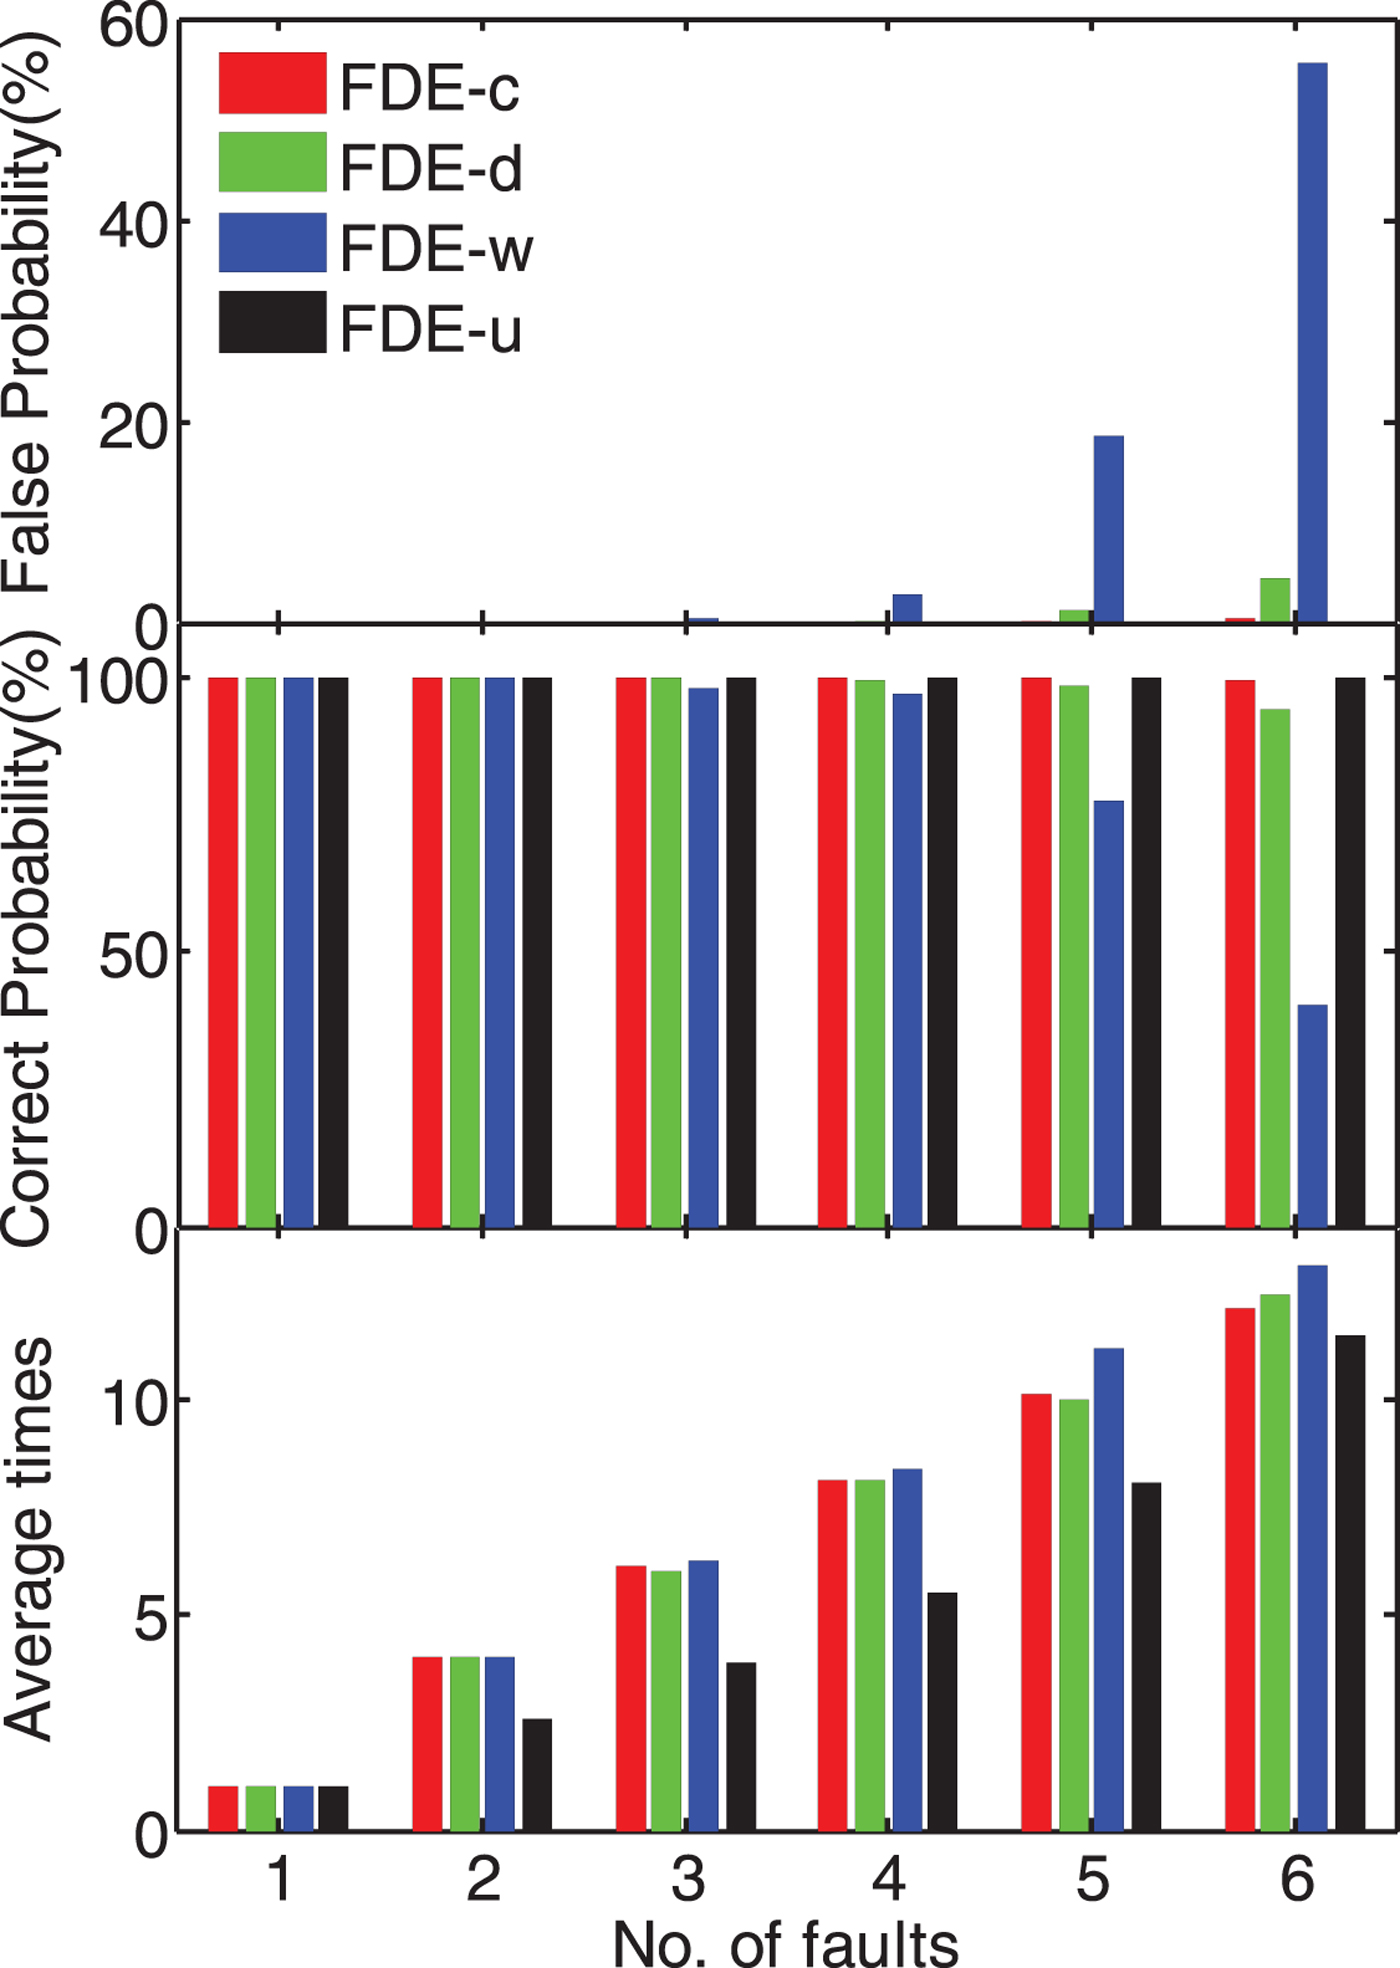
To better understand the performance of the improved method under the condition of single GNSS constellation and multiple GNSS constellations, we used GPS, BDS and GPS/BDS data to test and compare the performance of the conventional methods and the improved method in the case of a different number of faults. In each experiment, we used the Monte Carlo method to simulate the faults and count the false exclusion probability, correct exclusion probability and the computation complexity of each method. False exclusion occurred when the excluded satellites by fault exclusion methods did not all have faults. A correct exclusion is defined as when all the faulty satellites were excluded correctly. The Chi-square test was also used to detect faults and the value of bias for simulated faults was set to  $1\cdot5 \nabla b_{i}$. Table 3 lists the identification results of the four methods at various epochs. The results show that in the case of multiple faults, the FDE-c, FDE-d and FDE-w methods sometimes appeared to yield false identification or failed identification and had different identification results. The correlation analysis methods had a better performance than the w-test method in the condition of multiple faults. Table 4 shows a performance comparison of the four methods with a different number of faults. The symbol “ × ” indicates that there was invalid data.
Identification results of the four methods at various epochs

Performance comparison of the four methods

As can be seen from Table 4 and Figure 14, for the single GPS system, the correct identification probability of the improved method was greater than 99% in the case of two faults, which increased by 8% compared with the FDE-c method. The correct identification probability was greater than 90% with three or four faults. Compared with the conventional methods it increased by 20% to 50%. According to Table 4 and Figure 15, we can find that, for the single BDS system, the correct identification probability of the improved method was nearly 100% in the case of two faults, and the correct identification probability was greater than 95% within three or four faults, increasing 5% to 15% compared with the conventional methods. In addition, Table 4 and Figure 16 show that, for the combined GPS/BDS system, the correct identification probability of the improved method was almost 100% in the case of less than six faults. Comparing with the conventional methods, the computational efficiency of the improved method is reduced by almost half in the case of two faults, but it is not significantly reduced in the case of more than three faults under the condition of the single GNSS system.
Performance of the four methods based on GPS data with different numbers of faults.

Performance of four methods based on BDS data with different numbers of faults.

Performance of four methods based on GPS/BDS with different numbers of faults.

The statistical results show that the correct identification probability decreases and that the computational complexity of the four methods increased with the number of faults. However, under the same condition, the improved method has higher correct identification probability, lower false identification probability and higher efficiency compared with the other three methods. The results also show that the correct identification probability of the improved method based on the single GPS system is lower than that based on the single BDS system. This is because the number of visible GPS satellites is lower than in the case of BDS at a given epoch, resulting in poor redundant observation in some epochs, which can be seen from Figure 9. In addition, the performance of the improved method based on a multiple GNSS system constellation is better than for a single GNSS system.
7. CONCLUSIONS
The conventional RAIM algorithms are theoretically based on the assumption that only one fault happens. They generally have a lower correct identification probability in the case of multiple faults. Although there has been a previous reliability theory for multiple faults, it is effective only in regard to two faults. In the case of multiple faults, the conventional RAIM algorithms often use the forward-backward method based on a w-test or correlation analysis to exclude multiple faults. However, they have a lower efficiency and often give erroneous identifications. This paper presents an improved method for excluding single and multiple faults based on consensus voting using the w-test, the correlation coefficient, and the correlation distance methods, which combines the identification results of the three methods to achieve fault exclusion. If the identification results of the three methods meet the consistency conditions, the probability of false identification will be very low. Therefore, we can determine that the identification result is a fault and exclude it without a need to conduct a backward check. If the identification results of the three methods fail to meet the condition of the consistency check, one needs to traverse the collection of faults to exclude the faults. The method is invalid if all the fault subsets are traversed but there are still faults. The experiment results have demonstrated that the improved method has the same performance as the conventional methods in the case of single fault and has higher efficiency and identification accuracy in the case of multiple faults than conventional methods.
ACKNOWLEDGMENTS
This project is supported by the National Natural Science Foundation of China (Grants No. 41274038, 41574024), the National Science and Technology Major Project of the National Key R&D Program of China (Grant No.2016YFB0502102), the Beijing Natural Science Foundation (Grant No. 4162035), the Aeronautical Science Foundation of China (Grant No. 2016ZC51024) and the Academic Excellence Foundation of BUAA for PhD students.