Introduction
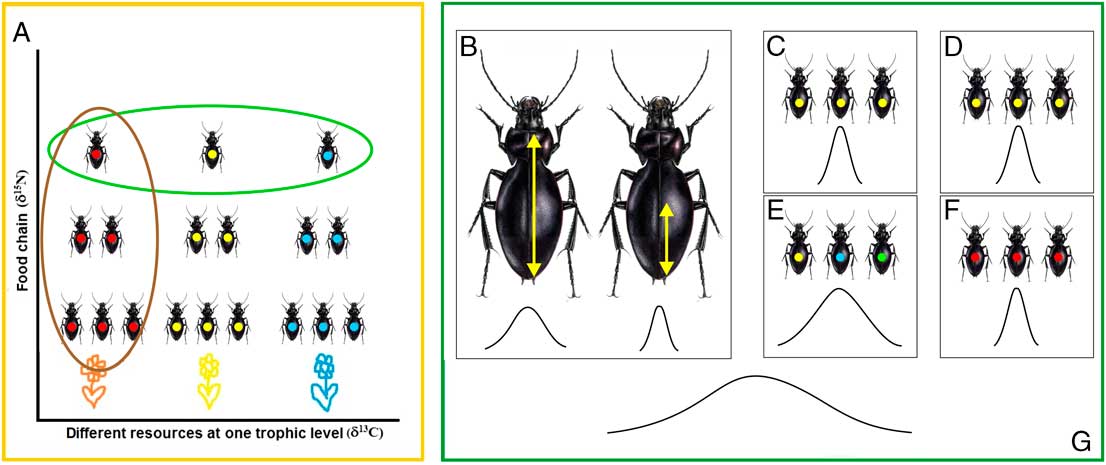
Trophic generalism, the consumption of resources from more than one trophic level and/or of different resources at the same trophic level, is common among predators and its importance for the functioning and stability of food webs has recently gained increasing interest in food web ecology (Coll and Guershon Reference Coll and Guershon2002; Lundgren Reference Lundgren2009). Many terrestrial arthropod predators are such generalists and feed across different trophic levels (Polis and Strong Reference Polis and Strong1996; Scheu and Falca Reference Scheu and Falca2000) turning the respective food chains into trophic webs (Thompson et al. Reference Thompson, Hemberg, Starzomski and Shurin2007) with a mixture of strong and weak interactions. Below we use the terms food chain generalism (feeding at different trophic levels) and trophic level generalism (feeding on different diets at the same trophic level) to distinguish between these two feeding strategies (Fig. 1A).
(A) beetles of the same species exhibiting different types of trophic generalism: food chain generalism (feeding at different trophic levels, brown ellipse) and trophic level generalism (feeding on different diets at the same trophic level, green ellipse). Colours represent different food types. (B) individual trophic plasticity; arrows indicate scale of individual plasticity. Curves indicate variation in food preferences. (C), (D), (E), and (F) variation of food preferences at the population level leading to a high variability at the interpopulation level (G).

Ground beetles (Coleoptera: Carabidae) display high intraspecific variability in resource consumption, and therefore trophic generalism, is very common (Hengeveld Reference Hengeveld1980a, Reference Hengeveld1980b; Lundgren Reference Lundgren2009). For instance, in an accompanying study on stable isotopes, Zalewski et al. (Reference Zalewski, Dudek, Tiunov, Godeau, Okuzaki and Ikeda2014) assigned 17% of the individuals of Carabus nemoralis Müller as being generalist predators, 28% as being phytophages, and 56% as feeding on decomposers or detritivores. Apparently the members of the species are trophic opportunists. Apart from possible genetic predisposition and competitive diet shifts, microhabitat-specific trophic opportunism might cause the observed intraspecific feeding variability.
It is generally not known whether observed trophic generalism, as inferred from multisite samples (Fig. 1), is caused by large individual trophic plasticity (large individual variance in food habits, Fig. 1B), by large diet differences between individuals (large intrapopulation variance, Fig. 1E), or by population-specific differences (large interpopulation variance, e.g., Fig. 1C versus 1E). The latter case would indicate local adaptations or opportunism to habitat peculiarities. All three pathways to trophic generalism are realised in animals (Cody and Diamond Reference Cody and Diamond1975). In ground beetles, individual plasticity (Hengeveld Reference Hengeveld1980a; Korolev and Brygadyrenko Reference Korolev and Brygadyrenko2014) and examples of high intrapopulation (Okuzaki et al. Reference Okuzaki, Tayasu, Okuda and Sota2010) and interpopulation (Sasakawa et al. Reference Sasakawa, Ikeda and Kubota2010) variability are known.
Analysis of variance allows for the partitioning of intrapopulation and interpopulation variance in trophic niche space (Fig. 1). A low degree of generalism is connected to low interpopulation variance (Figs. 1C and 1D) in comparison to the respective intrapopulation variance (a high residual variance in terms of the analysis of variance). Interpopulation generalism implies the opposite pattern, a relatively high variance between populations (e.g., Fig. 1C versus 1E or 1C versus 1F). Interpopulation generalism is linked to high intrahabitat and interhabitat variances and a higher total variance than in the two previous cases. The highest total variance is expected for opportunistic species. Therefore, partitioning of variance at population level in combination with intraspecific comparisons should give hints as to which of the generalism models are realised in a given species (Fig. 1).
Stable isotope analysis is an appropriate tool to assess the position of an individual along the food chain axis as well as along the trophic level axis (McNabb et al. Reference McNabb, Halaj and Wise2001; Michener and Lajtha Reference Michener and Lajtha2007; Martinez del Rio et al. Reference Martinez del Rio, Wolf, Carleton and Gannes2009). The nitrogen isotope composition (15N∕14N, usually expressed as δ15N) increases in insects by about 2.5‰±1.8 (mean±one standard deviation) per trophic level (McCutchan et al. Reference McCutchan, Lewis, Kendall and McGrath2003; Vanderklift and Ponsard Reference Vanderklift and Ponsard2003; Ikeda et al. Reference Ikeda, Kubota, Kagawa and Sota2010) and thus indicates the relative position of an individual within its food chain. Variations in carbon isotope ratio of body tissues (13C∕12C, usually expressed as δ13C) reflects the major type of carbon source that entered the food chain, for example, green plants or decomposer microorganisms (Hyodo et al. Reference Hyodo, Kohzu and Tayasu2010; Potapov et al. Reference Potapov, Semenina, Kurakov and Tiunov2013). Hence the variability in δ13C and δ15N values within focal populations delineates the “isotopic niche” and quantifies the degree of trophic variability (Newsome et al. Reference Newsome, Martinez del Rio, Bearhop and Phillips2007; Layman et al. Reference Layman, Araujo, Boucek, Hammerschlag-Peyer, Harrison and Jud2012).
Here, we use data on the trophic positions of seven common carabid species inhabiting lake island archipelagos in northeastern Poland (Zalewski et al. Reference Zalewski, Dudek, Tiunov, Godeau, Okuzaki and Ikeda2014) to disentangle the various aspects of trophic generalism of ground beetles at the population level. We also link stable isotope ratios of these ground beetles to data on island microclimate and soil characteristics to infer whether trophic positions of island populations correlate with habitat characteristics. These analyses enabled us to answer to three basic questions regarding seven widespread European carabids: (1) How common is food chain and trophic level generalism among studied ground beetles? (2) Is observed population-wide trophic generalism caused by individual trophic opportunism? (3) Do ground beetles form local trophic clusters?
Materials and methods
Study sites and sampling
We sampled 23 sites on 18 lake islands at two lakes in northeastern Poland: Mamry (21º30'–21º52'E, 54º00'–54º10'N) and Lake Wigry (54º00'–54º05'N, 22º01'–22º09'E). The islands vary in size (0.15–38.82 ha) and distance to the nearest mainland (30–375 m). Beetles were captured in two different habitats: humid alder (“Alnion glutinosae” plant association) and lime-oak forests (“Carpinetum betuli” plant association). Alder forests settle along the wet and occasionally submerged banks of the islands. Lime-oak forests grow at higher elevation and comprise a diverse community containing lime (Tilia cordata Miller; Malvaceae), oak (Quercus robur Linnaeus; Fagaceae), pine (Pinus sylvestris Linnaeus; Pinaceae), and spruce (Picea abies (Linnaeus) Karsten; Pinaceae). More detail description of habitats and maps are contained in Zalewski (Reference Zalewski2004) and Zalewski et al.Reference Zalewski, Dudek, Tiunov, Godeau, Okuzaki and Ikeda
On each island and in each habitat we installed a transect composed of 10 pitfall traps (0.5-L plastic cups, mouth diameter 120 mm, plastic roof, filled with pure monoethylene glycol) separated by 10 m. The traps were emptied weekly and animals were preserved in 96% alcohol. This procedure does not influence the isotopic composition of carbon and nitrogen in beetles (Zalewski et al. Reference Zalewski, Dudek, Godeau and Maruszkiewicz2012), however it should be noted that similar procedures affected carbon signatures in some other animals (Tillberg et al. Reference Tillberg, McCarthy, Dolezal and Suarez2006). Emptied traps were refilled with fresh monoethylene glycol. We performed two monthly samplings, during June and August 2010.
At each study site we estimated six environmental factors known to affect the occurrence of ground beetles (Thiele Reference Thiele1977) using standard Ellenberg indicator values (Ellenberg et al. Reference Ellenberg, Weber, Düll, Wirth, Werner and Paulißen1992): temperature, soil fertility (rich/poor in nutrients), soil humidity, soil dispersion (rock/clay), organic material content, and soil pH. This method relies on tabulated environment requirements (given as ranks) of plants according to their response to specific environmental gradients. A local index, for instance of soil humidity, was then calculated by averaging the respective plant indices within the sample. Along each trapping line, a floristic sample of 100 m2 was taken around every second trap. Environmental variability was then estimated from the coefficient of variation (=standard deviation/mean) of Ellenberg values among the five traps in each habitat. Using sufficiently resolved maps we also estimated island size (ha) and isolation (distance from the nearest mainland). Additionally, the type of habitat (humid alder or lime-oak forests) was used to infer the effect of environmental conditions on trophic position and resource use of carabids.
Stable isotope analysis
We studied the seven most commonly captured carabid species populating the archipelagos (Zalewski et al. Reference Zalewski, Dudek, Tiunov, Godeau, Okuzaki and Ikeda2014): Agonum fuliginosum (Panzer), A. obscurum (Herbst), Pterostichus melanarius (Illiger), P. niger (Schaller), P. oblongopunctatus (Fabricius), P. strenuus (Panzer), and Carabus granulatus Linnaeus. All these species are generally considered to be trophic generalists (Lindroth and Bangsholt Reference Lindroth and Bangsholt1985; Ribera et al. Reference Ribera, Foster, Downie, McCracken and Abernethy1999).
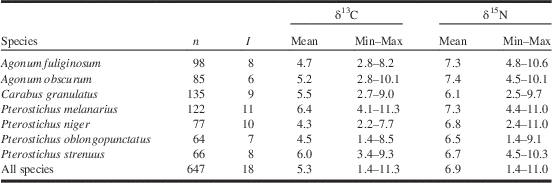
In total we determined the isotopic composition of 561 beetles (Table 1). Beetles were dried in 60 °C for about 70 hours and pulverised. Isotopic analysis is described in detail in Zalewski et al. (Reference Zalewski, Dudek, Tiunov, Godeau, Okuzaki and Ikeda2014). Isotope composition was expressed in delta (δ) units as a deviation from the international standards and recalculated into parts per thousand (‰): δ13C or δ15N (‰)=(Rsample∕Rstandard−1)×1000, where R is the ratio of heavy/light isotope content for the respective element. The international standards were Pee Dee Belemnite for δ13C and atmospheric nitrogen for δ15N.
Total number n of individuals studied, numbers I of islands colonised, and isotopic composition (mean, minimum, and maximum litter-corrected δ13C and δ15N values) of the seven carabid species.

To account for differences in isotopic baseline between different sampling sites, we collected litter samples from each trap line in the vicinity of every second trap (in total five samples per transect) in the middle of June and August 2010. Litter samples were dried at 60 °C for 48–70 hours and analysed following the same protocol as used for beetles. We used the average δ13C values of litter in each habitat (humid alder, lime-oak forests) as the carbon baseline, and the average δ15N values of litter at each sampling site as the nitrogen baseline (see Zalewski et al. Reference Zalewski, Dudek, Tiunov, Godeau, Okuzaki and Ikeda2014 for detailed information on baseline correction). The stable isotope data used in this study have already been published in Zalewski et al. (Reference Zalewski, Dudek, Tiunov, Godeau, Okuzaki and Ikeda2014).
Statistical analysis
To assess species-specific reactions to habitat type and location (island) we analysed the variance of δ15N and δ13C in relation to habitat type and location with the use of a nested analysis of variance (ANOVA). Both “habitat” and “island” variables were considered as fixed effects, wherein “island” was nested in “habitat”. Despite the intuitive perception of habitat as category nested in a given island, here we consider the “habitat” as a broader concept and primary factor (i.e., a region-related set of environmental conditions enabling the occurrence of a spectrum of plant and animal communities). In that sense the “island” is nested in “habitat”. For islands where both habitats were studied, one habitat type was randomly chosen to fit the data set to the nested ANOVA, in which it is assumed that each category of the first factor co-occurs with only one category of the other.
To assess species-specific trophic positions on the 18 islands, we calculated the standard deviations (SD) of the δ13C and δ15N values of each species for each island and compared these with the respective coefficients of variation (CV) of island environment variability, as well as island size and isolation. Note that CV could not be used in the case of isotopic ratios, as these had been additively normalised before analysis.
Because common convex hulls are prone to being heavily biased by outliers, Jackson et al. (Reference Jackson, Inger, Parnell and Bearhop2011) proposed to use the area of the covariance-based PCA eigenvector ellipses calculated from both eigenvalues of the δ13C and δ15N plots (standard ellipse area (SEA)) as an unbiased alternative for assessing differences and overlaps in the trophic niche space (Layman et al. Reference Layman, Arrington, Montanña and Post2007). For each species we calculated all relative distances ∆ in SEAs among each pair of island from
 $$\Delta {\rm SEA=1-}{{{\rm 2{\times}joint}\,{\rm area}} \over {{\rm area1{\plus}area2}}}$$
where area1 and area2 are the respective SEAs of species on each of the two islands.
We used Mantel correlations to refer the species×island ∆SEA distance matrices to the respective distance matrices of habitat characteristics between islands. The latter were calculated from the Euclidean distances of the Ellenberg habitat scores. To relate ∆SEA to island area and isolation, we calculated the Pearson correlations between the island area and isolation and the dominant eigenvector of the respective ∆SEA distance matrix that captured >90% of the variability in ∆SEA for each species.
Results
Intraspecific variability in δ13C and δ15N values was high when assessed by the minimum and maximum δ13C and δ15N (Table 1). Assuming a 2.5‰ increase of the δ15N values per trophic level, all species fed at more than two trophic levels, with P. niger and P. oblongopunctatus feeding at more than three levels. The low δ15N minima of C. granulatus, P. niger, and P. oblongopunctatus, indicate the uptake of plant material (Table 1).
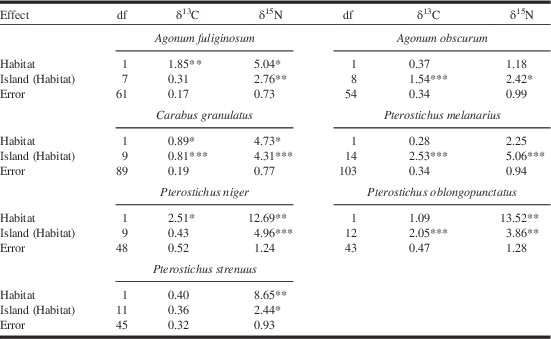
Our analysis of variance (Table 2) revealed significant differences in δ15N values between islands for each studied species. The effect of habitat type on δ15N was less pronounced (Table 2). With respect to δ13C, habitat type and island were less important. However, as with δ15N, island effects were more important than habitat effects (Table 2).
Fixed effects analysis of variance (degrees of freedom (df) and orthogonal mean sums of squares).

Note: Variable “Island” is nested in “Habitat”.
*P<0.05; **P<0.01; ***P<0.001.
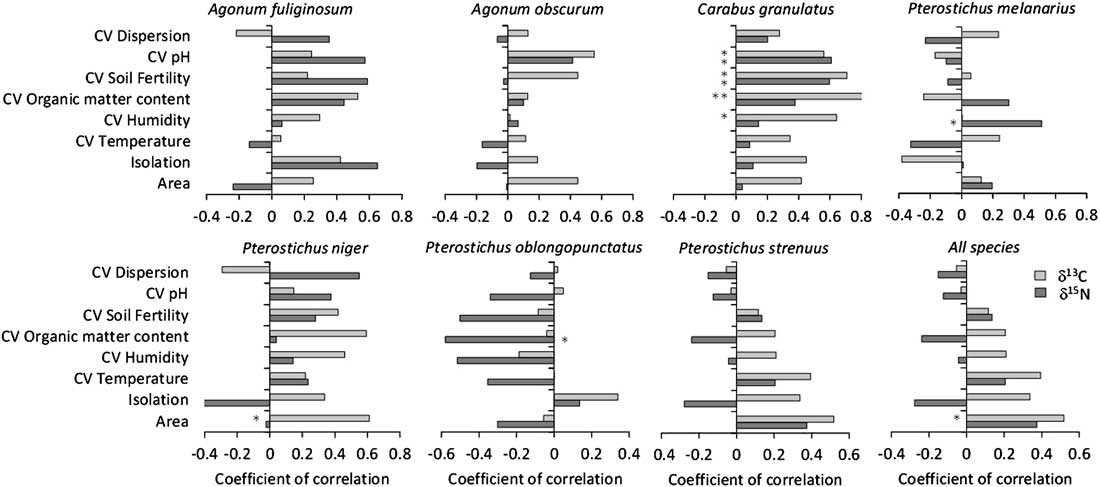
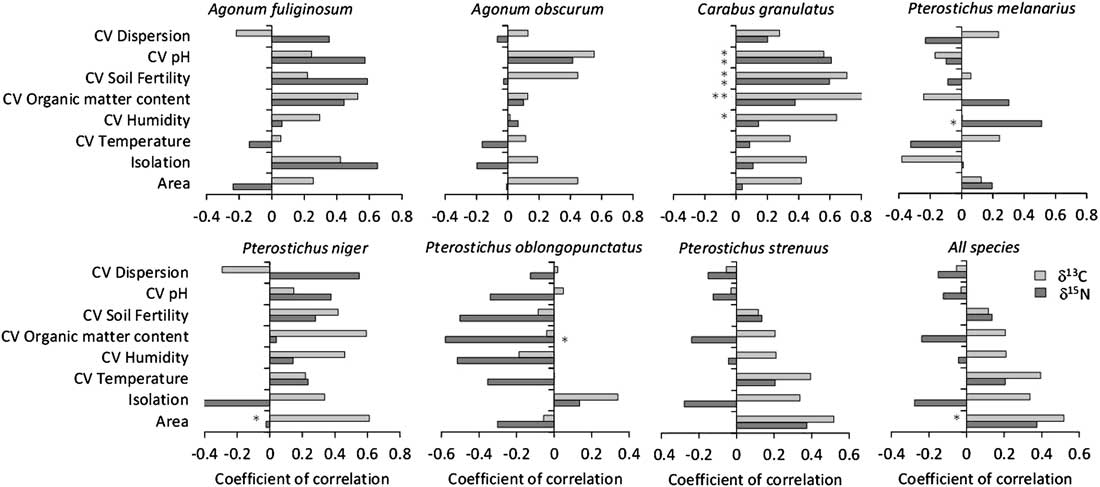
The correlation analysis between the intraspecific variability in δ13C and δ15N values and environmental variability revealed species-specific reactions to environment characteristics (Fig. 2). Although significance levels were low in all comparisons due to the low number of islands colonised by each species (Table 1), we found an overall tendency towards positive correlations in trophic variability and island variability. In the case of C. granulatus, environmental variability explained more than 50% of the variances in δ13C (Fig. 2). With regard to temperature variability, all seven correlations with SD δ13C were positive (Fig. 2; although weakly in A. fuliginosum and P. oblongopunctatum); in the cases of humidity and area, there were six positive correlations. In total, 43 of the 56 single correlations were positive (77%; binomial probability P<0.001). In turn, there was no general signal for a link of the variability in δ15N ratios and variability in island characteristics (Fig. 2).
Pearson correlations between the intra-island variability (coefficient of variation CV) in litter-corrected δ13C and δ15N ratios and island size, isolation, and the respective intra-island coefficient of variation of six soil and climate variables. Parametric significances: *P<0.05; **P<0.01.
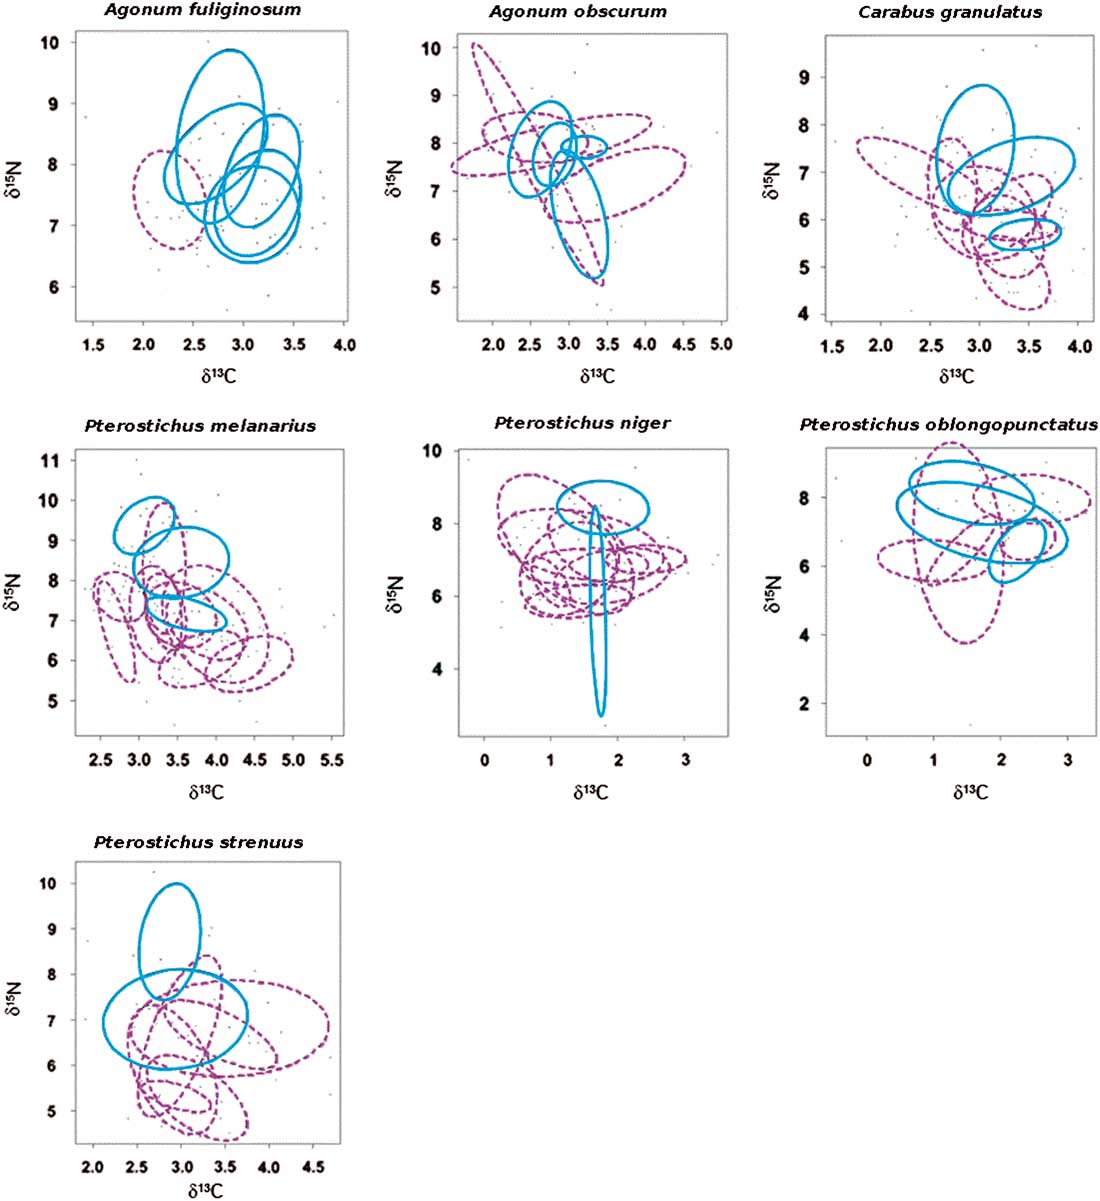
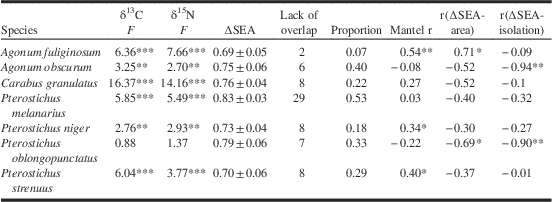
In all species, trophic niche spaces, as assessed by the standard ellipse area (SEA) differed markedly between islands (Fig. 3, Table 3). Average ∆SEA among islands was always >0.5, although between 7% and 53% of island pairs did not overlap in SEA. Mantel correlations showed significant positive correlations of ∆SEA and habitat differences (Table 3) in three species, indicating an increase in the difference in trophic space with increasing habitat dissimilarity. All but one correlation of the dominant eigenvector of the ∆SEA matrix with island area and isolation were negative and thus indicating decreasing differences in trophic niche space with increasing island area and isolation (Table 3).
The variability of isotopic trophic niche space of studied species. Eigenvalue ellipses of isotopic niche space on different islands dominated by humid alder (solid line) and lime-oak forests (dashed line).

Trophic differences between seven ground beetle species on 18 islands colonised.

Note: F-values of one way ANOVA (orthogonal sums of squares) to infer differences in litter-corrected δ13C and δ15N among islands (degrees of freedom of error (n=I) and effect (I=1) in Table 1); ∆SEA: proportional differences Δ in trophic niche space SEA (∆SEA = 1 means no overlap among any of the islands; 0 = full overlap); numbers and respective proportions of island pairs that did not overlap in SEA; the respective Mantel correlations between the ∆SEA distance matrices and the respective distance matrices of Ellenberg environment characteristics; r(∆SEA-area) and r(∆SEA-isolation): the respective correlations of the dominant eigenvector (EV1) of each ∆SEA distance matrix and island area and island isolation.
*P<0.05; **P<0.01; ***P<0.001.
Discussion
Our study divided the trophic niches of ground beetles at the archipelagos scale into the food chain axis (δ15N values) and the trophic level axis (δ13C values) (Duffy et al. Reference Duffy, Vardinale, France, McIntyre, Thébault and Loreau2007). While we deliberately chose species commonly assumed to be trophic generalist, the magnitude of observed differences in δ15N between individuals (Table 1) and populations (Fig. 3) inhabiting adjacent islands was not expected. In turn, residual interpopulation variances for each island were low in all species (Table 2), whereas isotopic niches between islands strongly differed, except for P. oblongopunctatus (Table 3, Fig. 3). These results point to site-specific feeding behaviour. Our results on the variability of δ15N between an island populations (Fig. 3) point therefore to interpopulation generalism, where locally more or less specialised populations occupy different trophic niches depending on habitat peculiarities. Populations were also different with respect to the use of different carbon sources within different habitats, i.e., likely belonging to grazing or detrital food chains (Zalewski et al. Reference Zalewski, Dudek, Tiunov, Godeau, Okuzaki and Ikeda2014), although these differences were low in comparison to the respective differences in trophic level (Table 2, Fig. 3).
Our findings thus point to different and island-specific prey types in the seven species studied. A possible explanation invokes local diet adaptations that are known from insects in fragmented populations. For instance, butterflies can develop island-specific host preferences within the same archipelago (Kuussaari et al. Reference Kuussaari, Singer and Hanski2000). Similar local adaptations in herbivores are known from pea aphids (Ferrari et al. Reference Ferrari, Godfray, Faulconbridge, Prior and Via2006). However, there is no information on similar adaptations in generalist predators. In ground beetles, local adaptations seem unlikely due to the general high gene flow and low genetic differentiation even in highly fragmented landscapes (Sander et al. Reference Sander, Purtauf, Holzhauer and Wolters2006; Lagisz et al. Reference Lagisz, Wolff, Sanderson and Laskowski2010; Drees et al. Reference Drees, Hüfner, Matern, Neve and Assmann2011).
A more parsimonious explanation for the high diet variability between neighbouring islands implies island-specific assemblages of potential prey. If ground beetles were strictly opportunistic, even small differences in prey fauna would cause the observed island-specific differences in isotopic signals. Therefore, we interpret our results as consistent with the opportunist hypothesis, in which predator species have high individual plasticity and adjust their diet to the locally available food. The opportunist hypothesis implies also that variability of δ13C and δ15N values should increase with the number of habitats because more diverse islands are expected to also harbour a more diverse fauna of potential prey. Indeed, in three species (A. fuliginosum, P. niger, and P. strenuus) we found a significant increase in trophic niche differentiation with increasing habitat variability (Table 3). Except for P. oblongopunctatus, intra-island variability in trophic niche was also generally positively correlated with the variability in environmental conditions (Fig. 2). These results are best explained by the existence of habitat-specific feeding patterns as expected by the opportunistic hypothesis.
Overall, we found large variation in the isotopic niches of the studied animals at the archipelago scale (Fig. 3). We are not aware of comparable studies on the variation of trophic position of Carabidae over broader spatial scales. However, Okuzaki et al. (Reference Okuzaki, Tayasu, Okuda and Sota2010), for example, showed large variation between individuals of the same population and during one season (summer or autumn). They demonstrated that the difference between maximum and minimum values in some species could reach 3.8‰ in δ13C and 5.2‰ in δ15N. Because we studied 23 sites in June and August, we probably recorded a large part of the variation of trophic circumstances facing particular species. The trophic opportunism patterns reported here fit information on trophic opportunism of Carabidae obtained with other methods (Hengeveld Reference Hengeveld1980b; Šerić Jelaska et al. Reference Šerić Jelaska, Vaughan, Brown and Symondson2013; Korolev and Brygadyrenko Reference Korolev and Brygadyrenko2014), however the extent of generalism can vary between species even of the same genus (Saska Reference Saska2008). While trophic generalism of carabids is not new (Thiele Reference Thiele1977), the interesting finding is the difference between populations living on adjacent islands and the resulting complex trophic niche structure at the regional scale (Fig. 3).
Ground beetles are often considered as key agents of bio-control, so understanding their real role in the particular food web is of practical importance (Thies et al. Reference Thies, Haenke, Scherber, Bengtsson, Bommarco and Clement2011). If species occupy site-specific trophic niches, they might alter the networks of species interactions. For instance, a species that occupies a high trophic rank in one habitat and a lower rank in another might change its function from a top-down controller to a controlled species. Such habitat-specific functional changes have not yet been reported in ground beetles but are known, for instance, from ants (Gibb and Cunningham Reference Gibb and Cunningham2011) and intertidal snails (Eastwood et al. Reference Eastwood, Donahue and Fowler2007).
Finally, our results show that the interpretation of trophic niche width is scale-dependent. Thus, literature data on the degree of trophic generalisation, for instance those based on limited samples, should be used with caution because the information for specific species might stem from local samples that do not cover the true diet range.
Acknowledgements
The authors thank Ela Zalewska, Tadeusz Plewka, Wojciech Ciurzycki, Paweł Koperski, and Ichiro Tayasu for technical help; and Helena Hercman, Magdalena Maruszkiewicz, Paweł Leśniak, Paweł Zawidzki, for carrying out the isotopic analysis. They are also very grateful to Hiroshi Ikeda and Yutaka Okuzaki who supported our isotopic project in various ways. Jodie Baltazar improved our English. This work was supported by grants from the Polish Science Committee NN 304354538 and NN 304372839.