Implications
Greenhouse gas emissions related to Swedish consumption of animal food increased between 1990 and 2005, by some 22%, whereas product emissions decreased by 14%. In 2005, per capita emissions due to consumption of animal products were 1.1 t carbon dioxide equivalents (CO2e). The long-term climate target for the European Union suggests that total per capita emissions should range from 0.5 to 2.2 t CO2e per year in 2050, and within this range all sectors’ GHG emissions must fit. Since there are limited technological potentials for reducing food-related emissions, changes in consumption patterns also may be required to meet future climate targets.
Introduction
Meat consumption in Europe is twice the world average and for dairy products it is even three times higher. Average European Union (EU) consumption of animal products has increased strongly over the last 50 years and total per capita protein consumption (including vegetable sources) is about 70% higher than recommended (Westhoek et al., Reference Westhoek, Rood, van der Berg, Janse, Nijdam, Reudrik and Stehfest2011). In Sweden, food and environmental agencies have proposed a reduction in meat consumption, considering both health and environmental aspects (Naturvårdsverket, 2011). Friel et al. (Reference Friel, Dangour, Garnett, Lock, Chalabi, Roberts, Butler, Butler, Waage, McMichael and Haines2009) suggested that consuming 30% fewer animal products in high-consumption populations could benefit public health substantially through reduced intake of saturated fat connected with cardiovascular disease and decreased risk of colorectal cancer connected to the intake of red meat.
The food system, and especially animal products, is an important contributor to greenhouse gas (GHG) emissions. Leip et al. (Reference Leip, Weiss, Wassenaar, Perez, Fellmann, Loudjani, Tubiello, Grandgirard, Monni and Biala2010) calculated the EU livestock sector's GHG emissions using a life cycle perspective also including emissions from land-use change (mostly deforestation in South America related to soya bean production) suggesting that the sector emits close to 9% of the EU's total GHGs (13% if land-use change is included). In another study of consumption and GHG emissions in the EU, meat and dairy products were singled out as responsible for a significant share of the food sector's impact; according to the EU Environmental Impact of PROduct project, meat and dairy products contribute to 14% of potential global warming (land-use change not included) caused by all consumption in the EU while only providing 6% of the economic value (Weidema et al., Reference Weidema, Wesnaes, Hemansen, Kristensen and Halberg2009).
Globally, agricultural GHG emissions increased by 14% between 1990 and 2005 (Smith et al., Reference Smith, Martino, Cai, Gwary, Janzen, Kumar, McCarl, Ogle, O'Mara, Rice, Scholes, Sirotenko, Howden, McAllister, Pan, Romanenkov, Schneider and Towprayoon2007). During these 15 years, the former Soviet Union and European countries showed a decrease in emissions, whereas the rest of the world had a steady increase (Smith et al., Reference Smith, Martino, Cai, Gwary, Janzen, Kumar, McCarl, Ogle, O'Mara, Rice, Scholes, Sirotenko, Howden, McAllister, Pan, Romanenkov, Schneider and Towprayoon2007). Analysis of emission trends from agriculture often excludes use of fossil energy and production of fertilisers since these activities are reported in other sectors due to the reporting format for National Inventory Greenhouse Gas Reports from the United Nations Framework Convention of Climate Change. Since available statistics omit some emissions, studies of emission trends in food production including all GHG emissions are rare, and when it comes to trends connected to changing consumption patterns, current knowledge is limited.
This knowledge gap was a major motive for this study, which had as overall purpose to analyse the development of GHG emissions from production and consumption of animal products in Sweden between 1990 and 2005. During these 15 years, all animal production, except chicken meat decreased in volume. The period is characterised by a strong concentration and specialisation: the number of farms with pigs and layer hens decreased by 80% and 60%, respectively, and the number of dairy farms decreased by 65%. Sweden is a highly industrialised country, and agriculture's contribution to gross domestic product was only 0.4% in 2005. Between 1990 and 2005, meat consumption strongly increased (due to meat imports), whereas consumption of dairy products and eggs remained stable.
The purpose of this paper is to
– Estimate trends in GHG emissions due to production and consumption of animal products in Sweden;
– Analyse factors explaining these trends;
– Discuss possible policy implication for agriculture and food consumption on the feasibility of the EU's long-term climate-change mitigation commitment.
Material and methods
Data acquisition
Average Swedish production data
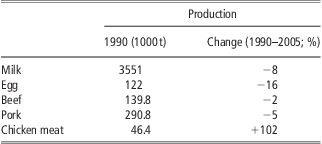
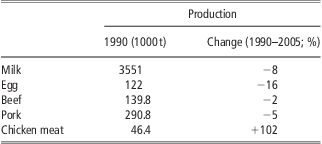
The production data used in this study representing average Swedish animal production (pork, chicken meat, beef, dairy and eggs) in 1990 and 2005 were taken from national GHG estimates for 1990 and 2005 presented by Cederberg et al. (Reference Cederberg, Sonesson, Henriksson, Sund and Davis2009a). These data, which derived from national accounts and statistics, were complemented with information from advisory services, research reports and agricultural businesses and used when calculating the life cycle GHG emissions from animal production until the farm-gate. Changes in production volumes are shown in Table 1.
Production volumes (1000 t) in 1990 and relative volumes in 2005
Emissions from consumption
Average GHG emissions from consumption of animal products in Sweden were calculated based on national food consumption statistics and the products’ carbon footprints (CFs), here defined as the sum of GHG emissions per kilogram product delivered at the retailer. The CFs of Swedish animal products were based on the farm-based GHG emissions presented by Cederberg et al. (Reference Cederberg, Sonesson, Henriksson, Sund and Davis2009a) and added emissions from post-farm activities (transports and food industry) estimated by Cederberg et al. (Reference Cederberg, Flysjö, Sonesson, Sund and Davis2009b). For imported meat, dairy and egg products, data on GHG emissions were collected from international publications. Consumption of beef and chicken meat in particular strongly increased, see Figure 1, this was supported by meat imports.
Total Swedish consumption (tonnes of meat with bone, carcass weight (CW)) of pork, chicken meat and beef in 1990 and 2005 (staples) and per capita consumption in numbers above staples (kg CW per capita).

Methodology
The method used was life cycle assessment (LCA), an environmental assessment tool standardised according to International Organization for Standardization (ISO) 14040 (ISO, 2006a) and 14044 (ISO, 2006b). LCA is traditionally used to analyse the environmental impact from the entire life cycle of a product, that is, from ‘cradle to grave’, including all resources used and all emissions to air, soil and water. In this study, only GHG emissions were considered.
The LCA software SimaPro 7 (PRé Consultants bv, 2010) was used for calculations. The global warming potential was calculated for a 100-year time horizon according to Intergovernmental Panel on Climate Change (2007), in kilogram carbon dioxide equivalents (CO2e): carbon dioxide (CO2) = 1, methane (CH4) = 25 and nitrous oxide (N2O) = 298.
GHG emissions were calculated per kilogram of product at the farm-gate when analysing emission trends in production. The products were: 1 kg meat as carcass weight (CW) for pork, chicken and beef; 1 kg cow milk as energy corrected milk (ECM) and 1 kg eggs. When analysing consumption, GHG emissions (product CF) were calculated per kilogram of product at the retailer: for meat as 1 kg CW (pork, chicken, beef); for dairy products as 1 kg of fresh dairy product (milk, yogurt and cream), 1 kg cheese, or 1 kg milk powder; and for eggs as 1 kg egg.
Allocation
GHG emissions from milk production until the farm-gate were allocated as 85% to milk and 15% to the beef co-product (surplus calves and meat from culled cows), which is based on a physical relationship of feed-intake requirements to cover dairy cow milk production, maintenance and pregnancy (International Dairy Federation, 2010). Economic allocation was used to divide GHG emissions between main products and co-products used in concentrate feed production, for example, rapeseed oil for the food industry and rapeseed meal for feed. Manure was not considered a co-product but assumed to be used in feed production, although livestock farms sometimes export manure to arable farms. All emissions from handling and application of manure were included.
In slaughter and dairy industries, by-products such as hides, intestines and whey are generated. None of the calculated GHG emissions were distributed to these co-products due to their low economic value, which overestimates emissions for meat products slightly but has no effect on the emission trends analysed here.
System boundaries
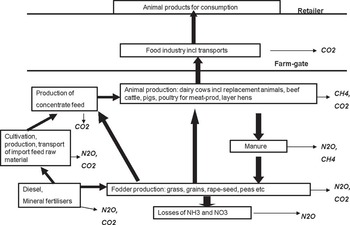
The system boundary in the study of animal production was ‘cradle-to-farm-gate’ (Figure 2). All major emissions of CH4, N2O and CO2 associated with input products and processes used in animal production were accounted for, from extraction and refinement of raw material until the meat, milk and eggs were delivered from the farm. Some minor emissions (contributing <1% of total emissions) were omitted, for example pesticides, detergents and medicines. Emissions associated with the construction of agricultural buildings and machinery were not included, but capital goods for transport and energy were included. GHG emissions associated with land use and land-use change (LULUC) were not included due to lack of consensus in methodology.
Production systems studied and greenhouse emissions accounted for in the study.

For emissions related to consumption, GHG emissions from retailers and shops, consumers (shopping transport and food storing/preparation), packaging and food-waste handling were not included. This is because the focus of the study was to compare and analyse trends of GHG emissions from production and consumption of animal products between 1990 and 2005, and earlier studies show that for animal products, the later parts of the supply chain are of minor importance to the overall emission picture. The system boundary in the study of GHG emissions from consumption is ‘cradle-to-retailer’ (Figure 2).
When estimating the total GHG emissions from meat consumption, meat from lamb, horse, game and reindeer were not included due to lack of data of emissions from these products. However, consumption of these meat products is very low in Sweden; pork, beef and poultry meat analysed in this study make up almost 95% of total consumption.
Data collection
Feed consumption
Data on feed intake were primarily based on national statistics and complemented with data from the literature and discussions with feed experts. Agricultural statistics provide information on all ingredients in concentrate feed sold from the feed industry to livestock farms but added to this is grain cultivated on animal farms or neighbouring farms and consumed directly by livestock, that is, not registered in national statistics. Total feed grain consumption for each livestock sector was calculated with the help of feed experts in the advisory service and summed, and the total volume was corrected against the national balance sheet of grain resources that state the amount of total grain used as feed. Around 55% of the Swedish grain production is used in animal production, with small changes between the two studied years, but with lower total grain-production volumes in 2005 compared with 1990. In 2005, total feed intake was estimated to roughly 4 kg/kg CW for pork and 3.1 kg/kg CW for chicken meat, which was 15%, respectively, 9% lower than in 1990. Concerning egg, no changes in feed intake was found during the studied period and amounted to roughly 2.5 kg/kg egg. Thorough data on all ingredients and volumes of concentrate feed in the Swedish livestock sector are found in Cederberg et al. (Reference Cederberg, Sonesson, Henriksson, Sund and Davis2009a).
Around 35% to 40% of Swedish arable land is grown with grassland (mainly leys) with a normal longevity of 3 to 4 years. This land base provides roughage fodder for beef and dairy cattle, a growing horse sector and minor sheep production. Because fodder is used directly on farms, rarely weighed by farmers and sometimes grazed, consumption levels are therefore difficult to quantify. The dairy sector has relatively high-quality data on roughage fodder intake since the national advisory service surveys a significant percentage of Swedish dairy farms (Henriksson et al., Reference Henriksson, Flysjö, Cederberg and Swensson2011). Data on roughage consumption in beef production are sparse, and the variation among farms is larger than that among dairy farms. Due to uncertainties in the statistics and input data on consumption of roughage fodder, input data were therefore not calculated per kilogram of feed but instead per hectare of grassland used in dairy and beef production. Total grassland areas in Sweden were quantified and divided between dairy, beef, sheep and horses based on estimations of roughage fodder intake and expert judgements (see Cederberg et al., Reference Cederberg, Sonesson, Henriksson, Sund and Davis2009a). Estimated total grassland area consumed for dairy and beef was slightly higher in 2005 (7 87 000 ha compared with 7 67 000 ha in 1990) of which the dairy sector accounted for 75% in 1990 and 54% in 2005.
Feed components in concentrate feed (grains excluded) were classified as by-products from the cereal industry, by-products from the sugar industry, proteins (e.g. soya meal, rapeseed meal), fatty acids (also palm-kernel expeller), others or minerals. LCA data for these ingredients were collected from different sources, in particular a Swedish LCA database for food production (Flysjö et al., Reference Flysjö, Cederberg and Strid2008; Cederberg et al., Reference Cederberg, Sonesson, Henriksson, Sund and Davis2009a).
CH4 from enteric fermentation
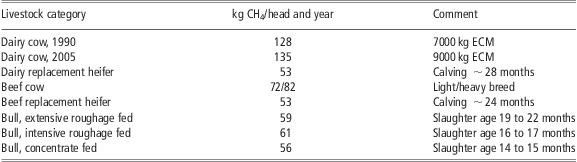
Emissions of enteric CH4 were calculated with a model (Lindgren, Reference Lindgren1980; Bertilsson, Reference Bertilsson2001) which is used in the national GHG inventory report for Sweden. Input data in the model are: animal live body weight (to estimate the energy required for maintenance), milk yield (to estimate the energy required for production), the lactation period, energy content in feed intake and proportions of roughage feed and crude protein in total feed intake. The estimated CH4 emission per head and year for different cattle categories are shown in Table 2. Total estimated CH4 emission was compared with the national inventory report and agreed well with these statistics (Naturvårdsverket, 2009).
Estimated emissions from enteric fermentation for different cattle categories (kg CH4 per head and year)
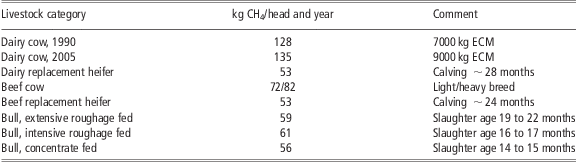
CH4 = methane; ECM = energy corrected milk.
CH4 emissions due to enteric fermentation are estimated at 1.5 kg CH4/head and year for pigs in developed countries (Tier 1) (IPCC, 2006a). From the start of the fattening phase (live weight = 30 kg) until slaughter, the pigs are fattened for 3.2 months. Small piglets emit only minor amounts of CH4 due to low feed intake, and thus 4 months was the time period used to estimate CH4 emissions for fattened pigs as 0.5 kg CH4. No emissions from enteric fermentation were assumed from poultry.
CH4 from excreta on field and manure management
Manure production was calculated with a national advisory computer program for nutrient flows and losses on farms developed by the Swedish Board of Agriculture and used in the advisory service. The percentage of different manure-handling systems was based on official statistics (Statistiska Centralbyrån, 2006a). Emissions of CH4 from manure storage were calculated according to IPCC guidelines (2006a).
Direct emissions of nitrous oxides
Direct N2O emissions from soils due to nitrogen (N) application (synthetic fertilisers and manure) and crop residues were estimated using the IPCC (2006b) default emission factor (EF) of 0.01 kg N2O-N per kg Napplied. For N2O emissions from excreta dropped directly on pasture, the IPCC guidelines default EF of 0.02 kg N2O-N per kg Nexcreted (IPCC, 2006b) was used. Nitrogen excretion in manure was calculated as the total amount of N in feed intake minus the amount of N in products leaving the farm. Nitrogen in field-applied manure was calculated as the total amount of N excreted in the building plus additional N in straw and waste feed minus losses of ammonia (NH3) and N2O in houses and storage. N2O emissions from manure storage were calculated based on N in excreta and the IPCC (2006a) default EF of 0.005 kg N2O-N per kg Nexcreted for solid manure and slurry.
Indirect emissions of nitrous oxides
Volatilisation of NH3 and leaching of nitrate results in indirect emissions of N2O. These emissions were calculated using the default EFs from IPCC (2006b) of 0.01 kg N2O-N per kg NH3-N and 0.0075 kg N2O-N per kg NO3-N. NH3 emissions from excreta were calculated by entering specific EFs for each manure management system into the national advisory computer program on nutrient flows and losses. Swedish estimates of nitrate leaching were linked to the cultivation of feed grains and grassland based on average leaching from loamy soils in western Sweden (Cederberg et al., Reference Cederberg, Sonesson, Henriksson, Sund and Davis2009a).
Synthetic fertilisers
In recent years, statistics on fertiliser rates in individual crops have improved and been balanced with the total amount of fertilisers sold. In 2005, a total of 158 000 t of N as mineral fertiliser was used in Swedish agriculture, and fertiliser rates for different crops (Statistiska Centralbyrån, 2006b) were used for the relevant feed crops for 2005. There were no statistics on fertiliser use in individual crops in the early 1990s, only data on the total sale of 220 000 t of N (Statistiska Centralbyrån, 1992). N-fertiliser rates in individual fodder crops in 1990 were estimated with the help of fertiliser guidelines, expert discussions and a final balancing in which the estimated fertiliser rates in each crop were multiplied by the total area of individual crops so that the total amount of N used could be set equal to the statistics of total fertiliser sales. For cereals, there were only minor differences in fertiliser N efficiency between the two years with an average of 44, 57 and 66 kg grain produced/kg N-fertiliser for winter wheat, barley and oats, respectively.
One-third of the grassland area was in organic production in 2005 with no mineral fertiliser application. This is partly an effect of the growth of organic production of dairy and beef and partly due to the Rural Development Program in Sweden, where, for example, subsidies to organic agriculture have been included. Farmers have used the subsidies in grassland in particular; in 2005 almost one-third of total grassland area used for cutting (silage and hay) did not receive any mineral fertilisers, nor did around 40% of the grassland used for grazing (Statistiska Centralbyrån, 2006a). In the early 1990s, there was very little organic production in Swedish agriculture, and in principle all grassland area received synthetic fertilisers. As a result, the N-fertiliser use in grassland was substantially reduced between the two years with an average rate of 85 kg N/ha in 1990 compared with an average rate of 48 kg N/ha in 2005.
Synthetic N-fertilisers take the form of ammonium nitrate in Sweden. In 1990, there were two domestic fertiliser industries in Sweden where most fertilisers were produced; data for GHG emissions from production and transport are for the late 1990s (Davis and Haglund, Reference Davis and Haglund1999), corresponding to emissions of 7.3 kg CO2e/kg N. In 2005, the Swedish fertiliser industry had shut down, and only imported fertilisers were used. Data on emissions from fertiliser N production in 2005 are from Jenssen and Kongshaug (Reference Jenssen and Kongshaug2003), representing average data from the European fertiliser industry, estimated at 6.8 kg CO2e/kg N, at the beginning of 2000. NH3 emissions from the application of N-fertiliser (mostly ammonium nitrate) were calculated at 2% of N applied (Hutchings et al., Reference Hutchings, Sommer, Andersen and Asman2001).
Energy use in agriculture
Direct energy used for farm-animal production is found in diesel for machines (tractors, harvesters), heating (of stables, drying of grains) and electricity (ventilation, milking, cooling of milk). Statistics on the use of energy in Swedish agriculture are infrequent; during the past 20 years, data are available for 1986, 1994, 2002 and 2007 (Statistiska Centralbyrån, 2008). Because energy data are collected and aggregated for the entire agricultural sector, it is not possible to assess energy use in animal production solely with official statistics. Information from the literature and experts was therefore used to quantify energy use in different livestock sectors (see Cederberg et al., Reference Cederberg, Sonesson, Henriksson, Sund and Davis2009a).
During the 15-year period studied, Swedish electricity production was based on hydro and nuclear power, and the main variability in carbon intensity between years is due to rainfall amount. To exclude this small variation, which does not provide insight into the livestock production system, the same carbon intensity for electricity production was assumed for 1990 and 2005. The entire life cycle is included in emissions from fossil fuels. Data on GHG emissions from the production and use of energy were taken from the Ecoinvent (2007) database.
Post-farm activities
Data on transportation and processes in the food industry were collected from major Swedish industries through their environmental reports and from an LCA project (Lantbrukarnas Riksförbund, 2002) in which the supply chains for seven major food items (including dairy and meats) were investigated thoroughly (see Cederberg et al., Reference Cederberg, Flysjö, Sonesson, Sund and Davis2009b). Data on post-farm activities for eggs were according to Sonesson et al. (Reference Sonesson, Cederberg, Flysjö and Carlsson2008).
Data on imported animal products
When the consumption of meat, dairy products or eggs exceeded the Swedish production, the quantity imported was calculated as the difference between total domestic consumption and total domestic production of the product. This difference was defined as the ‘net import’, which was multiplied with a CF based on international publications on GHG emissions from animal products from major exporting countries (Cederberg et al., Reference Cederberg, Flysjö, Sonesson, Sund and Davis2009b). Imports of animal products were small in 1990, but meat imports (especially chicken and beef) were significant in 2005 (Figure 1). Beef imports came mostly from Ireland, Denmark, Germany and Brazil with GHG emissions per kilogram CW beef exported to Sweden in the range of 20 to 29 kg CO2e/kg CW, whereas chicken and pork came from Denmark with a CF at the retailer in Sweden at 2.9 and 3.8 kg CO2e/kg CW, respectively.
Results
Production
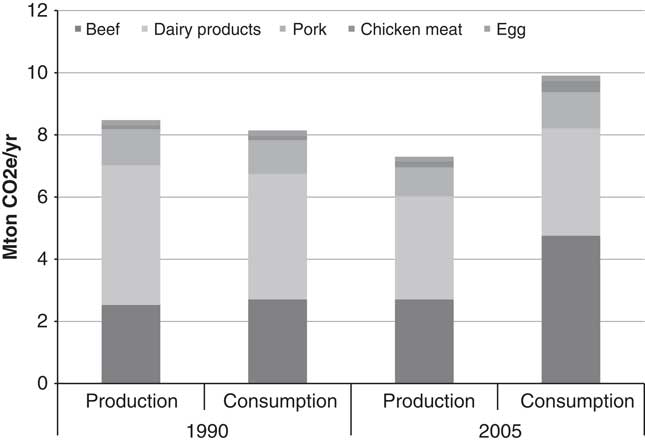
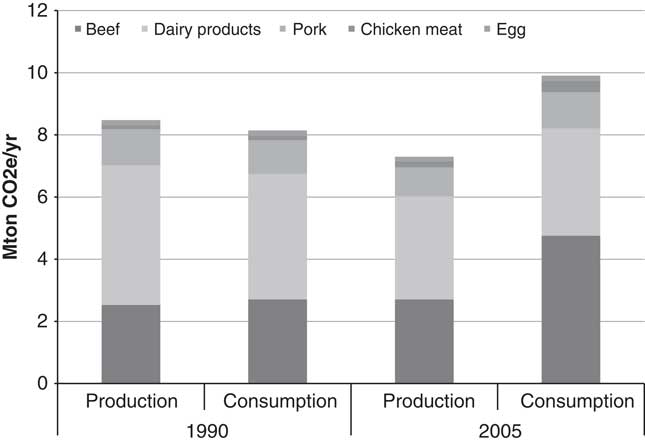
In 1990, total life cycle GHG emissions from the Swedish livestock production were around 8.5 Mt CO2e, and emissions decreased to 7.3 Mt CO2e in 2005, a reduction of almost 14%. Production of dairy and beef represented 82% of total emissions in 2005, pork 13% and poultry only 5%. However, cattle production had by far the largest emission cuts: in dairy and beef production, emissions decreased by ∼1 Mt CO2e between 1990 and 2005 (Figure 3), due solely to more efficient dairy production.
Total greenhouse gas emissions (million tonnes CO2e per year) from Swedish production and consumption of animal products in 1990 and 2005.
All animal sectors except chicken had production decreases during the studied time period (Table 1). The total emissions reduction can be divided into two categories: (i) lower GHG emissions per unit (i.e. more ‘climate-efficient production’), and (ii) lower volume. Two-thirds of the total emissions reduction of ∼1.2 Mt CO2e can be explained by more efficient production, whereas around one-third can be explained by the overall reduced volume produced during the studied period.
Milk
The farm-gate GHG emissions of milk were reduced from 1.27 kg CO2e/kg ECM in 1990 to 1.02 kg CO2e/kg ECM in 2005, that is, a 20% cut in emissions. Over those 15 years, there was a strong increase in milk yield, from around 6.1 to 8.2 t ECM/cow and year. This efficiency gain explains the relatively high cut in the CF of milk, see Figure 4. The reduction was largest for fossil CO2, ∼25% over the 15 years. The major reason is higher efficiency in the production and use of feed. Producing one unit of milk required 25% less grain in 2005 compared with 1990 and, also, less grassland, with lower N-fertiliser rates. Although substantially more protein feed (rapeseed meal, soya meal) was used in milk production in 2005, compared with 1990, the overall results clearly show that the GHG emissions from total feed production for milk were substantially lower in 2005. N2O emissions per kilogram milk were around 20% lower in 2005 than in 1990, a result of some reduction in N-fertiliser per unit of grain and roughage fodder and the increased feed efficiency of grain and roughage fodder. CH4 from enteric fermentation decreased by 22% during the studied time period, while CH4 from manure management increased due to a shift from less solid manure to more slurry. The overall reduction of CH4 was 17% (Figure 4).
Greenhouse gas emissions per kilogram milk or eggs at farm-gate for Swedish production in 1990 and 2005.

Beef
In contrast with milk, the average GHG emissions from Swedish beef production increased from 18 kg CO2e/CW in 1990 to 19.8 kg CO2e/CW in 2005. In 1990, a very large share, 85%, of total beef production had its origin in the dairy sector in the form of meat from culled dairy cows and the breeding of surplus dairy calves (mostly bulls). This share was reduced between 1990 and 2005 as the dairy herd was reduced significantly; in 2005, only 65% of total beef production was derived from the dairy sector. CH4 emissions from enteric fermentation increased by around 35% for beef on average; in 2005, almost 55% of total GHG emissions in beef production were due to enteric fermentation (Figure 5). Beef cattle made up a larger share of the total herd in 2005, and significantly more beef was produced in ‘pure beef’, so-called cow–calf systems. Emissions of fossil CO2 and N2O in the average production of beef did not increase as much as CH4 due to changes in feeding regimens in beef production. Due to environmental subsides in the EU CAP (Common Agricultural Policy) promoting organic grassland and grazing in Sweden, the use of grain in beef cattle feed and N-fertilisers in beef cattle's roughage fodder was substantially reduced over the 15-year period.
Greenhouse gas emissions per kilogram meat (carcass weight) at farm-gate for Swedish production in 1990 and 2005.

In total, the dairy and beef sector emissions were around 1 Mt CO2e lower in 2005 than in 1990. About 60% of this decrease is estimated to be due to efficiency gains in the dairy sector. However, the total positive effect on GHG emissions as a result of increasing milk yield per cow would have been much larger if the lost co-produced beef from the dairy sector had not been replaced with increased beef production in cow–calf systems. However, such a development would have meant a significant reduction of the total cattle herd in Sweden over the 15-year period.
Eggs
GHG emissions per kilogram eggs were unchanged during the studied time period, corresponding to 1.4 kg CO2e/kg at the farm-gate (Figure 4). Feed production represents almost 85% of the CF of eggs at the farm-gate. During the studied time period, composition of protein feed changed significantly. In 1990, fish meal, meat meal (a by-product from slaughter industry) and domestic peas were the major protein ingredients in the feed; in 2005, vegetable protein (soya meal) dominated. The reasons for this shift are the ban of meat meal after the Bovine Spongiform Encephalopathy (BSE) crisis in 1990s, less fish meal available in the protein feed market due to competition with a growing aquaculture sector and decreased cultivation of leguminous crops in Sweden. All this resulted in higher GHG emissions from protein feeds in 2005; this increase was mostly compensated for by lowered emissions from the grains in the layer hens’ feed.
Pork
The GHG emissions from pork were 3.4 kg CO2e/CW in 2005, a 15% cut compared with 1990 (Figure 5). Farm-gate fossil CO2 emissions decreased by 25% per kg pork. The major reason for this improvement was the overall improved feed efficiency; around 15% less feed was used to produce 1 kg pork in 2005. One important improved production parameter was the increase of weaned piglets per sow (from 18 to 21), which means that more piglets share the environmental burden of the sow. N2O emissions from pork production were reduced by 10%, the most important emission cuts sourced from manure management and indirect N2O emissions. This is foremost an effect of the switch to handle more manure as slurry; N2O emissions are low from this storage method, and it also enables reductions in NH3 emissions.
Chicken meat
Average GHG emissions in chicken meat production decreased from around 2.5 to 1.9 kg CO2e/kg CW (around 23%), see Figure 5. The switch from oil to biofuels for heating in poultry barns is the main cause; in 2005 biofuels (mostly wood chips) were used in 80% of barns as opposed to 20% in 1990. Efficiency gains in feed production also contributed to a lower CF in 2005.
Consumption
In contrast with production, total GHG emissions from the Swedish consumption of animal products increased, from around 8.1 Mt CO2e in 1990 to ∼10 Mt CO2e in 2005, an increase of ∼22%, see Figure 3. This is explained by a strong growth in meat consumption (beef, poultry and pork) by around 50% (from 460 to 706 million kg CW), see Figure 1, leading to an increase in emissions of more than 2.3 Mt CO2e.
The large and growing emissions from beef consumption in 2005 compared with 1990 is in part due to that the CF of Swedish beef is higher in 2005 than in 1990 as explained above, and also – and most importantly – due to a very strong increase in beef imports (from 12 t CW 1990 to 106 t CW in 2005) to satisfy the growing consumption (see Figure 1). The strong growth in beef consumption is responsible for >85% of the total emissions increase between 1990 and 2005.
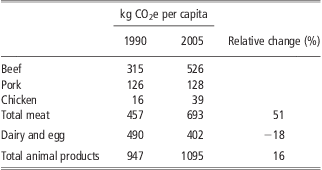
The Swedish per capita GHG emissions caused by consumption of meat, dairy and egg products increased by around 16% and reached around 1.1 t CO2e in 2005 (Table 3); since the population increased by 460 000 people during the 15-year period, the relative emissions increase is lower in per capita terms than in total terms, compare Figure 3. In 1990, dairy products made up around 50% of total per capita GHG emissions, but this has changed. In 2005, meat products, especially beef, were responsible for a significantly larger share of per capita emissions. Reduced CFs of dairy products in combination with stable consumption and the growing meat consumption explains why dairy products have a lower proportion of total per capita GHG emission in 2005 compared with 1990, see Table 3.
Per capita GHG emissions (kg CO2e per capita) from consumption of meat, dairy products and eggs in Sweden 1990 and 2005 and relative change (%)
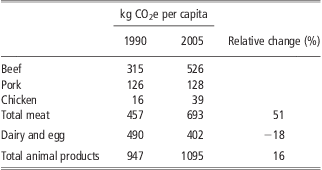
GHG = greenhouse gas; CO2e = carbon dioxide equivalents.
Discussion
Accuracy of methodology and data
We used a top-down approach to model and analyse activities and emissions linked with overall meat, dairy and egg production. The input data were primarily based on Swedish agricultural statistics and reports. These materials have a 200-year history and are considered to be of high quality (Jordbruksverket, 2005). Parameters such as production volumes, livestock numbers, agricultural areas, crop distribution and fertiliser use have a reasonably high accuracy. Major deficiencies in the statistics include energy use – statistics are reported only every 5 years, as an aggregated figure for the whole agricultural sector – and use of concentrate feed – statistics include only purchased feed, not feed grain produced at the same farm where it is used. However, as far as possible, bottom-up inventory data in the different production systems were summed up, and total calculated resource-use and emissions from the animal products studied were checked and corrected against the national statistics. We believe that we have not underestimated any important input resource, such as use of feed grain or fertilisers in crop production; the possible error is in the distribution among animal types.
When estimating emission trends related to consumption of animal products, we used CF results on imported products from international publications. Choice of methodology is not consistent across published LCA/CF studies. There are, for example, variations in how data are acquired (real farm-data v. farm modelling), differences in methods for co-product handling, system boundaries, etc. This means that differences found in different studies can be a consequence of choice of methodology. However, the CFs for imported animal products used in studies are in good agreement with numbers recently published by the European Commission on life cycle GHG emissions from EU livestock products and imported meat from Brazil (Leip et al., Reference Leip, Weiss, Wassenaar, Perez, Fellmann, Loudjani, Tubiello, Grandgirard, Monni and Biala2010).
Emissions from LULUC were not included in this study; therefore, the results presented here almost certainly represent underestimations of the true numbers. There is no international consensus methodology for LULUC emissions in LCA/CF studies. Leip et al. (Reference Leip, Weiss, Wassenaar, Perez, Fellmann, Loudjani, Tubiello, Grandgirard, Monni and Biala2010) developed and used a model for including emissions from LULUC so that historic land conversion rates are allocated to expanding crop systems, mainly soya beans in South America. For European agriculture it is assumed that land not used for food production could be transformed to grassland. Thus, the alternative use of that land is grassland, which implies that agricultural land causes emissions (omitted carbon sequestration), whereas managed grasslands act as a small carbon sink compared with natural grassland. This approach can of course be criticised, but it has the advantage of allowing reasonably simple calculations and accounting for some LULUC emissions for all land use. Using data and methods from Leip et al. (Reference Leip, Weiss, Wassenaar, Perez, Fellmann, Loudjani, Tubiello, Grandgirard, Monni and Biala2010) and adding LULUC emissions for the 2005 values would increase the CF for pork and poultry products by 63% to 137%, for dairy by 20%, and decrease the CF for beef by 4%. The ranking between the meat products would remain unchanged, with poultry having the lowest CF, and the CF for beef, a factor four higher. Although models for calculating LULUC emissions are based on many uncertain data and assumptions, it is obvious that this emission source is of great significance to livestock production's total GHG emissions. In the Food and Agricultural Organization report, Livestock's Long Shadow, emissions from deforestation in South America for expanding soya bean and pasture for animal production were estimated to represent as much as one-third of the global livestock GHGs (Steinfeld et al., Reference Steinfeld, Gerber, Wassenaar, Castel, Rosales and de Haan2006).
Drivers of changes in emissions intensities in production
The results indicate that the overall life cycle GHG emissions from Swedish livestock production have decreased by 14% between 1990 and 2005, of which two-thirds is the result of reduced emissions per product unit and one-third is due to lower production volumes. Although there are large uncertainties in estimates of GHG emissions from agriculture, there is a clear trend towards decreasing emissions from Swedish livestock production. Per kilogram product, GHG emissions decreased by 20% for dairy, 15% for pork and 24% for chicken meat. This is a result of several factors, including increased milk yield, less synthetic N-fertilisers used on grasslands, reduced losses of NH3 most apparent in pork production and a switch to biofuels for heat in chicken barns. With the exception of the increasing use of bioenergy in chicken farms, which is an effect of carbon taxes on fuel oil, the emission cuts have occurred without any specific climate policies aimed at the agriculture sector. Instead, these reductions have largely been an effect of continuous improvements in production practices, including breeding, nutrition, reproduction and health improvements, and also of non-climate policies, for example, government subsidies to organic grassland and taxes on synthetic fertilisers, which were implemented during the studied time period but were abolished recently.
Drivers of changes in consumption
Swedish beef consumption was stable until the early 1990s. An upward trend followed, despite the BSE crisis that had a negative impact on consumption in other EU countries. Favourable consumer price development was important. When Sweden became a member of the EU in 1995, beef prices were cut by almost 10%. The subsequent year, a reduction of food value added tax probably fuelled consumption further. For pork, and even more so for poultry meat, the consumer price development has also been favourable. While the general food price index was down by 2% from 1990 to 2006, meat prices decreased by 12% (Jordbruksverket, 2009). Thus, relatively speaking, meat has become more affordable, and this is probably one reason for the rise in meat consumption in Sweden since the early 1990s. Also, real incomes per capita have risen by around 30% since 1990 (Ekonomifakta, 2012); this change typically drives meat consumption (Popp et al., Reference Popp, Lotze-Campen and Bodirsky2010).
Today, annual per capita beef consumption in Sweden is about 26 kg (in CW), which is about 40% higher than the EU average. Other European countries with relatively high beef consumption (>20 kg CW per capita and year) include Denmark, France, Ireland, Italy and United Kingdom. In contrast with beef, per capita consumption of chicken and pork in Sweden are 16% and 28%, respectively, lower than the EU-27 averages (Westhoek et al., Reference Westhoek, Rood, van der Berg, Janse, Nijdam, Reudrik and Stehfest2011). For dairy products, long-term per capita consumption trends show declining milk consumption, whereas cheese consumption has doubled since the 1960s. Prices on dairy products have followed the general price development of the whole food basket. In 2005, total dairy consumption corresponded to ∼355 kg milk per capita, which is almost the same as in 1990 but one of the highest rates globally (Food and Agricultural Organization, 2009).
Long-term climate targets and food
On the basis of estimates of the emissions reductions required to stay within a 2° temperature target, the European Council targets a cut in GHG emissions of 80% to 95% below 1990 levels by 2050 (European Commission, 2011). The European population is expected to remain rather constant to 2050 (Giannakouris, Reference Giannakouris2008), which means that the total annual per capita emissions should fall between 0.5 and 2.2 t CO2e in 2050 (European Commission, 2009). Our results show that the Swedish consumption of animal-based food alone contributed around 1.1 t CO2e per capita in 2005 (Table 3), not counting emissions from land-use change. By 2050 the emissions intensity per unit of produce may have decreased, primarily by using greener energy, improving manure management and catalytic removal of N2O from synthetic fertiliser production. But even if we optimistically assume that emissions of CO2 from fossil fuels and CH4 from manure management are reduced to zero in animal production in 2050, the life cycle emissions would only be lowered by 40% to 50% for pork and poultry and 20% to 25% for dairy and beef. The remaining biogenic emissions, those from enteric fermentation and N turnover in agricultural soils, are harder to reduce, and cuts are technologically more difficult (DeAngelo et al., Reference DeAngelo, de la Chesnaye, Beach, Sommer and Murray2006). We can thus conclude that the consumption of animal-based food at a level of that of Sweden in 2005, could, all on its own, jeopardise the climate target set by the EU. Of course, emissions from animal-based food products are not the only emissions that have to fit within this 2050 limit. All emissions from food, as well as from energy, transportation, and industry, have to fit within that budget.
Apart from fuel taxes there are currently no strong policy instruments in place for reducing GHG emissions from Swedish (or European) food production. For the majority of emissions from agriculture, conventional emission taxes are an unfavourable policy option. Due to their non-point character, CH4 emissions from feed digestion and N2O emissions from agricultural soils would be extremely costly to monitor at the farm level. Of course, taxes could be based on benchmark emissions, for instance based on the number of cows. However, such a tax would not provide incentives to reduce emissions through technical measures such as feed additives, as the tax would be fixed per cow. But maybe more importantly, the tax would make Swedish production more expensive, which would contribute to a higher import share, possibly from countries with higher emissions per unit of produce. The technical mitigation potential in the livestock sector is limited; therefore, a shift from beef to chicken, or beans, is an interesting option since it reduces emissions by 90% to 95% per consumed calorie. An altered diet is both an effective and possibly necessary mitigation strategy to reach long-term climate targets; it is also interesting from a health perspective (Friel et al., Reference Friel, Dangour, Garnett, Lock, Chalabi, Roberts, Butler, Butler, Waage, McMichael and Haines2009; Westhoek et al., Reference Westhoek, Rood, van der Berg, Janse, Nijdam, Reudrik and Stehfest2011). Since the cost of monitoring emissions would be very high in agriculture and large emissions reduction can be achieved by changing consumption patterns, Wirsenius et al. (Reference Wirsenius, Hedenus and Mohlin2011) proposed a GHG-weighted consumption tax on meat, dairy and eggs. Such a tax would be neutral between domestic and imported animal products, and would provide incentives for the consumer to change their eating patterns towards less emission-intensive food types.
Conclusion
This paper estimates the life cycle GHG emissions from Swedish production and consumption of meat, dairy and eggs. Between 1990 and 2005, production emissions decreased by ∼14%. About one-third of the decrease was due to reduced production volume, and two-thirds to decreased emission intensity (emissions per unit of produce). The dairy sector accounted for most of the drop in aggregated emission intensity, owing to a 20% reduction in emissions per unit of milk produced. A substantial rise in average milk yield, from 6.1 to 8.2 t/cow and year, explains most of the reduced emission intensity in dairy production.
In total, emissions related to consumption of meat, dairy and eggs increased by 22% between 1990 and 2005. Most of this increase is explained by strong growth in beef consumption, by about 50%, as well as by an increase in average emission intensity in production due to a larger fraction of meat coming from beef suckler systems.
The emission cuts necessary in order not to exceed the 2°C limit could imply a severe constraint on the long-term global consumption of animal-based food. Due to the relatively limited potential for reducing food-related emissions by higher productivity and technological means, structural changes in food consumption towards less emission-intensive food could be required in order to meet the 2°C target.
Acknowledgements
We like to acknowledge help with data inventory and emission calculations from Jennifer Davis, Anna Flysjö and Veronica Sund (SIK) and Maria Henriksson (Swedish University of Agricultural Sciences). The study was performed with funding from the Swedish Farmers’ Foundation for Agricultural Research.