INTRODUCTION
Covering almost 240,000 km2 Patagonia in Southern Chile constitutes one of the most important and extensive fjord regions worldwide. This region is characterized by a highly fragmented coastline and thousands of islands, many channels and fjords, and complex marine–terrestrial interactions. In this fjord and estuarine ecosystem with highly turbid river plumes, the interaction between autochthonous organic matter (OM) and river or glacier derived allochthonous detritus contribute nutrients and particularly silicate, which control primary production in many of the channels and fjords (Iriarte et al., Reference Iriarte, González, Liu, Rivas and Valenzuela2007; González et al., Reference González, Calderón, Castro, Clement, Cuevas, Daneri, Iriarte, Lizárraga, Martínez, Menschel, Silva, Carrasco, Valenzuela, Vargas and Molinet2010; Torres et al., Reference Torres, Frangópulos, Hamamé, Montecino, Maureira, Pizarro, Reid, Valle-Levinson and Blanco2010). In addition, large inputs of forest litter into the fjords result in highly organic marine sediments. Terrestrial derived OM has been demonstrated as an important carbon source for macroinfaunal communities in New Zealand fjords (McLeod et al., Reference McLeod, Wing and Skilton2010), although vascular plant detritus may be considered as a poor quality food source for marine invertebrates, and only few infauna species are capable of assimilating this material via heterotrophic and chemoautotrophic microbes (McLeod & Wing, Reference McLeod and Wing2009; McLeod et al., Reference McLeod, Wing and Skilton2010). The terrestrial derived OM constitutes important subsidies to coastal benthic environments controlling macrobenthic standing stock, diversity and functional group (or feeding mode) composition (e.g. Syvitsky et al., 1989; Wieking & Kröncke, Reference Wieking and Kröncke2005; Wlodarska-Kowalczuk et al., Reference Wlodarska-Kowalczuk, Pearson and Kendall2005, Reference Wlodarska-Kowalczuk, Szymelfening and Zajaczkowski2007; McLeod et al., Reference McLeod, Wing and Skilton2010).
Macrobenthic communities play an important role in the functioning of the fjord and estuarine ecosystems in affecting rates and pathways of exchange and transformation of OM (Jørgensen, Reference Jørgensen, Jørgensen and Richardson1996). Macrobenthic communities in the coastal areas influenced by rivers are impacted (Akoumianaki et al., Reference Akoumianaki, Papaspyrou and Nicolaidou2006) in different ways, although the physical environment is less detrimental than off the mouth of temperate rainforest rivers (McLeod & Wing, Reference McLeod and Wing2009; McLeod et al., Reference McLeod, Wing and Skilton2010). A suite of macrobenthic process indicators were recognized for the description of changes in benthic ecosystem functioning associated with particulate OM or nutrient imput to coastal ecosystems. Such indicators are secondary production, P/B ratios, normalized biomass size-spectra (NBSS) and trophic structure (e.g. Rakocinski & Zapfe, Reference Rakocinski, Zapfe and Bortone2005; Quiroga et al., Reference Quiroga, Quiñones, Palma, Sellanes, Gallardo, Gerdes and Rowe2005; Akoumianaki et al., Reference Akoumianaki, Papaspyrou and Nicolaidou2006; Wang et al., Reference Wang, Yuan and Zhang2010). These macrobenthic process indicators can be estimated in a straightforward manner from macrobenthic samples (e.g. Rakocinski & Zapfe, Reference Rakocinski, Zapfe and Bortone2005; Akoumianaki et al., Reference Akoumianaki, Papaspyrou and Nicolaidou2006).
Another important consideration is the element of timelines: many Chilean fjords appear to be suitable for aquaculture (Buschmann et al., Reference Buschmann, Riquelme, Hernández-González, Varela, Jiménez, Henríquez, Vergara, Guíñez and Filún2006). Salmon farming has grown exponentially in the southern Chilean fjords in recent years, while investigations on the effects of these activities on the benthic ecosystems have been restricted to only few locations (Soto & Norambuena, Reference Soto and Norambuena2004; Mulsow et al., Reference Mulsow, Krieger and Kennedy2006). Secondly, most of the hydropower potential in Chile is based in this region, and proposals for major hydropower developments are already underway (Goodwin et al., Reference Goodwin, Jorde, Meier and Parra2006).
In this study, we describe the macrofaunal standing stock, community structure and macrobenthic process indicators in order to basically understand the structure of benthic communities in an area of strong riverine influence of the Baker Fjord ecosystem. Additionally, we examine the quantity and quality of the OM, the community structure and body size-distribution of the macrobenthic communities at two locations (i.e. river mouth and fjord mouth) in order to assess the effects of the local organic eutrophication on the macrobenthos in the Baker Fjord system.
MATERIALS AND METHODS
Sampling method
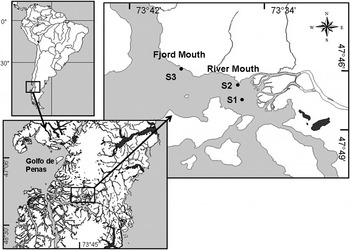
The study area is located in the Baker Fjord, Northern Patagonia (Figure 1). Three stations were sampled in June, September, November 2008, and in February 2009 (Figure 1). Faunal associations were distinguished as follows: (1) two river mouth stations situated in the entrance of the Baker River (Stations S1 and S2); and (2) a fjord mouth station situated in the outer part of the Baker Fjord (Station S3).
Map of sampling stations.

The hydrological properties of the water column were measured with either a CTDO Seabird 19 Plus or a CTD Idronaut 304. In addition, discrete water samples were collected with Niskin bottles for chlorophyll-a (Chl-a), phaeopigment (Phaeop), suspended particulate total matter (SPTM), dissolved oxygen, and nutrients from the surface to 30 m (i.e. surface, 2, 5, 10, 20 and 30 m depth). Chl-a and Phaeop samples were filtered in duplicate (GF/F glass fibre filters) and frozen (–20°C) until analysis by fluorometry (Turner design TD-700) according to the standard procedure described by Holm-Hansen et al. (Reference Holm-Hansen, Lorenzen, Holmes and Strickland1965). Nutrients (nitrate, nitrite, phosphate and silicate) were determined spectrophotometrically (Perkin Elmer) following Strickland & Parsons (Reference Strickland and Parsons1968). Duplicate SPTM samples were vacuum-filtered from 200 ml water volume on pre-weighed Whatman glass microfibre filters GF/F with 0.7 mm pore size and rinsed with distilled water (Zajaczkowski & Wlodarska-Kowalczuk, Reference Zajaczkowski and Wlodarska-Kowalczuk2007).
For macrofaunal analysis, samples were taken using a 0.1 m2 van Veen grab. Faunal groups not properly sampled by this method such as nematodes and foraminifers were not included in the analysis. In general in soft-sediment studies a single grab will represent only a small fraction of the species at a site because of small-scale spatial variation. Hence, data analyses were conducted on species abundance and biomass data pooled over 3–6 replicate grabs from each benthic station (see Ellingsen, Reference Ellingsen2002). The sediment samples were sieved through a 500-μm mesh size screen and the biological material was fixed in a 10% buffered formaldehyde–seawater solution. In the laboratory, the fauna was identified to the lowest taxonomic level possible. Biomass was determined as wet weight with a precision of 0.1 mg using an analytical balance.
Sediment sub-samples for total organic carbon, total nitrogen, Chl-a and Phaeops were collected from independent replicates; the whole samples were kept frozen (–20°C) prior to analysing the sedimentary properties. Sediment grain size analysis was performed on the top 5 cm of the sediment cores using geological sieves. Particle size data were analysed following Folk (Reference Folk1974). Total organic matter (TOM) was obtained by means of the calcination method using a muffle furnace (Luczak et al., Reference Luczak, Janquin and Kupka1997). Total organic carbon (TOC) and total nitrogen (TN) content of the surface sediments were measured on freeze-dried and homogenized sample material. This was decalcified with 1N HCl, dried on a hot plate at 40°C, and measured in a CHN elemental analyser (LECCO, model Truspec CHN) for TOC and TN. Chl-a and phytopigment degradation products (i.e. total phaeopigments) were fluorometrically analysed according to Montani et al. (Reference Montani, Magni and Abe2003). The bulk of pigments registered with this method are denominated chloroplastic pigment equivalents (CPE) (Gutiérrez et al., Reference Gutiérrez, Gallardo, Mayor, Neira, Vásquez, Sellanes, Rivas, Soto, Carrasco and Baltazar2000). To further characterize the quality of organic matter, ratios of Chl-a concentration to TOC content (µg Chl-a/mg C) were calculated (Gutiérrez et al., Reference Gutiérrez, Gallardo, Mayor, Neira, Vásquez, Sellanes, Rivas, Soto, Carrasco and Baltazar2000).
Data analysis
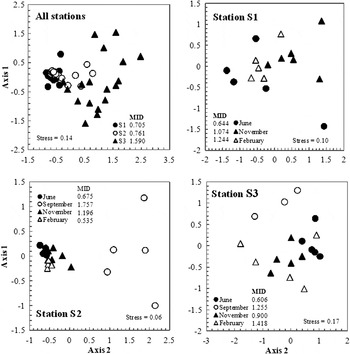
The benthic abundance and biomass data were standardized by area (m2) and used to determine the means and standard deviations per station and season. To define possible differences of abundance and biomass between stations and seasons the data were analysed by a one-way analysis of variance (ANOVA). The raw data were fourth-root transformed and the homoscedasticity (Bartlett's test), as well as the normality of residuals were checked (Zar, Reference Zar1996). When significant differences were observed, these contrasts were performed by a posteriori Tukey's honestly significant difference test (Zar, Reference Zar1996). To compare the community structure, univariable Shannon–Wiener (H′) index, J′ index of evenness, Simpson dominance (D) and Sanders–Hulbert expected species number (ES10) and multivariable analyses were conducted using PRIMER software (PRIMER version 5; Clarke & Warwick, Reference Clarke and Warwick1994). The community parameters were statistically treated using the Kruskal–Wallis non-parametric test (Zar, Reference Zar1996). The species abundance data matrix was transformed according to Y = √√X for the ordination method non-metric multidimensional scaling (NMDS) analysis (Field et al., Reference Field, Clarke and Warwick1982). The significance of differences between stations and sampling dates was examined by the randomization test analysis of similarities (ANOSIM). The NMDS and relative index of multivariate dispersion (MID) were calculated on abundance data of the macrofauna. The MID examines rank dissimilarities among replicate grabs (i.e. heterogeneity within a station), where a value of 1 is the average dispersion among stations (Clarke & Warwick, Reference Clarke and Warwick1994). Principal component analysis (PCA) was performed with the software S-PLUS 6.2. PCA was applied to relate the set of environmental parameters to: (i) stations; and (ii) sampling periods, as suggested by Jongman et al. (Reference Jongman, Ter Braak and van Tongeren1987). In addition, multivariable regression analysis (MRA) was used to identify the role of the measured environmental variables in explaining the observed variability in macrobenthic parameters.
In order to recognize seasonal effects in the size structure of the macrobenthic communities, NBSS were constructed as described by Platt & Denman (Reference Platt and Denman1977, Reference Platt and Denman1978). The intercept of NBSS is an indicator for the total biomass at a given system and time (Sprules & Munawar; 1986; Quiroga et al., Reference Quiroga, Quiñones, Palma, Sellanes, Gallardo, Gerdes and Rowe2005). Mean individual wet weight was estimated as total macrofauna community biomass divided by total macrofauna community density. The parameters of the NBSS were determined by regressing the log2 (normalized biomass) against log2 (individual weight). Differences among the slopes of NBSS were assessed by an analysis of covariance according to Zar (Reference Zar1996).
RESULTS
Hydrography and suspended material input
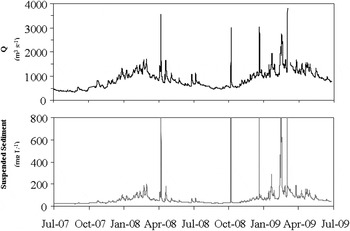
The marine ecosystem in the Baker Channel and Estuary is influenced by three major rivers: the Baker, the Bravo and the Pascua. The total supply of freshwater from rivers to the fjord system in Tortel is approximately 5.1 × 10⁴ km3 y−1 (Dirección General de Aguas; www.dga.cl). These rivers exhibit a strong seasonality with maximum flow rates in summer and a spring minimum, corresponding to the periods of maximum and minimum ice-melt, respectively. The Baker River accounts for about 1000 m3 s−1 of the total river input into the study area and is a major source of sediment, organic matter and some macronutrients such as, e.g. dissolved silicate. The total annual load of fine suspended sediment into the estuary and fjord is approximately 5.3 × 10⁶ tons per year. While this estimate applies to the fine suspended fraction, mostly silt and clay sized particles, we assume the bedload transport (mostly sand in the delta) to be roughly proportional to the suspended fraction, at least in terms of timing and relative magnitude of the pulses (Figure 2).
(A) Discharge of water into the Baker River between July 2007 to July 2009, measured by the hydro-meteorological Colonia Station (47°160S 73°130W) and (B) estimated suspended sediment load.

Since April 2008 the Baker system has experienced repeated glacial lake outburst floods (GLOFs) resulting from sudden releases of water from an ice-dammed lake in the Rio de la Colonia sub-basin (Dusaillant et al., 2009). The relative contribution of suspended sediment pulses from GLOF events is approximately 1.0–1.5 × 10⁵ tons of sediment per event, and despite their short duration (typically 12–20 hours) GLOFs may contribute up to 5% to the annual fine sediment load into the Baker Fjord.
The water column in the study area exhibited a highly stratified vertical structure and nutrient concentrations within the freshwater layer were very low throughout the study. Low levels of nitrate (<1.64 µM), nitrite (<0.53 µM) and phosphate (<0.90 µM) were observed, whereas silicate levels in the surface water near the river mouth (29–49 µM) were high. In contrast, the Chl-a concentrations in the study area were very low (<1.00 µg l−1), almost exclusively caused by cyanobacteria belonging to the genus Anabaena (Urra, Reference Urra2011). In general, the turbidity of surface water as well as the overall turbidity in the entire water column decreased with distance from the river mouth. SPTM concentrations varied between 88.50 and 163.25 mg l−1 in the river mouth and decreased in the fjord mouth (<21 mg l−1). Local peaks of low turbidity in the water column were detected at depths of 5 m and 10 m at both locations and in all sampling periods, which we interpret as the result of a marked change in the density of water (e.g. transition from freshwater to seawater).
Sediment conditions
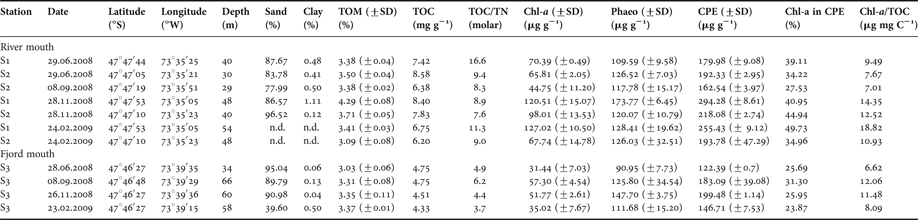
The river mouth (S1 and S2) and the fjord mouth (S3) locations differed considerably in their sediment characteristics. The sediment in the river mouth showed a high percentage of sand (>77.9%; Table 1). At Station S3 in the fjord mouth the sand fraction appeared more variable, ranging from 39.6% in February 2009 to 95% in June 2008 (Kruskal–Wallis test, P > 0.05). In the river mouth, TOM ranged from 3.09% (February 2009) to 4.29% (November 2008). At the fjord mouth station slightly lower but significantly different values appeared ranging from 3.03% to 3.37% (Kruskal–Wallis test, P < 0.05). In the river mouth TOC ranged from 8.58 mg g−1 in November 2008 to 6.20 mg g−1 in February 2009. In the fjord mouth the TOC content was lower, ranging from 4.33 mg g−1 in February to 4.75 mg g−1 in June 2008 (Kruskal–Wallis test, P < 0.05). TOC/TN ratios exhibited significant differences between locations (Kruskal–Wallis test, P < 0.05), varying between 7.6 to 16.6 and 3.7 to 6.2, respectively. The CPE was approximately 2-fold higher than the Chl-a concentrations. The Chl-a content in sediments at the river mouth Stations S1 and S2 ranged from 44.75 µg g−1 (±11.20 µg g−1) in June to 127.02 µg g−1 (±10.50 µg g−1) in February 2008. In the fjord mouth, the seasonal differences in the Chl-a content in sediments (31.44 µg g−1 ± 7.03 µg in June 2008 and 57.30 µg g−1 ± 4.54 µg in September 2008) were found to be significant (Kruskal–Wallis test, P < 0.05). In the river mouth location the CPE content in sediments showed higher variability ranging from 162.54 µg g−1 ± 3.97 µg in September to 294.28 µg g−1 ± 8.61 µg in November 2008, being significantly different (Kruskal–Wallis test, P < 0.05). In the fjord mouth the CPE content, too, differed significantly (Kruskal–Wallis test, P < 0.05); however, the values in June (122.39 ± 0.70 µg) and November (199.48 µg g−1 ± 1.14 µg) appeared less variable. The contribution of Chl-a to CPE varied from 26.70% to 38.78% and differed significantly between locations (Kruskal–Wallis test, P < 0.05). Surface Chl-a to TOC ratios were 7.01 to 18.82 µg Chl-a mg TOC−1 at Stations S1 and S2, and 6.62 to 12.06 µg Chl-a mg TOC−1 at Station S3 (Table 1).
List of stations and sediment parameters.
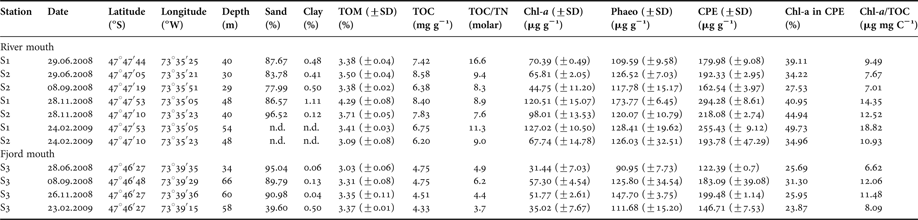
TOM, total organic matter; TOC, total organic carbon; TN, total nitrogen; Chl-a, chlorophyll-a content in sediment; Phaeop: phaeopigment; CPE, chloroplastic equivalent pigment; n.d., not determined.
Macrofauna community structure and feeding modes
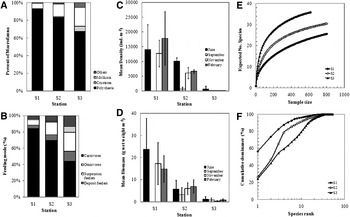
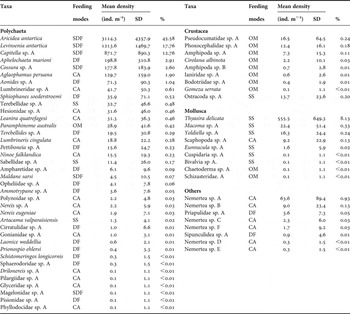
A total of 64 macrofauna species/morphs (>0.5 mm) were recorded during the study period (Table 2). Polychaetes were the dominant group, followed by crustaceans and molluscs. Polychaetes comprised 92.6% and 83.2% of the total macrofauna at the Stations S1 and S2, respectively, but just 67.6% at Station S3 (Figure 3A). Molluscs contributed 5.9% and 14.1 % to the total macrofauna at the Stations S1 and S2, respectively, and 21.3% at Station S3. Concerning feeding modes, carnivores (21 species) and deposit feeders (17 species) were dominating, followed by omnivores and suspension feeders (10 species each) and subsurface deposit feeders (6 species). At Stations S1 and S2 deposit feeders (DF) dominated by far comprising 84.3% and 69.5% of the total macrofauna at the stations, respectively, and were distinctly less (44%) at Station S3 (Figure 3B). Macrofaunal minimum and maximum densities and biomasses tended to be highest at Station S1 (14,034 to 17,800 ind. m−2; 14.88 to 23.62 g wet weight m−2), intermediate at S2 (650 to 6641 ind. m−2, 3.21 to 6.98 g wet weight m−2) and lowest at Station S3 (82 to 744 ind. m−2, 0.28 to 1.15 g wet weight m−2). Although significant differences in macrofaunal densities and biomasses were observed among stations (ANOVA, P < 0.05 and a posteriori test), the NMDS analysis based on abundance data revealed significant differences between the fjord mouth station and the 2 river mouth stations (ANOSIM test, P < 0.05). The MID, too, grouped the river mouth Stations S1 and S2 closer together (= more homogeneous) and separated them from Station S3 (Figure 4A). Significant differences in seasonal patterns only existed in the fjord mouth (ANOSIM test, P < 0.05).
Taxonomic composition of macrofauna (A), feeding modes (B), mean density (C), mean biomass (D), rarefaction (E) and dominance (F) curves for macrofauna sampled at three stations in the Baker Fjord.

Non-metric multidimensional scaling ordination plots of macrofauna sampled in the study area. The multivariate index of dispersion (MID) reflects relative within-station variability among samples.

Species list of the total macrofauna, mean densities with standard deviation (SD), and dominance values (%); pooled data from all sampling campaigns dominance values (%); pooled data from all sampling campaigns.

CA, carnivorous; DF, deposit feeders; SDF, sub-surface deposit feeder; OM, omnivorous; SS, suspension feeders.
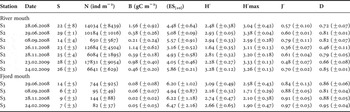
The species richness was highest at the stations in the river mouth, ranging from 14 species in September to 29 species in June (Table 3; Kruskal–Wallis test, P < 0.05). The expected number of species (ES10) was high at the fjord mouth Station S3 (mean = 6) and differed significantly from the lower value at Stations S1 and S2 (mean = 5, Kruskal–Wallis test, P < 0.05). The Shannon diversity index did not show any significant difference between locations (Table 3; Kruskal–Wallis test, P > 0.05). In contrast, evenness was significantly higher at the Station S3 (Kruskal–Wallis test, P < 0.05). Rarefied sample sizes appear to be the best method for understanding the low species richness in these samples, in particular for the fjord mouth station. Rarefaction richness (Figure 3E) was higher (ES = 30 and 35) at the 2 river mouth stations and lower at Station S3 (ES = 25). Dominance decreased from Station S1 to Station S3 (Figure 3F).
Macrofaunal community parameters obtained from three stations in the Baker Fjord; no data available for Station S1 in the September campaign 2008.

S, number of species; N, abundance; B, biomass; ES, expected number of species; H′, diversity; J′, evenness; D, dominance.
Normalized biomass size-spectra
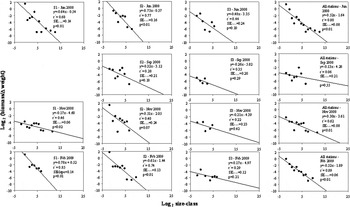
The NBSS of the macrobenthic communities obtained at all three stations in the different seasons are presented in Figure 5. Not all slopes were at all stations and sampling periods were significantly different. The slopes of the statistically significant regressions ranged from –0.17 to –0.78 and showed a trend of steeper slopes for those stations with a higher contribution of smaller macrobenthos. Combining all stations per each season resulted in regression slopes within the range of –0.13 in November 2008 and –0.52 in June 2008 and February 2009. The NBSS from all early spring campaigns did not fit to a linear model (b = –0.13; P > 0.5) as also was the case for all samples from Station S3. The number of size-classes varied between 8 and 12 for those stations located at the river mouth. The number of size-classes was lower (5 to 7) at the fjord mouth station, which might explain the non-linearity of these spectra (cf. also Saiz-Salinas & González-Oreja, Reference Saiz-Salinas and González-Oreja2000). The intercept of the NBSS has been proposed as an indicator for total biomass in the system (Sprules & Munawar, Reference Sprules and Munawar1986). In our study, the intercept values of the NBSS ranged from −3.61 (November 2008) to −1.64 (June 2008), thus coinciding with the trends observed in total biomasses in November and June, respectively.
Normalized biomass size-spectra plots of the macrofauna obtained at three stations in the study area. The equation parameters, the squared correlation coefficient (r2), the standard error of the slopes (SEslope) and the P values are indicated for all data sets in each regression.

Relationships between environmental and biological data
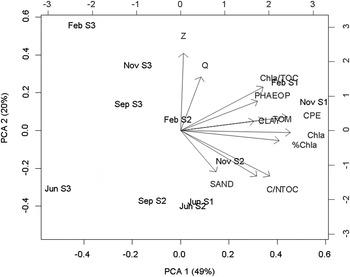
The results of the PCA ordination based on twelve environmental (depth, freshwater input, granulometric fractions, TOM, TOC, C/N ratio and phytopigment content in the sediments) variables are presented in Figure 6. The first two PCA axes accounted for 69% of the total variance. The environmental variables TOC and Chl-a content in the sediments accounted mostly for differences in the organism densities in the two locations. In fact, TOC, C/N ratio, and phytopigment content in the sediments were more associated with Stations S1 and S2 (river mouth stations), whereas depth exhibited a better association with Station S3 (fjord mouth).
Principal component analysis (PCA) of environmental variables in the study area. Z, depth; Sand, % sand; Clay, % clay; TOM, total organic matter; TOC, total organic carbon; Chl-a, chlorophyll-a; Phaeop, phaeopigment; CPE, chloroplastic pigment equivalent; Q, freshwater input.

The multi-regression-analysis (MRA) was used to assess the explanatory role of the environmental variables for macrobenthic parameters (Table 4). This analysis selected from the total of 12 environmental parameters just TOC, TOC/TN, Chl-a and %Chl-a in CPE to explain best the differences in the macrobenthos abundance patterns. This model associates 87% and 93% of the variance in macrofauna abundance with TOC and Chl-a, respectively. In addition, the slope of the NBSS was negatively related to sediment TOC (−0.71; P < 0.05) and Chl-a content (−0.76; P < 0.01), while the intercept of the NBSS was positively related to TOC (0.77; P < 0.01) and Chl-a (0.78; P < 0.01), suggesting that biomass of macrobenthic communities tends to be high mainly due to small-bodied organisms.
Summarized results of the multiple-regression analysis of community data versus environmental parameters.

Only significant variables are presented. *, P < 0.05; **, P < 0.01; ***, P < 0.001.
N, abundance; H′, diversity; b, slope of normalized biomass size-spectra (NBSS); a, intercept of NBSS; DF, deposit feeders; SDF, sub-surface deposit feeders; OM, omnivorous.
DISCUSSION
Fjords in Southern Chile are generally influenced by very high freshwater input from glacial and non-glacial river discharge. A mixture of emergent vascular terrestrial woody plants and freshwater phytoplankton provides an OM subsidy to the benthic ecosystem in the Baker Fjord as has been observed also in other fjords (McLeod & Wing, Reference McLeod and Wing2009; McLeod et al., Reference McLeod, Wing and Skilton2010). The C/N ratio is widely used as a proxy for discriminating between marine and terrestrial organic matter in sediments (Silva et al., Reference Silva, Vargas and Prego2010). The C:N ratio (molar TOC:TN) in benthic sediment was higher in the river mouth (7.6–16.6) than in the fjord mouth (3.7–6.2), as also was the case with Chl-a and CPE concentrations (84.9 Chl-a µg g−1, 213.77 CPE µg g−1) versus 43.9 Chl-a µg g−1, 119.03 CPE µg g−1 in the fjord mouth. Based on binary mixing and assuming a C:N ratio of 20 for terrestrial and 6 for algal organic matter the C:N ratio of benthic organic matter appeared in a range being typical for Chilean fjords (Silva et al., Reference Silva, Vargas and Prego2010). We estimated that the percentage of terrestrial POM in the river mouth stations may be as high as 75%. This percentage of terrestrial POM input is similar to values reported for Aysen Fjord (54–86%) and Puyuhuapi Channel (66–96%) using δ13C (Silva et al., Reference Silva, Vargas and Prego2010).
In the present study, the macrobenthic communities are dominated by small-bodied organisms, mainly polychaetes such as paranoids (Levinsenia antartica and Aricidea antarctica), capitellids (Capitella sp.), cirratulids (Aphelochaeta marioni) and cossurids (Cossura sp.). Large-bodied polychaetes such as maldanids (Maldane sarsi) and arenicolids (Abarenicola sp.) were also found in the river mouth but in low abundances. Polychaete diversity has been considered to be a good indicator also for diversity of the whole community in other fjord ecosystems (e.g. Olsgard et al., Reference Olsgard, Brattegard and Holthe2003; Wlodarska-Kowalczuk et al., Reference Wlodarska-Kowalczuk, Pearson and Kendall2005; Brewin et al., Reference Brewin, Robert and Barker2008). In our study, polychaetes comprised 80% of the total faunal abundance in the river mouth and 67% in the fjord mouth. Similar patterns were also observed for biomass. Assuming that macrofauna wet weight is composed of approximately 4.3% organic carbon (Rowe, Reference Rowe and Rowe1983) the total macrofauna benthic biomass ranged from 0.02 g C m−2 to 1.56 g C m−2. These values are quite similar to those reported by Thatje & Mutschke (Reference Thatje and Mutschke1999) for the South Patagonian Ice Field (0.01–2.1 g C m−2), although the relative contribution of major taxa differs significantly between the two study sites. According to these authors polychaetes contributed in the South Patagonian Ice Field stations only 25% of total macrofauna, and echinoids together with holothuroids contributed about 47%.
Changes in species distribution and/or abundance along environmental gradients have been described for many fjords (Warwick, Reference Warwick1988; Syvitski et al., Reference Syvitski, Farrow, Atkinson, Moore and Andrews1989; Aitken & Fournier, Reference Aitken and Fournier1993; Wlodarska-Kowalczuk et al., Reference Wlodarska-Kowalczuk, Pearson and Kendall2005, Reference Wlodarska-Kowalczuk, Szymelfening and Zajaczkowski2007; Brewin et al., Reference Brewin, Robert and Barker2008; Webb et al., Reference Webb, Barnes and Gray2009; Kedra et al., Reference Kedra, Wlodarska-Kowalczuk and Westlawski2010). The composition of the Baker Fjord communities appeared to be similar to those found in different fjords and channels of the South Patagonian Ice Field (Thatje & Mutschke, Reference Thatje and Mutschke1999; Montiel et al., Reference Montiel, Gerdes, Hilbig and Arntz2005), although our findings of some groups in the Baker River (Paraonidae, Capitellidae, Cirratulidae, Cossuridae and Nephtyidae), support the notion of ‘opportunistic’ species in fjord–estuary habitats. The observed differences in species composition between fjord and estuary communities may reflect different environmental tolerances or dispersal capabilities. Our study shows that chronic physical disturbance of natural origin associated with river discharge and release of suspended particulate material, which maintain high levels of benthic POM, shape the benthic communities. The quality of the OM in the sediments was found to be a main factor for different spatial macrofauna patterns as indicated by PCA and MRA (Figure 6; Table 4). These spatial patterns are consistent with the distribution of abundance and biomass values as well as with species richness and feeding modes and can be associated with the model of organic enrichment proposed by Pearson & Rosenberg (Reference Pearson and Rosenberg1978). In the river mouth, the macrobenthic community appeared to be dominated by small-bodied polychaetes, characterized by continuous year-round breeding, short life-spans, and fast turnover rates. Sub-surface deposit feeders were the most important functional group, in turn associated with high levels of TOC and CPE in the sediments (Table 4). In contrast, the fjord mouth community was dominated by polychaetes and molluscs (Thyasiridae and Nuculanidae) and representatives of suspension feeders and carnivores gained importance.
In our study area, the combination of enhanced ablation rates and accelerated glacier retreat contributed to an increase in the discharge of melt-water and increased also the frequency of large flood events with turbid glacial melt-water into the coastal fjord and river (Figure 2; Dussaillant et al., Reference Dussaillant, Benito, Buytaert, Carling, Meier and Espinoza2009). Large quantities of POM are transported into the river and fjord producing changes in the environmental conditions in both water column and sediments, with consequences also for the communities. Our results indicate that only few disturbance-tolerant species dominated the benthos. The direct effects of high sedimentation rates have not been measured in the Baker Fjord, but we suppose that this sedimentation is accompanied by frequent sediment gravity flows as reported by Zajaczkowski & Wlodarska-Kowalczuk (Reference Zajaczkowski and Wlodarska-Kowalczuk2007). These authors proposed that high sedimentation rates can be destructive for the benthic fauna, because they can alter sediment texture and stability, impede animals from maintaining the optimum position in the sediment, bury larvae and adult organisms, and clog the feeding and respiratory organs of macrobenthic species. These authors also suggested this type of perturbation to be similar to effects from dredging. Our observations support this hypothesis with the benthic communities being distributed in well defined patches of different successional stages, probably related to disturbance by high sedimentation.
It is known that functional group (or feeding mode) diversity may be a better indicator for ecosystem function than species richness (e.g. Wieking & Kröncke, Reference Wieking and Kröncke2005; Wlodarska-Kowalczuk et al., Reference Wlodarska-Kowalczuk, Pearson and Kendall2005). Pearson & Rosenberg (Reference Pearson and Rosenberg1978) predicted that organic enrichment is followed by an increase in the dominance of surface deposit feeders. In general, sub-surface deposit feeding macrofauna organisms have been related to specific TOC levels (e.g. Somerfield et al., Reference Somerfield, Cochrane, Dahle and Pearson2006; McLeod & Wing, Reference McLeod and Wing2009). In the present study, the large contribution of the sub-surface deposit feeders (>69%) at the river mouth stations seems to support this hypothesis. In the fjord mouth, the sub-surface deposit feeders decreased and the deposit feeders and suspension feeders increased. Such a trend has been also observed along a gradient of glacial disturbance in an Arctic fjord (Wlodarska-Kowalczuk et al., 2005). In areas that experience disturbance macrobenthic communities are more complex characterized by different size-classes and feeding modes, which continuously follow changes in environmental conditions. In the present study, the dominance of sub-surface deposit feeding species such as L. antarctica and A. antarctica in the river mouth appears to be associated with a considerable supply of high quality organic matter to the sediment. The frequent deposition and resuspension of phytodetritus, vascular plant fragments and other suspended particles in the bottom-near water layer (i.e. benthic fluff) may explain the high abundance of sub-surface deposit feeders in our study area, as has been mentioned also for other fjord systems (Wieking & Kröncke, Reference Wieking and Kröncke2005). These authors note high abundances of interface feeders such as Spiophanes bombyx and the bivalve Fabulina fabula, related to hydrodynamic stress on the seabed of the Dogger Bank, North Sea.
The NBSS of the macrobenthic communities in the Baker Fjord were similar to those also known from other ecosystems (Drgas et al., Reference Drgas, Radziejewska and Warzocha1998; Saiz-Salinas & Ramos, Reference Saiz-Salinas and Ramos1999; Quiroga et al., Reference Quiroga, Quiñones, Palma, Sellanes, Gallardo, Gerdes and Rowe2005; Rakocinski & Zapfe, Reference Rakocinski, Zapfe and Bortone2005; Akoumianaki et al., Reference Akoumianaki, Papaspyrou and Nicolaidou2006; Wang et al., Reference Wang, Yuan and Zhang2010). It is well known that the slope of the NBSS can be used as an indicator for the influence of environmental conditions (Quiroga et al., Reference Quiroga, Quiñones, Palma, Sellanes, Gallardo, Gerdes and Rowe2005; Akoumianaki et al., Reference Akoumianaki, Papaspyrou and Nicolaidou2006; Wang et al., Reference Wang, Yuan and Zhang2010). Our results show the slopes of the NBSS to be negatively related to TOC and Chl-a content in the sediments, indicating that a large standing stock of small-bodied macrofauna (i.e. paranoids, capitellids and cirratulids) is associated with high levels of the OM, in particular in the river mouth stations. We suggest the small macrobenthic species to be better adapted to changing environmental conditions associated with river discharge in the study area. The results also indicate that the NBSS approach can be used effectively to detect possible changes in the macrobenthic community structure associated with high OM input into the river mouth.
Environmental disturbance affecting the Baker River ecosystem occurs at different spatial and temporal scales. Since April 2008 five GLOFs occurred in the North Patagonian Ice Field. These events transported huge quantities of suspended sediment with coarse and fine POM of vascular plant origin. The organic and inorganic materials produced changes in the physical and chemical conditions of the water column and the sediments alike. It is important to mention that our knowledge about biological processes and carbon fluxes between the pelagic and benthic system in the study area still is rather limited. Additional disturbance regimes such as the planned hydropower dams in the Baker River (HidroAysén, 2008) create further complications for future evaluations of the benthic community response. It is known that dam construction and operation can produce negative effects on benthic systems (e.g. Baxter, Reference Baxter1977; Pandian, Reference Pandian1980). In this context, we believe that in future monitoring programmes adequate indices for the sediment conditions and consequent macrofauna response have to be included. This study suggests that feeding mode and NBSS can be used to detect possible changes caused by natural perturbations such as GLOFs or anthropogenic stressors associated with the ecological impacts generated during the construction and operation of hydroelectric power stations in the Baker River.
ACKNOWLEDGEMENTS
This research was funded by FONDECYT project No. 11075105 (CONICYT). Additional funds were provided by FONDAP–COPAS project COPAS Sur-Austral, No. PFB 31/2007. Eduardo Quiroga and Brian Reid were funded by two CIEP–CONICYT projects (Proyectos Fortalecimientos). Renato Quiñones was funded by the Centre for Oceanographic Research in the Eastern South Pacific (COPAS; Grant PFB-31/2007, CONICYT). We thank Juan Ramón Velásquez, Rodrigo Mansilla and Jorge Arratia (LC Halet) for help with sample sorting as well as excellent field support.