Introduction
Water is essential not only for life but also for the advancement of human civilization. In regions with low and unevenly distributed precipitation, effective management of water resources is crucial due to their limited availability, which is necessary for supporting agriculture, maintaining ecosystems and ensuring sustainability. Persistent challenges, such as water scarcity, drought and changes in rainfall patterns, threaten resource management and agricultural productivity, with far-reaching implications for water and food security, particularly in developing countries located in water-scarce regions (Trigo et al., Reference Trigo, Gouveia and Barriopedro2010; Schewe et al., Reference Schewe, Heinke, Gerten, Haddeland, Arnell, Clark, Dankers, Eisner, Fekete, Colón-González, Gosling, Kim, Liu, Masaki, Portmann, Satoh, Stacke, Tang, Wada, Wisser, Albrecht, Frieler, Piontek, Warszawski and Kabat2014; Huang et al., Reference Huang, Li, Fu, Chen, Fu, Dai, Shinoda, Ma, Guo, Li, Zhang, Liu, Yu, He, Xie, Guan, Ji, Lin, Wang, Yan and Wang2017; Nath et al., Reference Nath, Luo, Chen and Cui2018; KhazaiPoul et al., Reference KhazaiPoul, Moridi and Yazdi2019; Nouri, Reference Nouri2023; Veysi et al., Reference Veysi, Galehban, Nouri, Mallah and Nouri2024). Rapid population growth further exacerbates these challenges, emphasizing the urgent need for sustainable solutions.
Water scarcity is defined as a situation where water demand exceeds water availability (European Commission, 2012). This imbalance, reflected in the dynamics of the Water Supply-Demand Balance (WSDB), evolves as either water supply decreases continuously or water demand increases sharply. The implications of this imbalance vary greatly across regions and farming systems, depending on local policies and conditions (Bazzani, Reference Bazzani2005). Studies have shown that the water balance is increasingly negative globally, highlighting the need for improved agricultural water management to achieve a sustainable WSDB (Schieder, Reference Schieder2011; Topcu, Reference Topcu2011; Bhagat, Reference Bhagat2014; Doungmanee, Reference Doungmanee2016; Li et al., Reference Li, Yang and Tan2019a; Gong et al., Reference Gong, Zhang, Ren, Sun and Yang2020; Yousaf et al., Reference Yousaf, Awan, Kamran, Ahmad, Bodla, Riaz, Umar and Chohan2021). Achieving sustainable agricultural water management in water-scarce areas requires a clear understanding of WSDB dynamics. Therefore, understanding these dynamic relationships is very important for efficient water resource allocation, ensuring efficiency, equity and promoting long-term sustainability (Deng et al., Reference Deng, Guo, Yin, Zeng and Chen2022). Several methods have been developed to assess water scarcity, with recent studies focusing on the Water Scarcity Index (WSI) and Water Poverty Index (WPI) to monitor the evolving water supply-demand dynamics (Guo and Shen, Reference Guo and Shen2016; Chen et al., Reference Chen, Li, Li, Hu and Hu2020a, Reference Chen, Li, Yang, Zhou, Pan and Li2020b; Liu et al., Reference Liu, Liu, Yang, Ciais and Wada2022b, Reference Liu, Liu, Tang, Liu, Wada and Yang2022a; Wang et al., Reference Wang, Huang, Liu, Zan, Ling and Guo2022).
Over-withdrawal of surface water by the agricultural sector has significantly reduced river discharge, leading to growing imbalances within the WSDB. This reduction, coupled with pollution and scarcity, has constrained socio-economic development and regional ecosystems in sensitive areas (Zuo et al., Reference Zuo, Zhao and Ma2014; Zhou et al., Reference Zhou, Sun and Xu2015; An et al., Reference An, Fan, Huang, Yang, Wu, Wang and Khanal2021; Zarepour Moshizi et al., Reference Zarepour Moshizi, Yousefi, Amini and Shojaei2022). Agricultural activities are especially affected, as insufficient water availability fails to meet crop water requirements, placing substantial stress on cropping systems (Parraguez-Vergara et al., Reference Parraguez-Vergara, Contreras, Clavijo, Villegas, Paucar and Ther2018; Gu et al., Reference Gu, Qi, Burghate, Yuan, Jiao and Xu2020). Scientists have proposed measures, such as the rational allocation of limited water resources, sustainable soil management and improvements in irrigation efficiency to mitigate the growing imbalance and water shortages (Wu and Suo, Reference Wu and Suo2004; Boithias et al., Reference Boithias, Acuña, Vergoñós, Ziv, Marcé and Sabater2014; Wang et al., Reference Wang, Huang, Liu, Zan, Ling and Guo2022).
Addressing the WSDB spatially and temporally is critical, as it varies with different spatial-temporal resolutions (Syrbe and Walz, Reference Syrbe and Walz2012). Multi-objective Optimization Problem (MOOP) approaches, which simultaneously optimize competing objectives (economic, social and environmental benefits), have been employed to tackle challenges such as optimal water resource allocation (Tian et al., Reference Tian, Huang, Niu, Qin, Pei and Wang2019; Deng et al., Reference Deng, Guo, Yin, Zeng and Chen2022) and improvements in water distribution systems and reservoir operations (Monsef et al., Reference Monsef, Naghashzadegan, Jamali and Farmani2019; Yao et al., Reference Yao, Dong, Li, Ni, Chen, Chen, Jia and Huang2022; Bai et al., Reference Bai, Ji, Yang, Huang and Liu2022). Commonly used MOOP optimization algorithms include Non-dominated Sorting Differential Evolution (NSDE), Particle Swarm Optimization (PSO), Multi-objective Particle Swarm Optimization (MOPSO), Multi-objective Emperor Penguin Optimizer (MOEPO), Multi-objective Uncertain Chance Constrained Programming (MUCCP), and genetic algorithms. These optimization algorithms are often integrated with simulation models like the Soil and Water Assessment Tool (SWAT) and the Water Evaluation and Planning (WEAP) system, to simulate real-world conditions and predict water supply and demand dynamics (KhazaiPoul et al., Reference KhazaiPoul, Moridi and Yazdi2019; Hatamkhani and Moridi, Reference Hatamkhani and Moridi2021; Yousefi and Moridi, Reference Yousefi and Moridi2022; Akbari et al., Reference Akbari, Shourian and Moridi2022). Despite the advancements in these optimization methods and models, their application in large-scale traditional irrigation schemes remains a challenge due to the spatiotemporal variability of cropping patterns (Alsenjar et al., Reference Alsenjar, Cetin, Aksu, Akgul and Golpinar2022). Consequently, applying WSDB measures at the catchment scale for near-real-time decision-making, as suggested by Yousaf et al. (Reference Yousaf, Awan, Kamran, Ahmad, Bodla, Riaz, Umar and Chohan2021), is vital for enhancing the resilience of agricultural systems in developing countries where individual field sizes are often smaller than 0.1 ha (30 m × 30 m).
On the demand side, estimating evapotranspiration (ET) in developing countries remains difficult, due to uncertainties in determining the cropping pattern and the lack of reliable ground truth data on crop types and cultivation area (Alsenjar et al., Reference Alsenjar, Cetin, Aksu, Akgul and Golpinar2022; Cetin et al., Reference Cetin, Alsenjar, Aksu, Golpinar and Akgul2023b). However, emerging cloud-based satellite techniques offer a time- and cost-effective alternative, addressing these data limitations and enabling the estimation of ET and water productivity across large-scale traditional irrigation schemes (Veysi et al., Reference Veysi, Galehban, Nouri, Mallah and Nouri2024). These techniques provide superior spatial and temporal coverage, as well as real-time predictions, outperforming traditional methods. Additionally, Machine Learning (ML) algorithms like Support Vector Machine (SVM), Random Forest (RF), Decision Tree (DT) algorithms and Extreme Gradient Boosting (XGBoost), have proven effective for monitoring Land Use/Land Cover (LULC) and crop types using RS data (Qiu et al., Reference Qiu, Luo, Tang, Chen, Lu, Huang, Chen, Chen and Xu2017; Tian et al., Reference Tian, Huang, Niu, Qin, Pei and Wang2019; Dong et al., Reference Dong, Fu, Wang, Tian, Fu, Niu, Han, Zheng, Huang and Yuan2020; Becker et al., Reference Becker, Ló, Johann and Mercante2021a; Zhang et al., Reference Zhang, Du, Zhang and Zhang2021; Tsendbazar et al., Reference Tsendbazar, Li, Koopman, Carter, Herold, Georgieva and Lesiv2021; You et al., Reference You, Dong, Huang, Du, Zhang, He, Yang, Di and Xiao2021; Ren et al., Reference Ren, Xu, Cai, Yu and Qi2022). Integrating these ML algorithms with cloud-free computing platforms such as Google Earth Engine (GEE) has streamlined processing, enabling faster and more accurate analysis of cropping patterns (Gorelick et al., Reference Gorelick, Hancher, Dixon, Ilyushchenko, Thau and Moore2017).
Arid and semi-arid regions are types of drylands, which are among the most sensitive areas to climate change and human interventions (Huang et al., Reference Huang, Li, Fu, Chen, Fu, Dai, Shinoda, Ma, Guo, Li, Zhang, Liu, Yu, He, Xie, Guan, Ji, Lin, Wang, Yan and Wang2017). In recent decades, Iran’s growing population and rapid economic development have significantly increased water demand, placing immense pressure on the available water supply (Hatamkhani and Moridi, Reference Hatamkhani and Moridi2021). Consistent with previous findings, agriculture remains the largest freshwater consumer in the country, accounting for over 90% of renewable water withdrawal. Iran, situated within the desert belt of the Northern Hemisphere, is predominantly influenced by high-pressure systems and near-tropical currents. Consequently, much of the country experiences arid and semi-arid conditions. Within traditional irrigation networks dominated by smallholder farmers, policymakers often struggle to implement appropriate integrated water management strategies. A key historical turning point was the 1963 land reform, known as the “White Revolution” in Iran (Saatsaz, Reference Saatsaz2020), which transitioned Iran’s social structure from a traditional landownership system (Arbab-Raayati) to a modified system. This reform significantly impacted water distribution and management practices by increasing the prevalence of small-scale farming (Amanat, Reference Amanat2016; Dutta et al., Reference Dutta, Laing, Kumar, Gathala, Singh, Gaydon and Poulton2020).
The Karkheh River Basin (KRB) is the third most fertile basin in Iran and has long been a center of disputes over water resources (Ahmad and Giordano, Reference Ahmad and Giordano2010; Hatamkhani and Moridi, Reference Hatamkhani and Moridi2021; Zaredar et al., Reference Zaredar, Jozi, Khorssani and Shariat2021). With a total of 40 dams and a combined storage capacity of 8326 Million Cubic Meter (MCM), the basin plays a key role in maintaining the national water and energy supplies. However, upstream-downstream conflicts persist, as upstream water resource developments, combined with shifts from forestry to agriculture, smallholder farming, increased anthropogenic water abstraction and the effects of climate change, have collectively boosted local agricultural activities while adversely affecting downstream regions. Although upstream provinces in the KRB (e.g., Lorestan and Ilam) benefit socially but not economically from water resource development, downstream provinces, such as Khuzestan, face reduced agricultural Gross Domestic Product (GDP) per capita due to limited water availability (Hatamkhani and Moridi, Reference Hatamkhani and Moridi2021). Climate change projections indicate worsening conditions, with declining precipitation and snow cover, coupled with rising air temperatures, by the end of this century. These changes are expected to exacerbate downstream conditions and further reduce inflows to the Persian Gulf, largely due to inadequate upstream water management practices (Ghafouri et al., Reference Ghafouri, Siadat and Oweis2012; Ahmadi et al., Reference Ahmadi, Rostami and Dadashi-roudbari2020). Therefore, the continued development of water resources without considering their basin-wide impacts and the implications of climate change will only make the current traditional irrigation system even more inefficient.
The availability of water supply heavily depends on climatic conditions, while management policies and practices are key factors influencing water demand, especially at larger scales (Boithias et al., Reference Boithias, Acuña, Vergoñós, Ziv, Marcé and Sabater2014). In water-scarce regions, managing the WSDB is particularly challenging in areas where smallholder farmers compete for limited resources. These challenges are compounded by inefficiencies in traditional irrigation systems and the complexity associated with diverse cropping patterns. In Iran, a major obstacle is the lack of reliable data on cultivated areas and crop types at the sub-basin level, which complicates water demand estimation. While previous studies have largely focused on macro-level solutions at national and regional scales, advancements in Remote Sensing (RS) techniques now enable finer-scale analyses for optimizing agricultural water management, even in regions with traditional irrigation networks. To fill this research gap, this study aims to: 1) analyze the trend of water supply in the study area based on observed streamflow data; 2) investigate the short-term changes in the WSDB via RS data, and 3) evaluate the effect of existing cropping patterns on the WSDB in the Honam sub-basin, a mountainous semi-arid region characterized by a traditional irrigation network.
Materials and methods
Study area
The study was conducted in the Honam sub-basin, located in the upper reaches of the KRB, in Lorestan province, Iran. Covering approximately 14,200 ha, the sub-basin lies between 33° 47′ N and 33° 51′ N latitude and 48° 12′ E and 48° 28′ E longitude (Fig. 1). According to data from the Alashtar meteorological station, the dry period lasts around 185 days, spanning from mid-May to the end of October. The geomorphology of the area consists of alluvial fans (9.2%), plateaus (10.3%), piedmont plains (10.6%), hills (0.3%) and mountains and outcrops (69.6%), with varying land use and vegetation cover (De Pauw et al., Reference De Pauw, Mirghasemi, Ghaffari and Nseir2008). Silty clay is the dominant soil texture in irrigated lands (57.8%), followed by silty clay loam (34.5%), clay (6.9%) and clay loam (0.8%). Based on the agronomic soil texture classification standard (Jadczyszyn et al., Reference Jadczyszyn, Niedźwiecki and Debaene2017), these soils are categorized as heavy soils. The groundwater level in the region ranges from 0.5 to 35 meters in depth, and the Sarab-e Honam serves as the primary source of river water for irrigating agricultural lands. Over the past few decades, surface water has become increasingly critical for agricultural activities. Local farmers are smallholders who primarily use flood irrigation and practice single-crop rotation. The major irrigated crops are winter wheat, alfalfa, clover, winter barley, sugar beet and beans.
Geographical location of Honam sub-basin within Karkheh River Basin (KRB), South-West Iran.

Data sets
Meteorological data
The Alashtar synoptic meteorological station (48° 15 ′ E, 33° 49 ′ N) is the nearest station to the Honam sub-basin and is located inside the study area (Fig. 1). The climatic data were obtained from the Iran Meteorological Organization (IRIMO) for a period of 22 years (2000–2021). The daily data included minimum, maximum and average temperature (°C), wind speed at 10 m height (m/s), minimum and maximum relative humidity (%), duration of sunshine/daylight (hours) and precipitation (mm). The dataset was thoroughly checked out and found to be complete, with no missing values or outliers.
Vegetation cover
In this study, the European Space Agency (ESA) WorldCover product 2021 (Zanaga et al., Reference Zanaga, Van De Kerchove, De Keersmaecker, Souverijns, Brockmann, Quast, Wevers, Grosu, Paccini, Vergnaud, Cartus, Santoro, Fritz, Georgieva, Lesiv, Carter, Herold, Linlin, Tsendbazar, Raimoino and Arino2021), with a 10-m resolution, was used for the discrimination of Land Use/Land Cover (LULC) types based on Sentinel-1 and Sentinel-2 data. The results of Mallah et al. (Reference Mallah, Gorji, Balali, Asadi, Davatgar, Varmazyari, Stellacci and Castellini2023) showed that the ESA LULC map could achieve high accuracy, with an Overall Accuracy (OA) = 0.92 and Kappa (KA) = 0.90, especially for the cropland class in the region. To avoid interference from non-cropland classes in crop-type mapping, cropland was masked out from the ESA LULC product (Ren et al., Reference Ren, Xu, Cai, Yu and Qi2022). Liu et al. (Reference Liu, Gong, Wang, Clinton, Bai and Liang2020) also stated that LULC classes can be effectively used for masking, as cropland changes are negligible over several years.
The current study integrated all the spectral vegetation indices listed in Table 1, which were derived from 42 Landsat-8 time-series images with less than 20% cloud cover, following the methodologies of previous studies (Qiu et al., Reference Qiu, Luo, Tang, Chen, Lu, Huang, Chen, Chen and Xu2017; Tian et al., Reference Tian, Huang, Niu, Qin, Pei and Wang2019; Dong et al., Reference Dong, Fu, Wang, Tian, Fu, Niu, Han, Zheng, Huang and Yuan2020; Zhang et al., Reference Zhang, Du, Zhang and Zhang2021; You et al., Reference You, Dong, Huang, Du, Zhang, He, Yang, Di and Xiao2021; Ren et al., Reference Ren, Xu, Cai, Yu and Qi2022). These indices were employed to map farming systems and crop types for the years 2019–2021. Details of the integration process and how these indices were combined to produce the final map are elaborated in the following section.
The vegetation indices for the crop-type mapping of 2019–2021

 ${R_{NIR}}$
,
 $R{\;_{Red}}$
,
 ${R_{Swir1}}$
and
 $R{\;_{Swir2}}\;$
correspond to the reflectance of band 5 (near infrared), band 4 (red), band 6 (short wave infrared) and band 7 (short wave infrared) of Landsat-8, respectively and
 $\;R{\;_{Blue}}$
,
 $\;{R_{Green\;}}$
are band 2 (blue) and band 3 (green) of the electromagnetic spectrum.
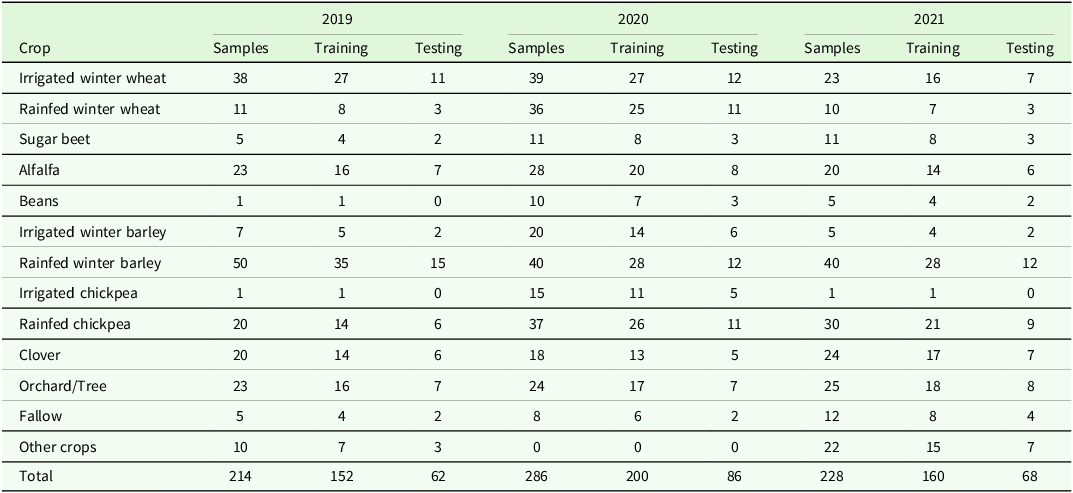
Ground truth data were collected through field surveys conducted in croplands during winter, spring and the peak irrigation period in summer (Cetin et al., Reference Cetin, Alsenjar, Aksu, Golpinar and Akgul2023b). The coordinates of the surveyed farms were recorded using a handheld GPS device [UTM, Datum = WGS84]. In total, 214 GPS-based crop-type samples were acquired in 2019, 286 in 2020 and 228 in 2021 using the Latin Hypercube Sampling (LHS) scheme (Iman, Reference Iman2008). Surveys were conducted across cultivation areas, as shown in Table 2. To prevent sample overlap and effectively distinguish between crop types, classification was performed separately for irrigated and rainfed farms. All classification tasks were conducted using the Random Forest (RF) algorithm, a well-known Machine Learning method, with big data processing carried out on the Google Earth Engine. Numerous studies have highlighted RF as one of the most widely used algorithms for LULC classification, as well as for mapping farming systems and crop types using vegetation indices (Kelley et al., Reference Kelley, Pitcher and Bacon2018; Teluguntla et al., Reference Teluguntla, Thenkabail, Oliphant, Xiong, Gumma, Congalton, Yadav and Huete2018; Jin et al., Reference Jin, Liu, Chen and Liang2018; Maxwell et al., Reference Maxwell, Strager, Warner, Ramezan, Morgan and Pauley2019; Phan et al., Reference Phan, Kuch and Lehnert2020; Magidi et al., Reference Magidi, Nhamo, Mpandeli and Mabhaudhi2021; Fernando and Senanayake, Reference Fernando and Senanayake2023; Zhao et al., Reference Zhao, Islam, Waseem, Tariq, Nawaz, Islam, Bibi, Rehman, Ahmad, Aslam, Raza and Hatamleh2024). Several experiments to determine the optimal number of trees for the RF algorithm were conducted in this study, and 200 trees were found to produce stable results.
The number of in-situ observations used for deriving and validating crop-type maps

The ground-truth dataset was then divided into two subsets: training (70%) and testing (30%). The testing dataset was used to evaluate the accuracy of the final maps using metrics such as Overall Accuracy (OA), User’s Accuracy (UA), Producer’s Accuracy (PA) and the Kappa coefficient (KA). According to Congalton (Reference Congalton1991) and Congalton and Green (Reference Congalton and Green2008), OA is the proportion of correctly classified pixels (diagonal elements) divided by the total number of pixels used for testing. UA represents the fraction of correctly classified pixels relative to the total number of classified pixels, while PA measures the fraction of correctly classified pixels relative to the total number of reference pixels. Thomlinson et al. (Reference Thomlinson, Bolstad and Cohen1999) suggested that an LULC classification can be considered accurate when the OA is at least 85% and the per-class accuracy is at least 70%. The KA evaluates the proportion of correct classifications while accounting for random chance, with values in the upper range (≥0.8) considered “almost perfect” (Landis and Koch, Reference Landis and Koch1977).
Phenology and crop coefficient of major crops
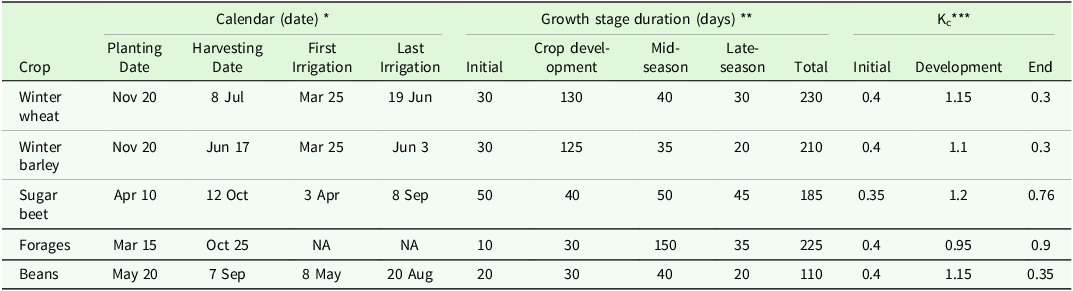
Based on the geographically referenced field surveys conducted in this study, cropping patterns across the study area are predominantly composed of Triticum aestivum L. (winter wheat), Medicago sativa (alfalfa), Trifolium (clover), Hordeum vulgare L. (winter barley), Beta vulgaris (sugar beet) and Phaseolus vulgaris L. (beans). The crop coefficient (Kc) values are mainly influenced by vegetative characteristics such as the planting calendar, stage duration and rooting depth, and only slightly by climatic factors (Allen et al., Reference Allen, Pereira, Smith, Raes and Wright2005). Therefore, the duration of the growing stages (initial, crop development, mid-season and late season), as well as sowing and harvesting dates, were collected via 104 field survey questionnaires (Table 3).
Information of major crops in irrigated lands of the study area

Kc***: crop coefficient; NA: not available. Note: Information collected from: * key informant interviews, ** FAO Irrigation and drainage paper No. 56 (Allen et al., Reference Allen, Pereira, Raes and Smith1998).
The initial stage runs from planting date to approximately 10% ground cover; the crop development stage runs from 10% ground cover to effective full cover; the mid-season stage runs from effective full cover to the start of maturity; the late season stage runs from the start of maturity to harvest or full senescence.
Fallow and rainfed crop types have been eliminated due to lack of irrigation requirements. Trees/orchards class is non-productive and mainly located across the Honam River.
Kc values were obtained from the FAO Irrigation and Drainage Paper No. 56 (Allen et al., Reference Allen, Pereira, Raes and Smith1998) and adjusted to local climatic conditions. Since the planting calendars and growth stages of alfalfa and clover are identical in arid and semi-arid regions, these crops were grouped into a single category labeled “forages”. The main information on the major crops within the study area is summarized in Table 3.
Determination of reference crop evapotranspiration (ETo)
In this study, ETo values were calculated using a climatic dataset based on the modified FAO Penman-Monteith (FAO-PM) equation (Allen et al., Reference Allen, Pereira, Raes and Smith1998). The calculation of ETo using the modified FAO-PM was carried out in CROPWAT-8 (FAO, 2009).
 $$E{T_0} = \;{{0 \cdot 408\Delta \left( {{R_n} - G} \right) + \;\gamma \;{{900} \over {T + 273}}\;{u_{2\;}}\left( {{e_s} - \;{e_a}} \right)} \over {\Delta + \gamma \;\left( {1 + 0 \cdot 34\;{u_2}} \right)}}$$
where ETo is the reference crop evapotranspiration (mm/day), Rn is net radiation at the crop surface (MJ/m2/day); G is the soil heat flux density (MJ/m2/day); Rn–G is the net balance of energy available at the surface (MJ/m2/day), T is the mean daily air temperature (oC) at a reference 2 m height, (es – ea) is the Vapor Pressure Deficit (VPD) of air (kPa), u2 is the wind speed at 2 m height (m/s), Δ is the slope of the saturation vapor pressure-temperature curve (kPa/°C) and γ is the psychometric constant (kPa/°C). The input data used for the calculation of ETo included minimum and maximum air temperature (oC), minimum and maximum relative humidity (%), sunshine duration (hours) and adjusted wind speed at a height of 2 m above the ground surface (m/s). To adjust wind speed data obtained from instruments placed at a 10 m elevation (rather than the standard height of 2 m), a logarithmic wind speed profile was used, as described by Allen et al. (Reference Allen, Pereira, Raes and Smith1998).
Determination of crop water requirement (ETc)
The ETc was estimated following the “two-step procedure” outlined in FAO-56 (Allen et al., Reference Allen, Pereira, Raes and Smith1998), which incorporates meteorological data and crop-specific information. The standard ETc estimation requires computing ETo and then multiplying it by an adjusted crop coefficient (Kc) according to the crop-type and growing stages under standard conditions, which consist of non-restricting soil water conditions, well-fertilized crops, disease-free plants, grown in large fields and achieving full production.
 $$ET{c_\;} = \;{K_{c\;}} \times \;E{T_0}$$
where ETc is crop water evapotranspiration (mm) and Kc is the crop coefficient of major crops at a specific growth stage (dimensionless).
Due to varying cropping patterns during the 2019–2021 period, the crop water requirement fluctuated. Hence, the regional crop water requirement was calculated according to the formula suggested by Khaydar et al. (Reference Khaydar, Chen, Huang, Ilkhom, Liu, Friday, Farkhod, Khusen and Gulkaiyr2021), Wang et al. (Reference Wang, Huang, Liu, Zan, Ling and Guo2022) and Cetin et al. (Reference Cetin, Alsenjar, Aksu, Golpinar and Akgul2023b):
 $$ET{c_{reg\;}} = \sum\nolimits_{i = 1}^{i = n} {{{ET{c_{i\;}} \times \;{\rm{Ai}}} \over A}} $$
where ETcreg is the regional crop water requirement of the existing cropping pattern (mm); i is the type of major crop (i = 1, 2, 3, 4, 5 and 6), such as winter wheat, winter barley, alfalfa, clover, sugar beet and beans; ETci is the crop water requirement (mm) for a specific crop-type i; Ai is the cultivation area of crop-type i (m2); and A is the total cultivation area (m2) in the sub-basin.
Determination of Effective Precipitation (Peff) and Regional Peff (Peffreg)
Peff can be calculated using four empirical equations in CROPWAT 8.0: the fixed percentage method, the dependable rain method by the Water Resources Development and Management Service of the Food and Agriculture Organization of the UN (FAO/AGLW), the empirical formula method and the USDA-SCS (Soil Conservation Service) (USDA, 1970) method. The calculation of effective precipitation (Peff) was based on the FAO/AGLW (FAO, 1992) method, as it provides realistic values by considering monthly precipitation using the following equations:
 $${\rm{Pef}}{{\rm{f}}_i} = 0.6\; \times \left( {{{\rm{P}}_{{\rm{to}}{{\rm{t}}_{\rm{i}}}}} - 10} \right) {{\rm{, if\,}{P}}_{{\rm{to}}{{\rm{t}}_{\rm{i}}}}} \le 70 {\rm mm}$$
 $${\rm{Pef}}{{\rm{f}}_i} = 0.8\; \times \left( {{{\rm{P}}_{{\rm{to}}{{\rm{t}}_{\rm{i}}}}} - 24} \right) {{\rm{, if\,}{P}}_{{\rm{to}}{{\rm{t}}_{\rm{i}}}}} \gt 70 {\rm mm}$$
where Peff
i is the effective precipitation (mm) for specific crop i and
 ${{\rm{P}}_{{\rm{to}}{{\rm{t}}_{\rm{i}}}}}$
is the monthly precipitation (mm) during the growing season of crop i.
However, Peff is crop-specific, since different crops have distinct growth durations. Crops with growth periods that align closely with the rainy season are likely to utilize precipitation more effectively, resulting in higher Peff values. Therefore, a more precise regional calculation of effective precipitation (Peffreg) is required to account for the variability of crop growth cycles within the cropping pattern in the sub-basin. The revised equation is expressed as:
 $${\rm{Pef}}{{\rm{f}}_{reg\;}} = \sum\nolimits_{i = 1}^{i = n} {{{{\rm{Pef}}{{\rm{f}}_i}_\; \times \;{A_i}} \over A}} $$
where Peffreg is the regional effective precipitation for the cropping pattern, Peff iis the effective precipitation specific to crop i of the sub-basin (mm), A i is the cultivation area of crop i (m2) and A is the total cultivation area (m2) within the sub-basin.
Determination of Net Irrigation Requirement (INET), Regional INET (INETreg) and Regional Gross Irrigation Water Demand (GIWDreg)
The INET was calculated using an established method for each crop according to the following equation:
 $$INE{T_i} = E{T_{ci\;}} - \;{\rm{Peff}}$$
where INET is the net irrigation requirement for the desired crop (mm); i is the type of major crop (i = 1, 2, 3, 4, 5 and 6); ETc is the crop water requirement (mm) for a specific crop-type i; and Peff is the effective precipitation during a growing season (mm).
The developed regional net irrigation requirement (INETreg, mm) and gross regional irrigation water demand (GIWDreg, m3) were calculated individually during the 2019–2021 growing season to compare with the available water (m3/year) annually supplied to irrigated lands in the sub-basin (Equations 8–9), as previously represented by Wang et al. (Reference Wang, Huang, Liu, Zan, Ling and Guo2022) and Khaydar et al. (Reference Khaydar, Chen, Huang, Ilkhom, Liu, Friday, Farkhod, Khusen and Gulkaiyr2021).
 $${\rm{INE}}{{\rm{T}}_{{\rm{reg\;}}}} = \left( {{\rm{\;ET}}{{\rm{c}}_{{\rm{reg}}}} - {\rm{\;Pef}}{{\rm{f}}_{{\rm{reg}}}}} \right){\rm{\;\;}} \times {\rm{A}} \times {10^{ - 3}}_{\rm{\;}}$$
 $${\rm{GIW}}{{\rm{D}}_{{\rm{reg}}\;}} = \left( {{{{\rm{INE}}{{\rm{T}}_{{\rm{reg}}\;}}} \over {{\rm{IE}}}}\;} \right)\;$$
where INETreg is the regional net irrigation requirement (m3); ETcreg is the regional crop water requirement (mm); Peffreg is the regional effective precipitation over the sub-basin (mm); A is the total cultivation area (m2) in the sub-basin; GIWDreg is the gross regional irrigation water demand (m3); and IE is irrigation efficiency (%).
Determination of Surface Irrigation Water Supply (SIWS) and Water Supply-Demand Balance (WSDB)
In this study, the available water resource of the sub-basin was assessed by subtracting incoming and discharging water from the watershed through the river, as Sarab-e Honam serves as the primary surface water source in the region. The river inflow and outflow rate data were obtained from the Iran Water Resources Management Company (IWRM) database for the period 2000–2021 to determine the potential Surface Irrigation Water Supply (SIWS) for irrigated lands in the sub-basin. Finally, to explore the WSDB in the sub-basin, supplied water (SIWS) was considered along with Gross Irrigation Water Demand (GIWD) for the same temporal resolution of 2019–2021, followed by Wang et al (Reference Wang, Huang, Liu, Zan, Ling and Guo2022):
 $${R_{in\;}} - {R_{out\;}} - \;GIW{D_{reg\;}} = WSDB\;$$
where Rin is the water inflow to the sub-basin; Rout is the water outflow from the sub-basin; GIWDreg is the gross irrigation water demand; WSDB is the water supply-demand balance, representing the gap between supply and demand (all parameters are expressed in m3). Positive values of WSDB represent surplus, while negative values represent levels of water shortage.
Water Scarcity Index (WSI) analysis
Several studies have used water scarcity and drought indices in water resources planning and management (Pedro-Monzonís et al., Reference Pedro-Monzonís, Solera, Ferrer, Estrela and Paredes-Arquiola2015), including the well-known Water Scarcity Index (WSI) (Sun et al., Reference Sun, McNulty, Moore Myers and Cohen2008; Li et al., Reference Li, Yang and Tan2019; Chen et al., Reference Chen, Li, Li, Hu and Hu2020a, Reference Chen, Li, Yang, Zhou, Pan and Li2020b) and the Agricultural Water Scarcity Index (WSIag) (Liu et al., Reference Liu, Liu, Yang, Ciais and Wada2022b, Reference Liu, Liu, Tang, Liu, Wada and Yang2022a). These indices were used in this study to classify the level of water shortage.
 $${\rm{WSI}}\; = \;{{{\rm{GIW}}{{\rm{D}}_{{\rm{reg}}}}} \over {{\rm{SIWS}}\;}}$$
 $${\rm{WS}}{{\rm{I}}_{{\rm{ag}}\;}} = \;{{{\rm{INE}}{{\rm{T}}_{{\rm{reg}}}}} \over {{\rm{SIWS}}}}$$
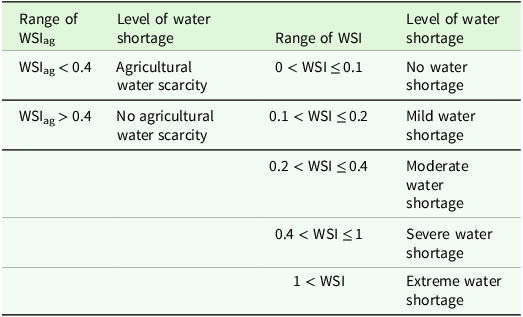
where GIWDreg is the regional gross irrigation water demand; SIWS is the surface irrigation water supply; and INETreg is the regional net irrigation requirement of the existing cropping pattern (all parameters are expressed in m3). The levels of water shortages for WSI (Hoekstra, Reference Hoekstra2014; Guo and Shen, Reference Guo and Shen2016; Hanasaki et al., Reference Hanasaki, Yoshikawa, Pokhrel and Kanae2018; Wang et al., Reference Wang, Huang, Liu, Zan, Ling and Guo2022) and WSIag (Liu et al., Reference Liu, Liu, Yang, Ciais and Wada2022b, Reference Liu, Liu, Tang, Liu, Wada and Yang2022a) are summarized in Table 4.
Classification standard of water scarcity index (WSI) (Sun et al., Reference Sun, McNulty, Moore Myers and Cohen2008; Li et al., Reference Li, Yang and Tan2019; Chen et al., Reference Chen, Li, Li, Hu and Hu2020a, Reference Chen, Li, Yang, Zhou, Pan and Li2020b) and agricultural water scarcity index (WSIag) (Liu et al., Reference Liu, Liu, Yang, Ciais and Wada2022b, Reference Liu, Liu, Tang, Liu, Wada and Yang2022a)

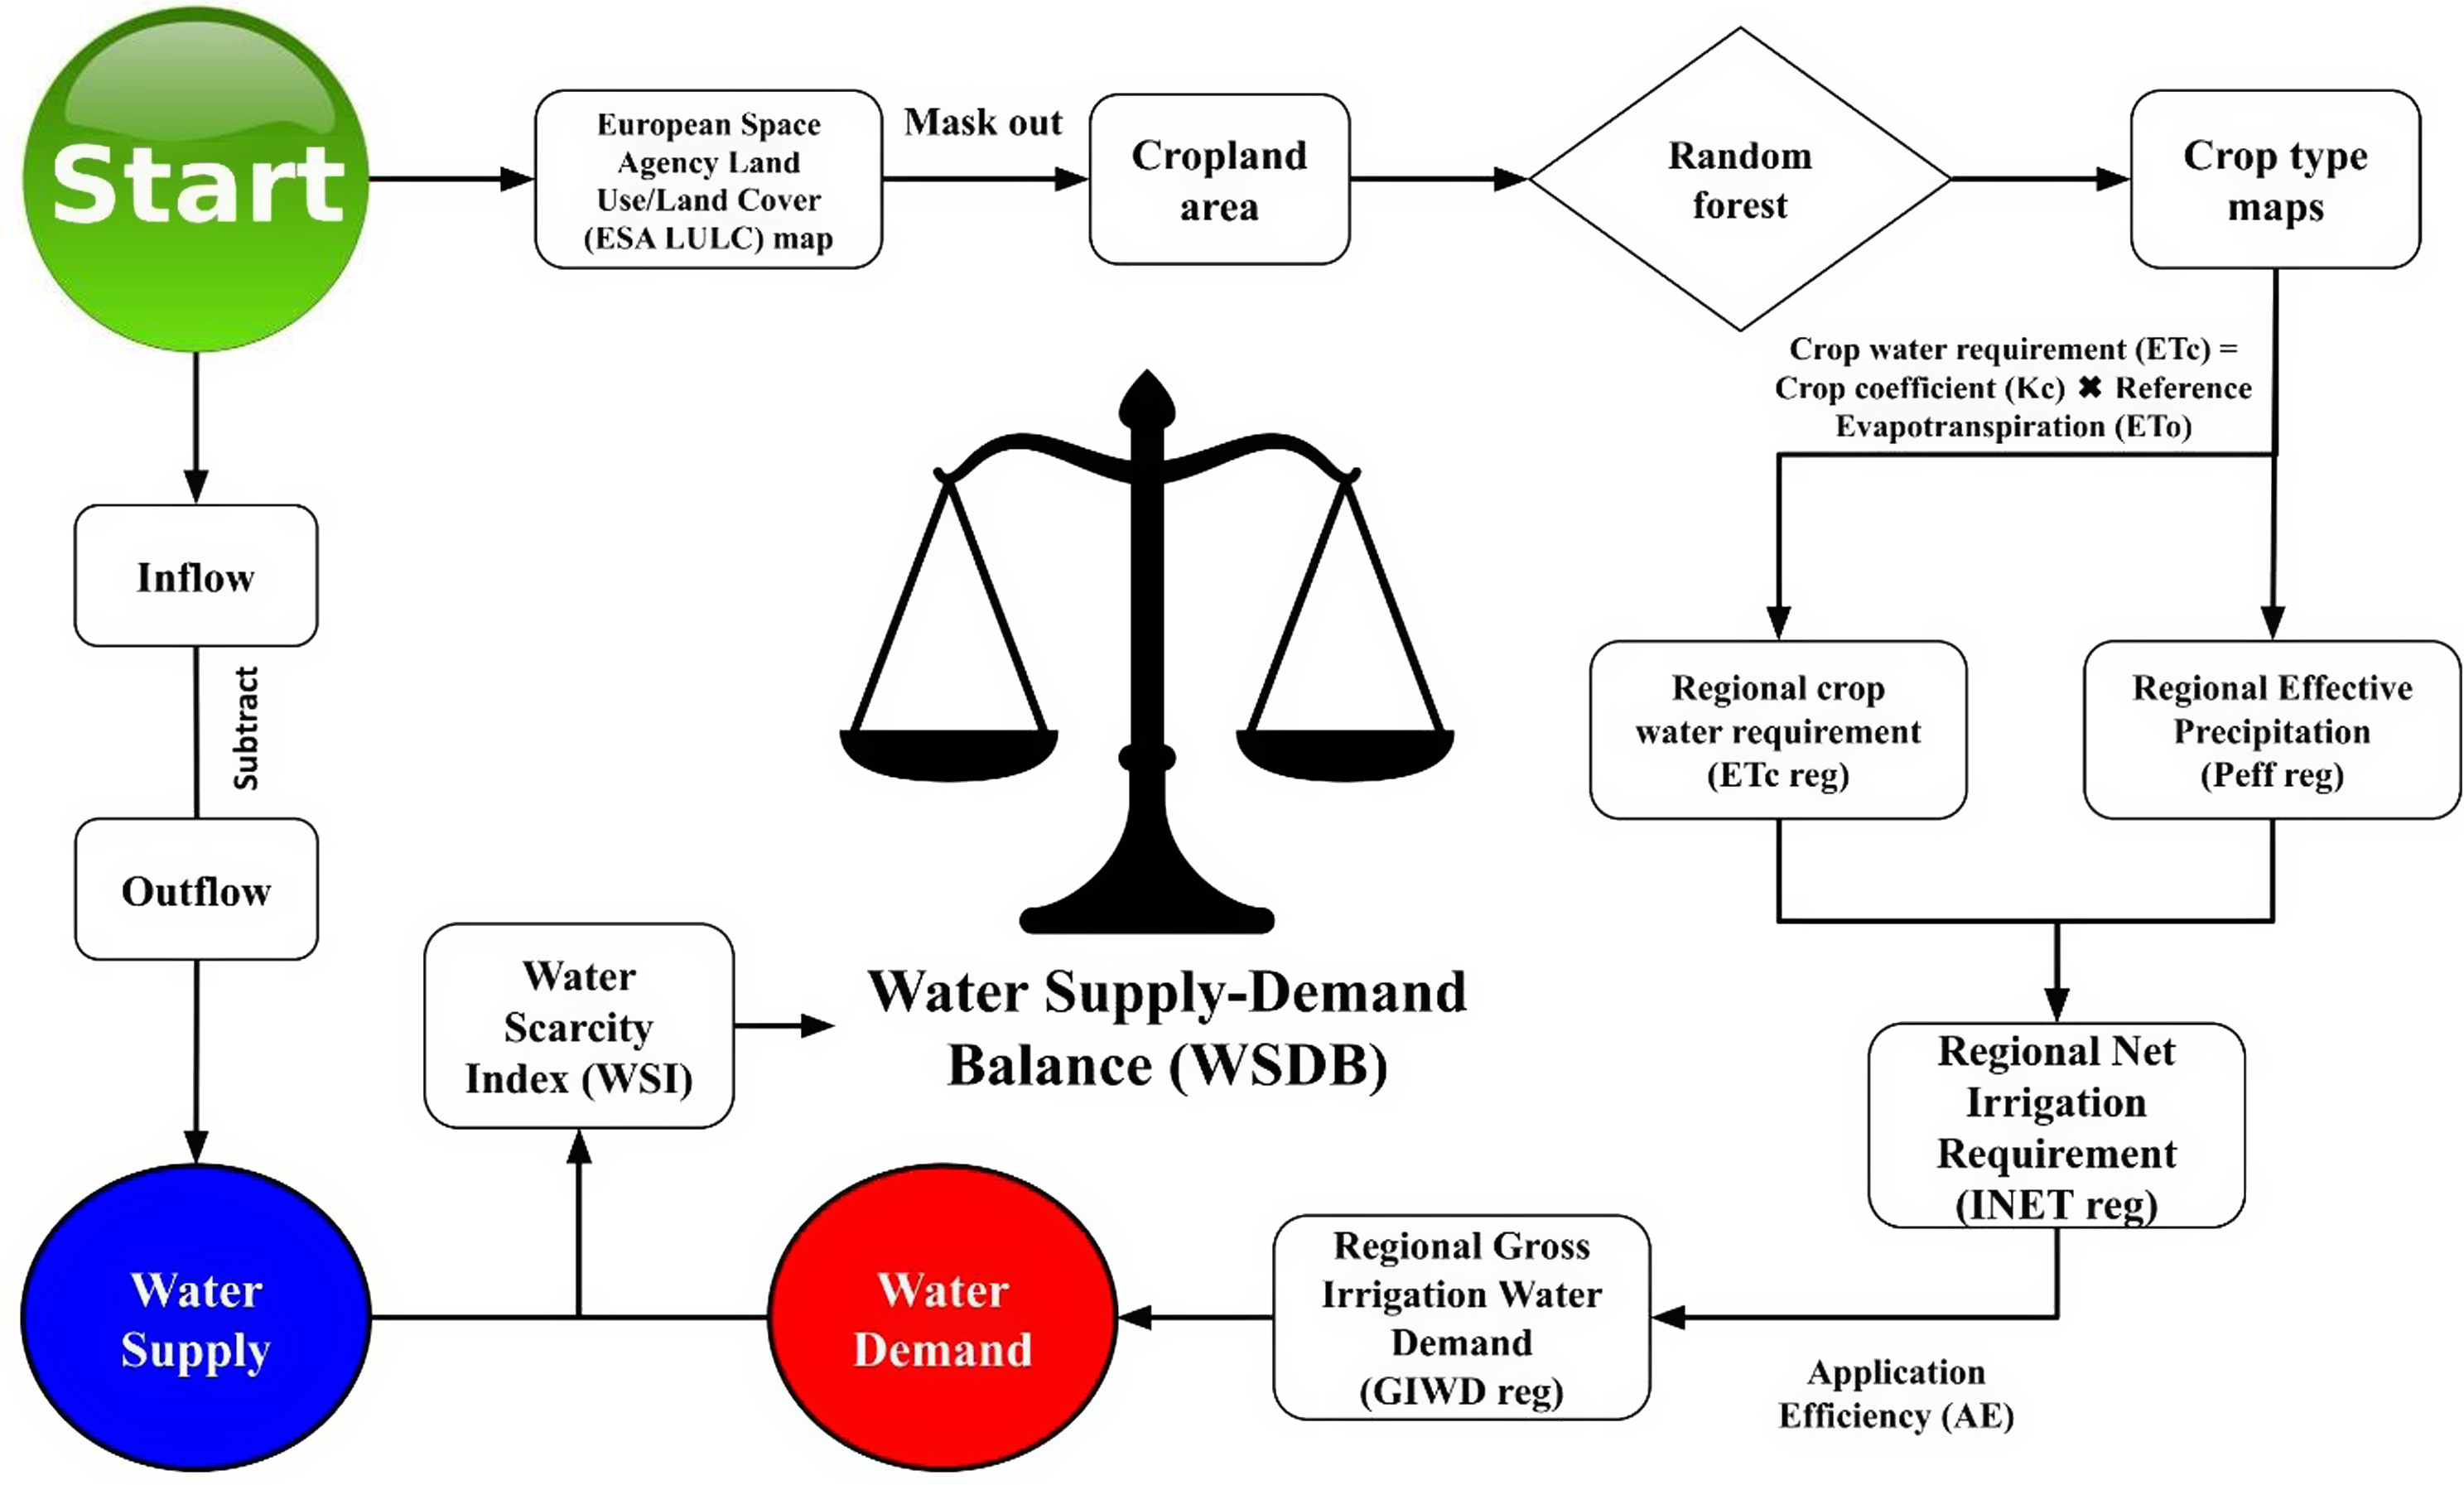
For a better understanding of the methodology, a flowchart illustrating the computation procedure of WSDB is presented in Fig. 2. The flowchart outlines the methodology used for the WSDB analysis, integrating both the supply and demand components of water resources. The process begins with ESA LULC data, where cropland areas are identified, followed by crop-type mapping using a RF algorithm and the computation of regional crop water requirement (ETcreg) and effective precipitation (Peffreg). These outputs contribute to calculating the regional net irrigation requirement (INETreg) and the gross irrigation water demand (GIWDreg). On the supply side, inflow and outflow data are utilized to evaluate water availability. Finally, the WSDB is analyzed through the Water Scarcity Index (WSI) to classify water shortage levels.
Flowchart illustrating the computation of water supply-demand balance (WSDB) parameters for the Honam sub-basin.

Results
Climate variability
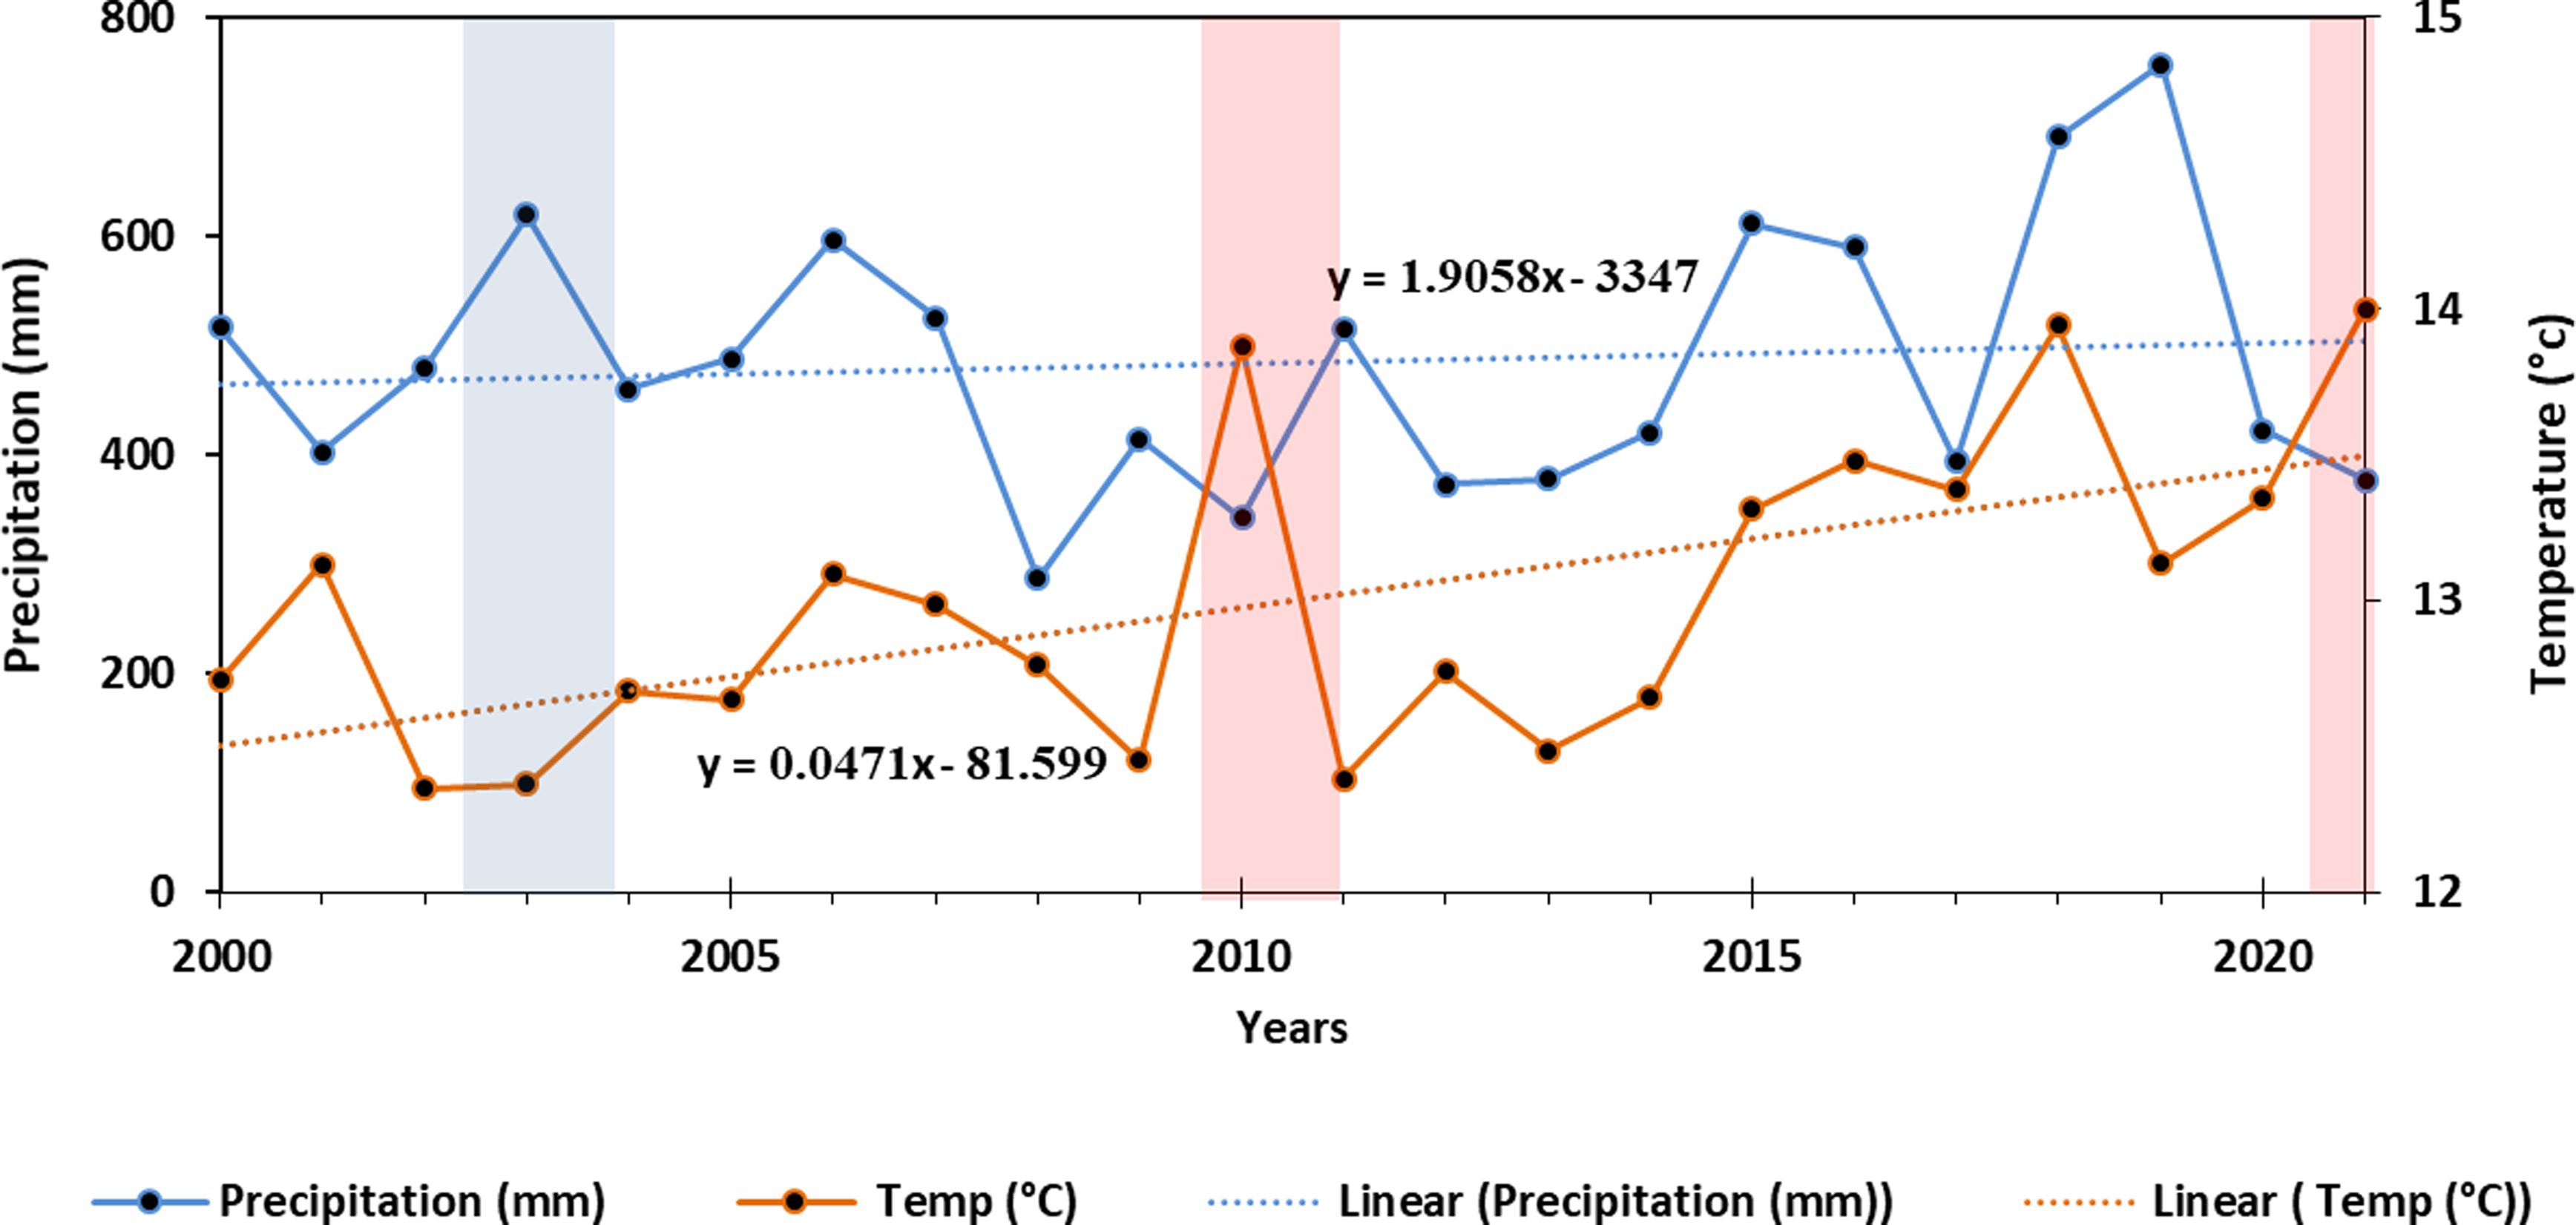
The annual mean temperature during the data period (2000–2021) varied from 12.4°C (in 2002 and 2003) to 14°C (in 2010, 2018 and 2021) (Fig. 3). Annual precipitation values ranged from 287 mm in 2008 to 757 mm in 2019. In summary, 2019 was the most notable wet year, characterized by significant total precipitation and the lowest annual mean temperature. In contrast, 2010 and 2021 were typical dry years, recording low total precipitation levels along with the highest annual mean temperatures, exceeding 13.9°C. The linear trend for temperature shows a gradual increase (0.02°C per decade), suggesting a warming trend, while annual precipitation indicates a modest overall increase of 0.95 mm per decade.
Average annual temperature and total annual precipitation trends of Alashtar meteorological station during 2000–2021. The red and blue columns indicate dry and wet years, respectively.

ETo estimation
The reference evapotranspiration values were calculated daily and then aggregated to a monthly time scale. The monthly results followed a normal curve, with a maximum value of 212 mm in July and minimum values of 35.4 mm occurring in late autumn and early winter, specifically in December and January (Fig. 4). Furthermore, the average seasonal cumulative ETo values were 58 mm in winter, 150 mm in spring, 185 mm in summer and 62.6 mm in autumn.
Average monthly reference evapotranspiration, ETo, in Honam sub-basin over 2000–2021. The box-plot represents the four-number summary of a set of data: the minimum score (Q0), first quartile (Q1), third quartile (Q3) and the maximum score (Q4). The median value is displayed with a blue line inside the “box”. The maximum and minimum values are displayed with vertical lines connecting the points to the box.

Vegetation cover of irrigated lands
Results from farming system classification maps for 2019–2021 indicated that the produced maps were highly accurate (OA = 0.91–0.96 and KA = 0.83–0.91), with no significant differences in farming patterns during the studied period. In total, nearly 1,100 ha out of 3,411 ha of cropland were identified and classified as irrigated land. Most of the irrigated land was found at lower altitudes near the Honam River (Fig. 1).
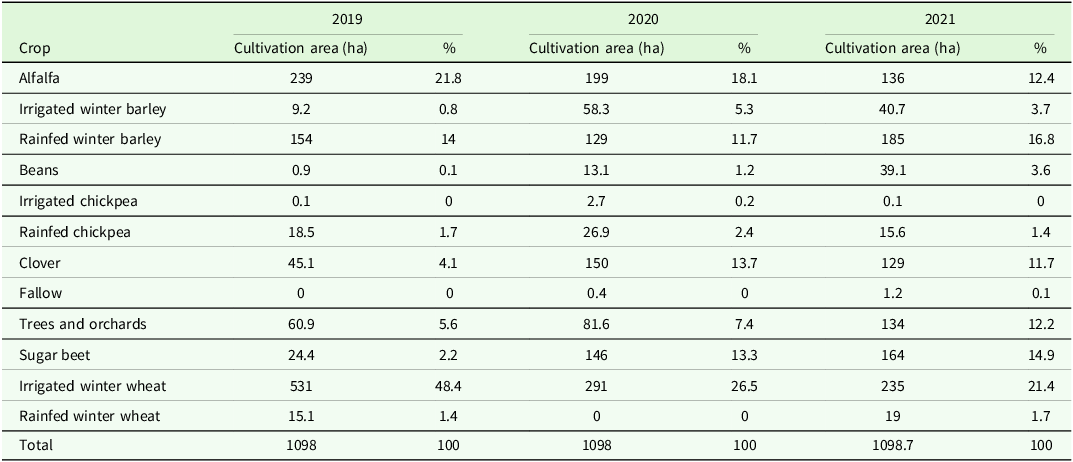
RF effectively detected crop-type classes and the geographical cropping patterns of irrigated farming during the 2019–2021 period while removing outcrop areas through visual interpretation (Fig. 5). Table 5 summarizes the area covered by different crop types across the study area, as extracted from crop-type maps for three consecutive years. ML showed great potential for object-based farm boundary delineation due to the high spatial resolution of RS data. Generally, irrigated crops, in specific the four classes of winter barley, clover, sugar beet and orchards/trees, achieved better results, with average PA values of 0.77, 0.78, 0.83 and 0.82, and average UA values of 0.85, 0.90, 0.91 and 0.75, respectively. The lowest estimation was obtained for beans, as the number of fields for this specific crop was limited compared to other crops. Additionally, perennial plants, such as orchards/trees, did not experience any changes in the three-year crop-type map survey.
The final crop-type map in irrigated lands of Honam sub-catchment, generated using Landsat-8 and the Random Forest (RF) algorithm on the Google Earth Engine (GEE) platform.

Cultivation area of different crop-type classes (irrigated and rainfed) over the study area extracted from crop-type map of 2019–2021

ETc, Peff and INET estimations
Crop water requirements were calculated for the major irrigated crops. The mean annual ETc for alfalfa and sugar beet were 1,024 and 885 mm, respectively, representing the highest evapotranspiration rates among the irrigated crops during the growing season in the sub-basin (Fig. 6). In contrast, the ETc of beans was the lowest value (average=577 mm), which was comparable to winter wheat during the studied period. The relatively low ETc for beans can be explained by its shorter growing period (110 days) and lower end-season Kc compared to other crops (see Table 3).
Comparison of crop water requirement (ETc), effective precipitation (Peff) and net irrigation requirement (INET) of main crops of Honam sub-basin during 2019–2021.

Calculated Peff during the specified growing season revealed significant variation among crops, mainly due to differences in the number of growing days. Peff values during the growing season were higher for winter wheat than for other crops because precipitation predominantly occurs in the autumn and winter seasons. Actually, winter wheat benefits from this seasonal alignment, as precipitation helps meet part of its irrigation requirements.
INET ranged from 339 to 1,008 mm, with forages showing the highest values among the major crops (Fig. 6). Winter barley exhibited the lowest INET due to its growing season’s alignment with seasonal precipitation, similar to winter wheat. Beans generally had higher INET values compared to winter wheat, except in 2021, despite winter wheat having a doubled growth duration (see Table 3). Additionally, the Peff of beans was notably lower than that of winter wheat. In summary, the highest estimated ETc and INET values for most crops were observed in the dry year of 2021 (Fig. 3), while the lowest values were recorded in 2020. This highlights the impact of climatic conditions on crop water demand. The moderately high INET value for sugar beet is likely associated with its medium to long growth duration and low Peff during the growing season.
Estimation of ETcreg, INEreg and GIWDreg
Figure 7 presents the results for ETcreg, INETreg, and GIWDreg in the sub-basin. The results indicate that the estimated ETcreg and GIWDreg followed similar trends across different years, primarily due to the same area employed in the calculations. However, the INETreg showed notable variations, which were attributed to differences in Peffreg. The highest GIWDreg was estimated at 11.3 MCM in 2020, driven by high ETc values and the extensive cultivation of forages (Table 5 and Fig. 5).
Variations of regional crop water requirement (ETcreg), net irrigation requirement (INETreg) and regional gross irrigation water demand (GIWDreg) of Honam sub-basin during 2019–2021.

Variations in Surface Irrigation Water Supply (SIWS) and inflow-outflow dynamics
The Honam River, primarily supplied by the Sarab-e Honam spring, is the main water source for the Honam sub-basin. The results indicated that the inflow rate (Fig. 8a) was significantly higher than the outflow rate (Fig. 8b) in most of the years studied. The SIWS for irrigated land use directly depends on the inflow rate. Long-term analysis revealed that SIWS in the study area ranged from 6 MCM to 20.9 MCM. The highest allocated SIWS values were observed between 2003 and 2007, while the lowest value occurred in 2021, a notable dry year (Fig. 3).
Variations in (a) annual inflow and (b) annual outflow of surface irrigation water supply (SIWS). The dotted lines represent the average value.

Water balance between SIWS and GIWD in the sub-basin
On the supply side, the average available water resources of the sub-basin were estimated at 11.9 and 11.4 MCM based on long-term (2000–2021) and short-term (2019–2021) measured data, respectively (Figs. 8 and 9). It is assumed that the above-mentioned amounts equal the water supplied to irrigated lands in the sub-basin. On the demand side, the average GIWDreg for various cropping patterns during 2019–2021 ranged from 9 to 11.3 MCM (Fig. 9), assuming an irrigation efficiency of 40.1%. It is also assumed that the amount of irrigation water used by farmers equals the water demand, since settlement and industry shares are minimal in the region. The average annual water consumption for agriculture was estimated at 10.3 MCM during 2019–2021. Meanwhile, the percentage of GIWDreg in SIWS (red line in Fig. 9) showed an increasing trend, indicating that a significant amount of water allocated to the agriculture sector of the sub-basin was consumed by crops or evaporated from the soil surface. In the dry year of 2021, water supply sharply decreased to 7 MCM, resulting in the percentage of GIWDreg in SIWS increasing to 150%.
The effect of cropping pattern on the agricultural water supply-demand balance in the study area during 2019–2021.

Water scarcity indices
The values of the WSI were 0.73, 0.76 and 1.5 in 2019, 2020 and 2021, respectively. These values indicate that the region experienced severe water scarcity (0.4 < WSI < 1) in 2019–2020 and extreme water shortage (WSI > 1) in 2021, based on the classification presented in Table 4. Additionally, the results of the agricultural water scarcity index (WSIag) confirmed agricultural water scarcity in 2021, with a WSIag value of 0.6.
Discussion
The current study demonstrated the capability of GEE to efficiently process satellite imagery and classify reliable LULC, farming systems and crop-type maps. Although irrigated winter wheat and alfalfa together covered a total of 70.2% of the irrigated land in 2019, their cultivation decreased significantly in subsequent years, falling to 44.6% for winter wheat and 33.8% for alfalfa in 2020 and 2021, respectively (Table 5). Specifically, alfalfa’s cultivation area decreased from 239 ha (21.8% of total land) in 2019 to 136 ha (12.4%) in 2021, while irrigated winter wheat dropped from 531 ha (48.4%) to 235 ha (21.4%) over the same period. The projected cropping pattern, investigated by Elsgaard et al. Reference Elsgaard, Børgesen, Olesen, Siebert, Ewert, Peltonen-Sainio, Rötter and Skjelvåg(2012) also showed a possible general decreasing trend for cereals around the period of 2040. In contrast, the cultivation of sugar beet and clover significantly increased across the studied area, mainly due to contract farming and rising animal feed prices. Farmers attributed these changes to the lower productivity of wheat and alfalfa compared to other crops. While this reduction might suggest a decrease in overall water consumption, the concurrent significant increases in sugar beet and clover cultivation – both water-intensive crops – could have mitigated or even reversed such water savings. Sugar beet cultivation expanded significantly, increasing from 24.4 ha (2.2%) in 2019 to 164 ha (14.9%) in 2021, representing an increase of 140 ha. Similarly, clover cultivation grew from 45.1 ha (4.1%) in 2019 to 129 ha (11.7%) in 2021, reflecting an increase of 83.6 ha. These shifts may also result from variable climatic conditions, market volatility and reduced profitability due to inefficient irrigation practices (Schieder, Reference Schieder2011; Lehecka and Lehecka, Reference Lehecka and Lehecka2014; Sun et al., Reference Sun, Wu, Wang and Zhao2015; Dutta et al., Reference Dutta, Laing, Kumar, Gathala, Singh, Gaydon and Poulton2020; Alsenjar et al., Reference Alsenjar, Cetin, Aksu, Akgul and Golpinar2022; Cetin et al., Reference Cetin, Alsenjar, Aksu, Golpinar and Akgul2023b).
Confusions in crop-type mapping of cereal crops (Supplementary Table S1) was possibly attributed to different distribution patterns of sampling points, similar phenological phases or coverage characteristics and spectral profile similarities among the targets (Becker et al., Reference Becker, Ló, Johann and Mercante2021b; Alsenjar et al., Reference Alsenjar, Cetin, Aksu, Akgul and Golpinar2022). Cetin et al. (Reference Cetin, Alsenjar, Aksu, Golpinar and Akgul2023a) identified the confusion among wheat fields, citrus and bare soil as being due to intensive weed growth and the presence of very young citrus saplings, which shared similar land features with bare soil during winter, as well as wheat plants at various developmental stages in the eastern Mediterranean region of Turkey.
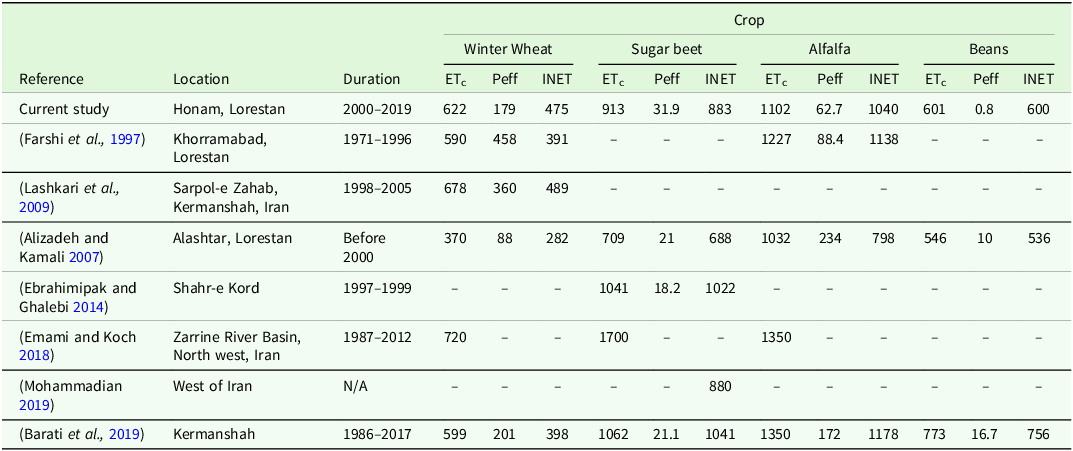
Alfalfa, as a deep-rooted perennial forage crop with multiple harvests per year, and sugar beet, with its large leaf area, both exhibited high evapotranspiration rates (Fig. 6). The estimated ETc values for alfalfa and beans in the current study were consistent with those reported in previous studies using direct evapotranspiration methods conducted near the region (Table 6). In addition to ETc, significant variations have been observed in effective precipitation (Peff) across different crops, with winter wheat benefiting from the alignment of its growing season with the autumn and winter precipitation period. The estimated Peff during the growing season for alfalfa, winter wheat and beans in the current study was lower than those reported in previous studies (Table 6). Conversely, spring crops exhibited lower Peff values, as they are more likely to experience months with insufficient precipitation, indicating a higher need for supplementary irrigation (Ghafouri et al., Reference Ghafouri, Siadat and Oweis2012; Khaydar et al., Reference Khaydar, Chen, Huang, Ilkhom, Liu, Friday, Farkhod, Khusen and Gulkaiyr2021). However, the Peff for sugar beet was higher in comparison with others, likely due to incompatible methods used, differences in planting and harvesting dates, and the use of a minimum daily precipitation threshold of 5 mm/day (Dastane, Reference Dastane1974). In addition, uncertainties inherent in meteorological data during collection, exploration and processing cannot be ignored. A nationwide research on effective precipitation for winter wheat reported higher Peff values than those observed in this study (Rahimi et al., Reference Rahimi, Khalili and Bazrafshan2014). This difference can be attributed to variations in climatic conditions, study periods and methodologies used to estimate Peff.
Crop water requirement (ETc), effective precipitation (Peff) and net irrigation requirement (INET) values for main crops of the study area collected from literature

The highest and lowest INET values were observed for forages and winter barley, respectively. Several studies have been carried out to estimate INET for crops and orchards at regional and nationwide scales in Iran (Farshi et al., Reference Farshi, Shariati, JaroLlahi, Ghaemi, Shahabifar and Tavallaei1997; Alizadeh and Kamali, Reference Alizadeh and Kamali2007). For example, the results for winter wheat in this study differed by 32.5 mm and 22.6 mm from the findings of Farshi et al (Reference Farshi, Shariati, JaroLlahi, Ghaemi, Shahabifar and Tavallaei1997) and Barati et al (Reference Barati, Abedi Koupaie, Darvishi, Azari and Yousefi2019), respectively (Table 6). These variations can be explained by the impacts of climate change on growth stage duration (Ahmadi et al., Reference Ahmadi, Rostami and Dadashi-roudbari2020; Yoosefdoost et al., Reference Yoosefdoost, Basirifard, Álvarez-García and del Río-Rama2022).
Implications for water resource management
Outflow rates exceeded inflow rates in 2006, whereas the opposite trend was observed during 2000–2003 and 2017–2018. This could be related to the impacts of climate change (Schewe et al., Reference Schewe, Heinke, Gerten, Haddeland, Arnell, Clark, Dankers, Eisner, Fekete, Colón-González, Gosling, Kim, Liu, Masaki, Portmann, Satoh, Stacke, Tang, Wada, Wisser, Albrecht, Frieler, Piontek, Warszawski and Kabat2014; Yoosefdoost et al., Reference Yoosefdoost, Basirifard, Álvarez-García and del Río-Rama2022) or the expansion of the cultivation areas for high-water-demand crops in recent years (Fig. 5). Similarly, Yousefi and Moridi (Reference Yousefi and Moridi2022) reported significant changes in inflow patterns in the semi-arid Minab Reservoir upstream watershed in Iran. Under climate change scenarios such as RCP4.5 and RCP8.5, their findings indicated a decline in average monthly inflow and reduced winter precipitation, which accounts for 66% of annual precipitation. These findings underscore the substantial impact of climate change on water resource dynamics. Furthermore, the average supplied water resources in the sub-basin exhibited notable variations, ranging from 7 to 14.8 MCM during the short-term period of 2019–2021.
The Water Supply-Demand Balance (WSDB) changed significantly across the study years. Positive WSDB values in 2019 (3.3 MCM) and 2020 (3.5 MCM) indicated that water supply exceeded demand during these years (Fig. 9). This surplus water might support downstream areas by maintaining ecological flows, benefiting ecosystems and advancing water management goals. In contrast, a negative WSDB (–3.5 MCM/year) was observed for the dry year of 2021, which according to Tabari et al. (Reference Tabari, Eilbeigi and Chitsazan2022), might have led to water conflicts and excessive groundwater withdrawal from illegal wells.
The WSI results confirmed that the sub-basin predominantly experienced water shortages throughout the study period. These imbalances were driven by reduced supply due to drought and climate change effects (Magidi et al., Reference Magidi, Nhamo, Mpandeli and Mabhaudhi2021), coupled with anthropogenic activities like inefficient irrigation practices and cultivating water-intensive crops, such as forages and sugar beet during dry periods (Cetin et al., Reference Cetin, Alsenjar, Aksu, Golpinar and Akgul2023b). High-water-demand crops, like forages, are significant consumers of irrigation water over 2019–2021 (see Figs. 6 and 9), substantially contributing to water scarcity. KhazaiPoul et al. (Reference KhazaiPoul, Moridi and Yazdi2019) report that alfalfa and sugar beet in the Mahabad watershed, south of Lake Urmia, Iran, have high annual water demands (53 MCM and 25 MCM, respectively) but low irrigation reliability during the dry period. Such low-reliability levels reflect the challenges of meeting their irrigation needs, particularly during dry periods when water availability is critically constrained. Zarepour Moshizi et al. (Reference Zarepour Moshizi, Yousefi, Amini and Shojaei2022) also pointed out that cultivating water-intensive crops in water-scarce areas exacerbates regional water imbalances.
Fluctuations in WSDB highlight that the Honam sub-basin is generally in an unbalanced state. Negative WSDB values threaten farmers’ livelihoods (Ahmad and Giordano, Reference Ahmad and Giordano2010) and the vulnerable environment of the lower KRB (Ghafouri et al., Reference Ghafouri, Siadat and Oweis2012; Nikoo et al., Reference Nikoo, Karimi, Kerachian and Gavahi2019; Yoosefdoost et al., Reference Yoosefdoost, Basirifard, Álvarez-García and del Río-Rama2022). Cetin et al. (Reference Cetin, Alsenjar, Aksu, Golpinar and Akgul2023b) associated imbalances in the WSDB with closure errors in large-scale irrigation catchments. Similar vulnerabilities have been observed in other regions, such as the Amu Darya River Basin, where imbalances stem from declining water inflows and increasing demand (Wang et al., Reference Wang, Huang, Liu, Zan, Ling and Guo2022). Addressing these imbalances requires innovative solutions tailored to both wet and dry years.
Nikoo et al. (Reference Nikoo, Karimi, Kerachian and Gavahi2019) projected that downstream SIWS in the KRB would decline by 3% annually if current water-use practices persist. Similarly, Akbari et al. (Reference Akbari, Shourian and Moridi2022) highlighted that adopting optimized cropping patterns in the Eshtehard watershed of Iran alleviated groundwater stress and enhanced agricultural sustainability under climate change. Furthermore, Hatamkhani and Moridi (Reference Hatamkhani and Moridi2021) emphasized that increasing the area under cultivation in the KRB may temporarily boost agricultural GDP but often comes at the expense of long-term sustainability. Their results showed that neglecting supply reliability, particularly during drought years, leads to unsustainable practices, such as intensified water scarcity, social inequality and reduced agricultural GDP. These findings underscore the need for comprehensive water management strategies in the study area that prioritize both supply reliability and sustainability to ensure resilience under future climate conditions.
Adaptation strategies and recommendations
To address the challenges of water scarcity and climate change, adaptation strategies should focus on adjusting cropping patterns, improving irrigation practices and enhancing inter-basin water cooperation.
Current irrigation strategies in the region lack the flexibility needed to address WSDB issues exacerbated by climate change. Tackling climate change is a major challenge in reducing the WSDB imbalance, particularly in semi-arid regions like the Honam sub-basin. The potential benefits of crop adjustments are evident in the findings of KhazaiPoul et al. (Reference KhazaiPoul, Moridi and Yazdi2019). By eliminating alfalfa and sugar beet, agricultural income was reduced by just 6.5%, while lowering WSI from 80 to 60% and releasing 180 MCM of additional water to flow into Lake Urmia during a five-year drought. Sun et al. (Reference Sun, Wu, Wang and Zhao2015) also found that modifying cropping patterns significantly improved regional water productivity in western Inner Mongolia, China. Conversely, failure to implement such adjustments can lead to rapid environmental consequences, as reported by other researchers (Amanat, Reference Amanat2016; Yin et al., Reference Yin, Wu, Song, Yang, Zhu and Wu2022; Zarepour Moshizi et al., Reference Zarepour Moshizi, Yousefi, Amini and Shojaei2022). Consequently, to address water scarcity and ensure sustainable resource management, cropping patterns in the region must adapt by: a) replacing water-intensive crops, such as alfalfa and sugar beet, with water-efficient winter crops like winter wheat and barley (Conrad et al., Reference Conrad, Lamers, Ibragimov, Löw and Martius2016; Akbari et al., Reference Akbari, Shourian and Moridi2022) or higher value crop varieties (Schieder, Reference Schieder2011; Zarepour Moshizi et al., Reference Zarepour Moshizi, Yousefi, Amini and Shojaei2022); b) prioritizing crops that enhance national food security (e.g., wheat and barley); and c) shifting cultivation dates to earlier periods, as climate change analysis by Yousefi and Moridi (Reference Yousefi and Moridi2022) suggests that precipitation patterns may shift to early fall or late spring in southern Iran.
The widely used flood irrigation in traditional irrigation networks is highly inefficient. Thus, transitioning to water-saving technologies like pressurized irrigation systems and canal rotation plans (Yousaf et al., Reference Yousaf, Awan, Kamran, Ahmad, Bodla, Riaz, Umar and Chohan2021) could improve water-use efficiency. Beyond improving the efficiency of irrigation systems, some adaptive strategies such as optimal irrigation planning based on actual evapotranspiration (ETa) and the implementation of water pricing mechanisms can further incentivize water conservation (Boithias et al., Reference Boithias, Acuña, Vergoñós, Ziv, Marcé and Sabater2014; Yin et al., Reference Yin, Wu, Song, Yang, Zhu and Wu2022; Cetin et al., Reference Cetin, Alsenjar, Aksu, Golpinar and Akgul2023b). For instance, Gong et al. (Reference Gong, Zhang, Ren, Sun and Yang2020) demonstrated a 47.4% reduction in water consumption under maize cultivation using economic benefit-focused irrigation planning in the Jinghuiqu irrigation district of China. Likewise, Akbari et al. (Reference Akbari, Shourian and Moridi2022) reported that optimizing irrigation in a semi-arid watershed in Iran reduced water use by 45% for winter wheat, with only a 14% decrease in crop yield due to high spring water demand. Irrigation for winter barley decreased by 7% without any yield loss, suggesting that current irrigation practices exceed the plant’s water requirements. Furthermore, cotton irrigation optimization reduced water use by 10% while increasing crop yield by 7.5%, illustrating the detrimental impact of over-irrigation on root development and crop yield. These results underscore the potential benefits of precise water management strategies in improving agricultural sustainability. However, from an environmental perspective, this reduction in irrigation has led to decreased agricultural infiltration, which in turn has reduced groundwater recharge in the optimized state compared to the current situation in the watershed.
Integrated approaches that balance economic benefits, ecological demands, and social equity are essential for tackling the water supply-demand imbalance in the region. Cooperative water management strategies, as recommended by Zhang et al (Reference Zhang, Zhang, Xi, Liu, Li, Hou and Chen2022), could effectively address water and energy stress across the KRB. Their study showed that the net energy and water inflow can increase by 33.5 and 42.1%, respectively, in high-stress regions of China. Adjusting cropping patterns, particularly by encouraging the cultivation of water-efficient crops like winter wheat and winter barley rather than forage crops and sugar beet, can significantly reduce agricultural water demand while improving food security. Government support, in the form of subsidies and incentives to encourage water-saving crops and practices, is especially crucial in regions heavily reliant on livestock production and sugar beet farming. Additionally, transitioning from traditional flood irrigation systems to modern, water-saving technologies, such as pressurized irrigation systems and optimized irrigation scheduling, can greatly improve water-use efficiency. Policymakers should also consider implementing incentive-based approaches and leveraging advanced tools, such as real-time monitoring and ETa-based irrigation planning, to promote efficient water use. The proposed methodology can guide decision-making in similar mountainous, water-scarce regions with traditional irrigation networks by enabling the development of well-balanced irrigation management zones. Meanwhile, developing a spatial, online platform with intelligent algorithms tailored to local contexts could enable near-real-time water resource management and improve decision-making at the basin level.
Further research is needed to assess the long-term impacts of climate change on irrigation requirements and cropping patterns. Future studies should also explore ecological water demands, the socioeconomic impacts of water scarcity especially on smallholder farmers and the practical feasibility of implementing modern irrigation technologies in the region. Expanding this analysis to other sub-basins within the KRB will provide a more comprehensive understanding of water resource management challenges across the entire basin and guide the implementation of equitable and sustainable solutions.
Conclusions
This study evaluates the Water Supply-Demand Balance (WSDB) and the effect of crop patterns on WSDB in a traditional irrigation network in the Honam sub-basin, Iran. The findings highlight that the Random Forest (RF) model effectively identified crop-type classes and cropping patterns of irrigated farming, facilitating water demand estimations at the sub-basin level. The WSDB fluctuated significantly across the study years, with persistent water shortages even in the short term. This scarcity has led to critical water resource challenges, exacerbated by climate variability and anthropogenic factors such as cultivating water-intensive crops. These vulnerabilities underscore the urgent need for tailored adaptation strategies to address water imbalances and enhance agricultural sustainability in the region. The proposed approach offers valuable insights to support decision-makers in agricultural water resources management.
Supplementary material
The supplementary material for this article can be found at https://doi.org/10.1017/S0021859625000206
Acknowledgements
The authors sincerely thank Dr. Shadman Veisi (Soil and Water Research Institute, Karaj, Iran) for providing GEE codes for crop-type mapping. We are also grateful to the support staff of the Soil Physics and Irrigation Department of SWRI for their assistance with data analysis. Additionally, we acknowledge Ms. Mahnaz Sepahvand and Ms. Masoumeh Matinkia, the local experts at Aliabad Agricultural Center and Dr. Samad Abdi for their contribution to data collection.
Author contributions
S.M.: Data collection, conceptualization, methodology, software, validation, formal analysis, investigation, resources, data curation, writing—original draft preparation and visualization. M.G.: Conceptualization, methodology, writing—review and editing, visualization and supervision. M.R.B.: Conceptualization, methodology, writing—review and editing, supervision and resources. H.A.: writing—review and editing, methodology and supervision. N.D.: writing—review and editing, methodology, supervision and resources. H.V.: writing—reviewing, editing and supervision. A.M.S.: review and editing. M.C.: review and editing. All authors have read and agreed to the published version of the manuscript.
Funding statement
This research was supported by the Soil Science and Engineering Department, College of Agriculture & Natural Resources, University of Tehran, and the Soil and Water Research Institute (SWRI).
Competing interests
The authors declare there are no conflicts of interest.
Ethical standards
Not applicable.