Introduction
The study of civil conflict resolution is rife with weak peace agreements that were unable to bring closure to their respective conflicts. The Arusha Accords, signed in 1993 to end a three-year Rwandan Civil War, infamously failed to prevent the recurrence of conflict in Rwanda the following year. The Nairobi Agreement was supposed to end the Ugandan Civil War in 1985 but was never even implemented. The Lomé Peace Accord promised to end the Sierra Leone Civil War in 1999, but fighting continued until 2002. Almost every agreement signed by Afghanistan in the past three decades has been broken by one or more parties. Scholars and public officials deride these agreements and countless others as weak while praising long-lasting agreements such as the Good Friday Agreement as strong documents.
Yet, how much of the perception of civil peace agreements as weak or strong results from their observed duration? How could an agreement such as the Arusha Accords that was brokered as part of an extensive mediation process involving many third parties be so weak? Without being able to observe the counterfactual where Rwandan President Juvénal Habyarimana's plane was never shot down, we can know how much of the Accords' failure was due to his death rather than some inherent weakness in the agreement. This uncertainty suggests a need to measure the strength of an agreement separately from its duration.
There are several ways to measure the strength of a peace agreement, but each has its strengths and weaknesses. Given that even some strong peace agreements fail, the observed duration of an agreement is likely an imperfect indicator of its underlying strength. Specific characteristics of peace agreements give us some information about the strength or weakness of an agreement, but it is difficult to select a single characteristic that captures strength. An additive scale of provisions may be somewhat related to the strength of an agreement, but it weights all provisions equally. Treating all provisions the same is problematic because they likely do not all convey the same amount of information about agreement strength. Ceasefire provisions only result in a (potentially) temporary halt to the fighting, but power-sharing agreements require addressing underlying issues.
Given these issues, we take a new approach by treating agreement strength as a latent variable. Using Bayesian item response theory (IRT), we model the specific provisions within peace agreements as a function of an underlying latent agreement strength. We illustrate our new measurement strategy with an example of how scholars can apply it to substantive research questions by focusing on the question of whether external forces can influence peace agreement strength. The policy implications are clear: if outside actors can insert themselves and improve the strength of peace agreements, the chances of peace may improve. Alternatively, if external actors coerce belligerents to hastily sign agreements, the resulting document may fail to prevent future conflict.
Measuring peace agreement strength
Peace agreements in civil war settings seek to end a conflict between a government and one or more nonstate actors. During negotiations, belligerents attempt to secure the greatest benefits for themselves while mitigating costs. Both parties have strong incentives to reach a settlement that halts the conflict because fighting inflicts great material costs. However, they may disagree about the specifics of an agreement. Negotiations, which may include third-party mediators, attempt to craft an agreement that leads to peace and that both parties will sign. Therefore, the peace process seeks to find a mutually agreeable settlement that produces the highest likelihood of sustained peace.
We define peace agreement strength as the degree to which a negotiated settlement addresses parties' potential grievances by encoding specific provisions. This is similar to the way in which Fortna (Reference Fortna2003) defines agreement strength for international ceasefires. A strong agreement would address each of the potential causes of conflict, while a weak agreement would not. For rebel groups, fundamental grievances could stem from a desire for legal protections, political inclusion, or territorial autonomy. Governments generally seek a cessation of hostilities and disarmament by the rebels. A perfect agreement would address each of these concerns, while the worst possible agreement would solve none of these incompatibilities. Clearly, however, there is a range of possibilities between the best and worst potential agreements. We use the observable provisions within peace agreements to place them along this latent spectrum.
Consider the Arusha Accords signed in the summer of 1993 to end the three-year Rwandan Civil War. The talks were organized by the US, France, and the Organization of African Unity, and the resulting agreement contained several provisions considered important by existing literature on civil peace agreements. The Arusha Accords included provisions concerning the rule of law, repatriation of refugees, and the integration of rebels into the national army. The Rwandan Patriotic Front (RPF) was granted participation in the legislature and was given an equal number of cabinet posts as the former ruling party. While the agreement laid the groundwork for peace in Rwanda, it ultimately failed to prevent conflict recurrence, due in large part to the assassination of Rwandan President Juvénal Habyarimana. The eventual failure of the Arusha Accords shows that even agreements that are carefully crafted by well-resourced stakeholders can fail. The disconnect between the amount of effort that went into reaching the Arusha Accords and their quick failure suggests that we cannot judge the strength of a peace agreement solely by observing its duration.
To assess the quality of peace agreements, researchers have largely conducted statistical analyses with the duration of the agreement as the outcome variable. While duration is certainly an outcome of interest for scholars, there is no one-to-one mapping of agreement strength to duration. The durability of any given peace agreement depends upon factors beyond the scope of the agreement itself. Fluctuation in the global economy might induce conflict regardless of a given settlement's strength, and the death of Habyarimana suggests that idiosyncratic factors can also play a large role in the fate of a given agreement. Agreement strength and duration are certainly correlated, but they are distinct outcomes.
Scholars have taken several alternative approaches to examine the quality of peace agreements. Some have focused on the effect of individual provisions such as power-sharing arrangements, the degree of agreement institutionalization, and the specificity of the actual document on agreement duration (Hartzell et al., Reference Hartzell, Hoddie and Rothchild2001; Hartzell and Hoddie, Reference Hartzell and Hoddie2003; Werner and Yuen, Reference Werner and Yuen2005). While these studies have been foundational for understanding the importance of specific types of provisions, they focus on duration as the outcome of interest and cannot speak directly to the concept of agreement strength. Fortna (Reference Fortna2003) uses both subjective coding and an additive index of provisions to show a positive relationship between agreement strength and durability for international peace settlements. While her approaches represent attempts to systematically analyze agreement strength, each of them suffer from potential biases. The subjective coding of peace agreements may be prone to researcher bias, and additive indices either treat indicators as equally important to the latent construct or suffer from disputes over the subjective weighting of different indicators (Smith and Spaniel, Reference Smith and Spaniel2018). Finally, Badran (Reference Badran2014) measures the strength of civil peace agreements using both an additive index and composite index produced via factor analysis. The composite index is an improvement on other attempts to characterize peace agreement strength but still suffers from weighting issues and fails to preserve the variability in the raw data. Our definition of peace agreement strength is based upon the completeness of the agreements themselves and is not necessarily related to an agreement's expected or actual duration.
Agreement strength as a latent variable
We introduce a new measurement strategy to push forward the study and measurement of peace agreement strength by turning to IRT, a method developed by the psychometrics literature. IRT models produce estimates of an underlying attribute, such as academic ability or quality of life, as represented by a series of observable indicators, such as questions on an exam or responses on a survey of health outcomes (Rasch, Reference Rasch1980). In the study of international relations and conflict, they have been used to measure states' nuclear capabilities (Smith and Spaniel, Reference Smith and Spaniel2018), regime type (Treier and Jackman, Reference Treier and Jackman2008), human rights practices (Schnakenberg and Fariss, Reference Schnakenberg and Fariss2014), the depth of preferential trade agreements (Dür et al., Reference Dür, Baccini and Elsig2014), and the scope of military alliance commitments (Benson and Clinton, Reference Benson and Clinton2016). Scholars have used measurement models to improve theoretical accuracy, inference, and prediction (Bakker et al., Reference Bakker, Hill and Moore2016; Carroll and Kenkel, Reference Carroll and KenkelForthcoming; Fariss, Reference Fariss2014; Gray and Slapin, Reference Gray and Slapin2012; Pemstein et al., Reference Pemstein, Meserve and Melton2010).
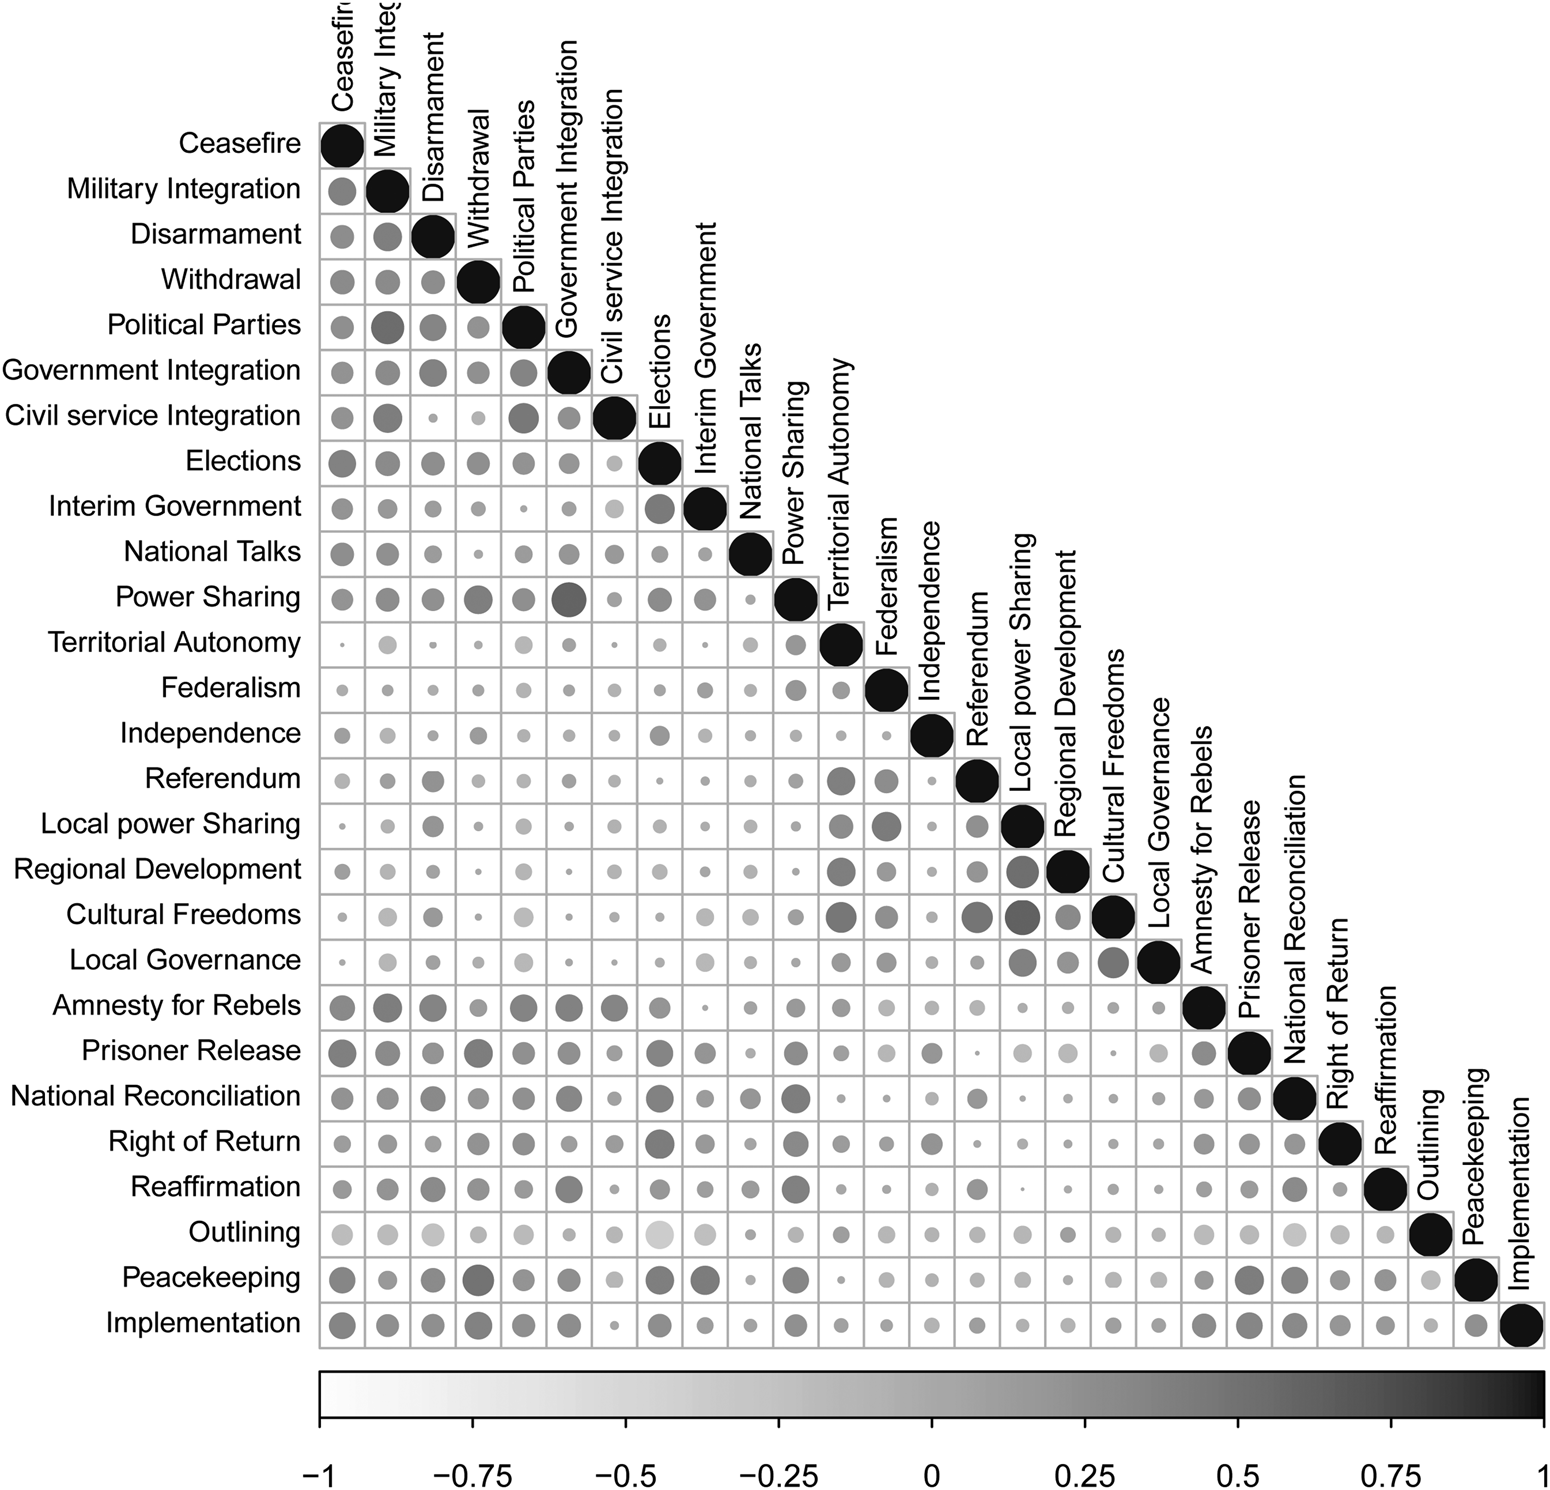
For our measurement strategy, we employ the UCDP Peace Agreement Dataset (Harbom et al., Reference Harbom, Högbladh and Wallensteen2006), which contains data on 27 different provisions for peace agreements in civil conflicts from 1975 to 2005. Figure 1 shows the correlation between each of the provisions in the dataset.
Correlation of all agreement provisions in the UCDP Peace Agreement Dataset Harbom et al., (Reference Harbom, Högbladh and Wallensteen2006) for all agreements in our sample. Strength of correlation is represented by circle size and shade.

The simplest approach to measuring peace agreement strength is to add up the number of provisions present in a given agreement. However, this would be problematic as Figure 1 indicates that there is surprisingly little bivariate correlation between these provisions, with no two provisions having a correlation >±0.62. This pattern suggests that not all provisions are related to the same aspect of peace agreements. No agreement has more than 18 out of 27 provisions, so adding all provisions together may result in biased measurements due to combining different concepts. Additionally, an additive index may mischaracterize the strength of an agreement by treating all provisions as equally meaningful.
Therefore, we treat peace agreement strength as a latent variable that is a function of the provisions an agreement contains. Peace agreements have numerous provisions such as power-sharing arrangements, integration of former combatants into the armed forces, and language recognition that can be viewed as observable indicators of an underlying agreement strength. Although Badran (Reference Badran2014) finds that there are several dimensions to peace agreement strength, the peace agreement duration literature supports our decision to estimate a single latent measure of agreement strength. Based on the argument that ceteris paribus, stronger agreements should last longer (Fortna, Reference Fortna2003), we argue that because these provisions are associated with longer lasting agreements, they can potentially be thought of as indicators for a one-dimensional concept of agreement strength. Our model (which we discuss in more depth below) allows us to identify which indicators are positively related to our latent measure. Although we cannot be certain that our latent variable is capturing the strength of peace agreements, using indicators which are all positively correlated with agreement duration gives us confidence that we are indeed measuring agreement strength.Footnote 1
We suspect that there is some latent underlying strength to peace agreements and that this strength is expressed through the inclusion of these provisions. The stronger an agreement is, the more likely it is to have these provisions, which we refer to as indicators to be consistent with IRT literature. We estimate each indicator's relationship to the underlying dimension, which is the strength of a peace agreement. For each indicator, we also estimate a discrimination parameter that determines how much the presence or absence of an indicator tells us about the agreement's underlying strength. For instance, 62percent of agreements in our sample contain ceasefire provisions, while only 15percent of agreements have provisions for the integration of former rebels into the civil service.Footnote 2 If both indicators are equally correlated with the latent strength of agreements, then the presence of civil service integration in a given agreement tells us more about its strength than the presence of ceasefire provisions does. Unlike the simple additive approach, the IRT model allows different indicators to contribute differentially to the strength of an agreement. Before we present the results of our estimation, we briefly describe our initial application of the peace agreement strength measure: an analysis of how external actors influence peace agreement strength.
Third parties and peace agreement strength
To what extent can third-party actors shape the strength of peace agreements? We explore this question as a first-pass illustration of our measure of agreement strength. We consider four mechanisms by which external influences can affect the strength of a peace agreement. The first two, economic sanctions and threats of foreign aid revocation, can be thought of as indirect mechanisms sometimes used in cases of manipulative mediation or directive mediation (Beardsley et al., Reference Beardsley, Quinn, Biswas and Wilkenfeld2006; Touval and Zartman, Reference Touval, Zartman, Touval and Zartman1985). The second two, mediation and military intervention, are more direct ways for outside parties to become involved in conflict management.
We argue that states subject to economic sanctions are more likely to sign weak agreements. Economic coercion through sanctions shifts the incentives of the government, encouraging them to sign agreements they otherwise would not. An external state may threaten or impose sanctions to encourage the target state to produce a peaceful settlement. Given the punishing costs that sanctions can generate, governments may have an incentive to sign an agreement just to get relief from the sanctions. Consequently, governments may not be focused on signing the “best” peace agreements possible when under economic sanctions. After the US threatened to impose economic sanctions (Anna, Reference Anna2015) and a UN arms embargo (Nichols, Reference Nichols2015) on South Sudan unless they ended their civil war, President Salva Kiir signed a peace treaty despite “serious reservations” (Dumo, Reference Dumo2015). Kiir's concerns illustrate that he was aware of the dangers of the agreement, even going so far as to warn that “a poor agreement could backfire on the region.” Crafting a strong peace agreement is a long and contentious process that involves bringing together all relevant stakeholders and attempting to reach a compromise that satisfies many different parties (Fortna, Reference Fortna2003). Sanctioning states may underestimate the complexity of the situation and push for a faster resolution, leading to a weaker agreement.
In addition to cutting off access to international trade and other financial flows, outside actors can also restrict government finances by suspending foreign aid payments. States that are dependent on this aid will be particularly receptive to these threats. Foreign aid is often allocated strategically, with countries receiving increased aid for democratizing (Alesina and Dollar, Reference Alesina and Dollar2000) or higher numbers of World Bank projects during their term on the UN security council (Dreher et al., Reference Dreher, Sturm and Vreeland2009). Unfortunately, we cannot systematically observe threats to revoke aid the way we can with sanctions. Instead, we must settle for the degree to which a state is dependent on foreign aid. While imperfect, this measure captures the ability of third parties to lean on governments to sign peace agreements in civil wars. Thus, peace agreements signed in states that highly depend on foreign aid will be weaker than agreements signed in other states.
While economic coercion through sanctions and foreign aid revocation should lead a peace agreement to be weaker on average, the relationship between mediation and agreement strength is more nuanced. In theory, mediation efforts should allow warring parties to come together and have structured conversations in an attempt to uncover each belligerent's grievances and craft a peace agreement that directly addresses them. In reality, mediation may actually serve as a substitution for full resolution (Werner and Yuen, Reference Werner and Yuen2005) and can leave dyads worse-off in the long-term because of the artificial incentives that it imposes (Beardsley, Reference Beardsley2008). Thus, we have reason to expect that mediation will produce weaker agreements on average. Mediation is most effective in generating strong agreements when mediators and belligerents work in an environment of trust and have strong incentives to contribute to the peace process, such as when regional organizations serve as mediating parties (Gartner, Reference Gartner2011). Individual mediators within regional organizations are likely to share important political and cultural characteristics with the belligerents, and these similar identities can increase actors' trust during negotiations (Olson and Pearson, Reference Olson and Pearson2002; Wehr and Lederach, Reference Wehr and Lederach1991). States in close proximity also have strong incentives to prevent the spread of conflict (Kadera, Reference Kadera1998). Because regional organizations as mediators facilitate trust and have material incentives to mitigate the likelihood of conflict recurrence, peace agreements signed in their presence will be stronger on average.
Intervention into an ongoing conflict can drastically increase its duration (Regan, Reference Regan2002) by introducing new veto players with different preferences than the primary combatants (Cunningham, Reference Cunningham2006). This effect may also lower the quality of any negotiated settlements reached in the conflict through two possible pathways. First, any agreement reached has to also satisfy the demands of external states in addition to those of the domestic combatants. This could result in weaker agreements that do not address the incompatibility between the initial combatants. Second, interveners who wish to extricate themselves from the conflict may push combatants to sign agreements, allowing them to withdraw. These agreements may be weaker than those signed more organically in conflicts without an internationalized dimension.
Model
We now turn to our measurement model of agreement strength. Ultimately, we want to use our estimates of peace agreement strength to understand why some agreements are weak and others are strong. As estimates, these values of agreement strength are uncertain, and we must account for the uncertainty in our analysis.Footnote 3 In the best case scenario where this error is truly random, ignoring it will not bias coefficients but will bias standard errors downward. If it is not random, then ignoring it can bias both coefficient estimates and standard errors. Our approach accounts for both possibilities by estimating what Armstrong et al. (Reference Armstrong, Bakker, Carroll, Hare, Poole and Rosenthal2014, 277–295) call a “full probability model,” which allows the observed indicators for each agreement to determine the measured strength of the agreement while also letting the conflict-level explanatory variables explain variation in this strength across agreements. By including explanations for agreement strength in the model, we are able to share information across observations. Intuitively, two agreements signed at the end of territorial conflicts should be more similar than an agreement signed at the end of a territorial conflict and one signed at the end of a governmental conflict. Estimating a full probability model lets us include the type of conflict an agreement was signed in, allowing us to incorporate this information into our estimates of agreement strength.
This model takes uncertainty around the estimated latent agreement strengths into account when estimating the effect of sanctions on agreement strength. This leads to a more conservative analysis because the explanatory variables have to explain variation in a range of agreement strengths instead of just a single value. This leads to more uncertainty in our estimates, so a strong effect for our explanatory variables should be interpreted as compelling support for our hypotheses.
Our full probability model is presented in Equations 1a–1b, where i indexes agreements, j indexes provisions, and k indexes conflicts. The observed indicators X are a function of latent agreement strength θ, multiplied by the discrimination parameters γ, minus the difficulty parameter α. The discrimination parameter describes how much the presence of a given provisions tells us about the strength of an agreement, and the difficulty parameter tells us how strong an agreement must be to have a given parameter. Our explanatory variables Z enter into the model as hierarchical predictors on the mean of each agreement's strength, θ, with regression coefficients β. In addition to these explanatory variables, the mean of θ also includes a random intercept δ by conflict, to account for a lack of independence between multiple agreements signed in the same conflict. The means of α, γ, and δ have normal priors with diffuse normal hyperpriors, and the standard deviations of α, γ, δ, and θ have diffuse half Cauchy hyperpriors. This choice of priors reflects our lack of theoretically driven expectations for the effect of our predictors. The regression coefficients β have diffuse Student T priors.Footnote 4


The standard IRT model is unidentified due to possibility of infinite rotations which could fit the data, so we place two identification restrictions on the model (Bafumi et al., Reference Bafumi, Gelman, Park and Kaplan2005). First, the sign on the discrimination parameter γ is constrained to be positive, as all included indicators are coded so that their presence indicates a stronger agreement, while their absence denotes a weaker one. We first estimate our measurement model on all agreement provisions and then evaluate how well this assumption fits our data. Second, to identify our model, we fix the values of θ for two peace agreements: the DUP/SPLM Sudan Peace Agreement between the Democratic Unionist Party and the Sudanese People's Liberation Movement, and the Tripoli Agreement between the government of the Philippines and the Moro National Liberation Front.
Setting the value of θ for these two agreements anchors the latent construct and ensures that our results are “correctly” oriented, with stronger agreements above zero, and weaker ones below. We set θ = −1 for the DUP/SPLM Sudan Peace Agreement because it has only two provisions, and we set θ = 1 for the Tripoli Agreement because it has 12 provisions. Because our model defines stronger agreements as those with more provisions, the DUP/SPLM Sudan Peace Agreement can serve as a “weak” anchor, while the Tripoli Agreement is a “strong” one. Fixing the value of θ for these two agreements merely orients our latent scale; it does not determine the strength of these two agreements.
Agreement strength measurement
Before presenting the estimates produced by our model, we pause to assess the validity of our measurement strategy. We first estimate a model that includes all provisions as indicators in the measurement model, with their presence coded 1 and their absence coded 0. The identification restriction that γ must be positive is based on the assumption that all indicators have a positive effect on the underlying quantity. To verify this, we assess the densities of the indicator discrimination parameters to ensure that this is a reasonable constraint (Bafumi et al., Reference Bafumi, Gelman, Park and Kaplan2005, 178). We exclude indicators whose densities are concentrated at zero.Footnote 5
We next present the measurement model's difficulty and discrimination parameters, α and γ, from the full probability model estimated using only relevant provisions. Examining these parameters helps us to understand what each provision tells us about the latent strength of a peace agreement. This is an important exercise because there is no simple test to check whether the latent construct that we have created actually aligns with our concept of peace agreement strength. Instead, we need to see whether the parameters in the model align with our theoretical expectations of how observed indicators should relate to strong and weak agreements.
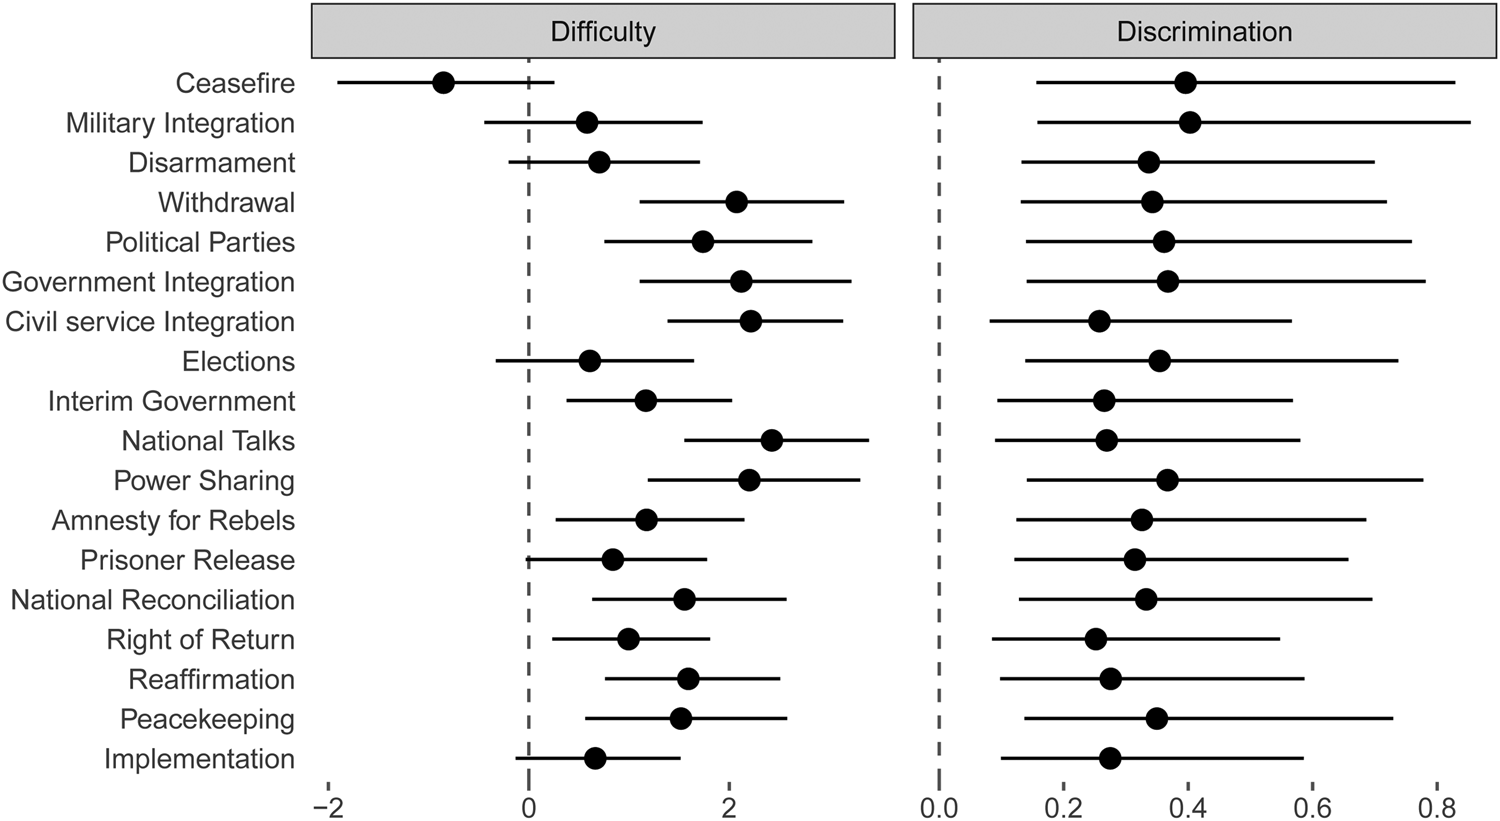
Figure 2 presents the posterior means of the difficulty and discrimination parameters in the measurement model. The higher the value of the difficulty parameter, the higher the baseline level of agreement strength required for a provision to be present. This means that an agreement has to be very strong for power-sharing or civil service integration provisions to be included, but even a very weak agreement is likely to have ceasefire provisions due to its low parameter estimate of −0.85. Ceasefire arrangements are the most common provisions, appearing in 62percent of agreements. Given their prevalence, it makes sense that agreements do not have to be very strong to include ceasefire provisions.
Difficulty (α) and discrimination (γ) parameters in the measurement model. The difficulty parameter controls the location of the item characteristic curve's inflection point, while the discrimination parameter controls the slope.

The higher the value of the discrimination parameter, the steeper the item characteristic curve (ICC) for that provision. Steeper ICCs indicate provisions that are better discriminators between strong and weak agreements. The provision with the highest discrimination is military integration with a parameter estimate of 0.4. This means that military integration is the best provision for discriminating between weak and strong agreements. Given their frequency, ceasefire provisions are a surprisingly good discriminator, with an estimate of 0.4. Taken together, these two parameter estimates mean that any agreements without ceasefire provisions are exceptionally weak.
Power-sharing agreements have a very high difficulty parameter value of 2.2 and a relatively high discrimination parameter value of 0.37. This means that agreements must be strong to have power-sharing provisions, and that the presence or absence of power sharing provisions tells us much about the strength of a given agreement. These parameter values align with the findings from the peace agreement duration literature that power sharing agreements have a significant positive impact on the duration of peace (Hartzell and Hoddie, Reference Hartzell and Hoddie2003).
The relationship between the provisions included in peace agreements and their underlying strength revealed by these parameters largely aligns with our expectations. As such, we can be confident that our latent construct really does reflect what we would analytically describe as the strength of a peace agreement. We note that the correlation between our latent measure of agreement strength and the comprehensiveness of an agreement is 0.42. This measure of comprehensiveness comes from the peace agreements data (Harbom et al., Reference Harbom, Högbladh and Wallensteen2006) and is a three-point ordinal variable denoting whether an agreement is a process, partial, or full agreement, with more comprehensive agreements coded higher. More comprehensive agreements should address more of the underlying differences behind a conflict and should be stronger as a result. This positive correlation suggests that our latent construct is properly oriented so that higher values represent stronger agreements.
The correlation between our latent strength measure and a simple additive index of provisions is 0.89. While stronger than the correlation with the comprehensiveness measure, this correlation is still not perfect. Mathematically, differences between the two can be explained by the varied difficulty and discrimination parameters in the measurement model. Substantively, this means that the nuance introduced by a measurement model tells us more about the underlying strength of a given agreement because it accounts for the fact that not all provisions are equally representative of strength. Just as an additive index contains more relevant information than a three-point ordinal variable, our latent strength measure is a similar improvement.
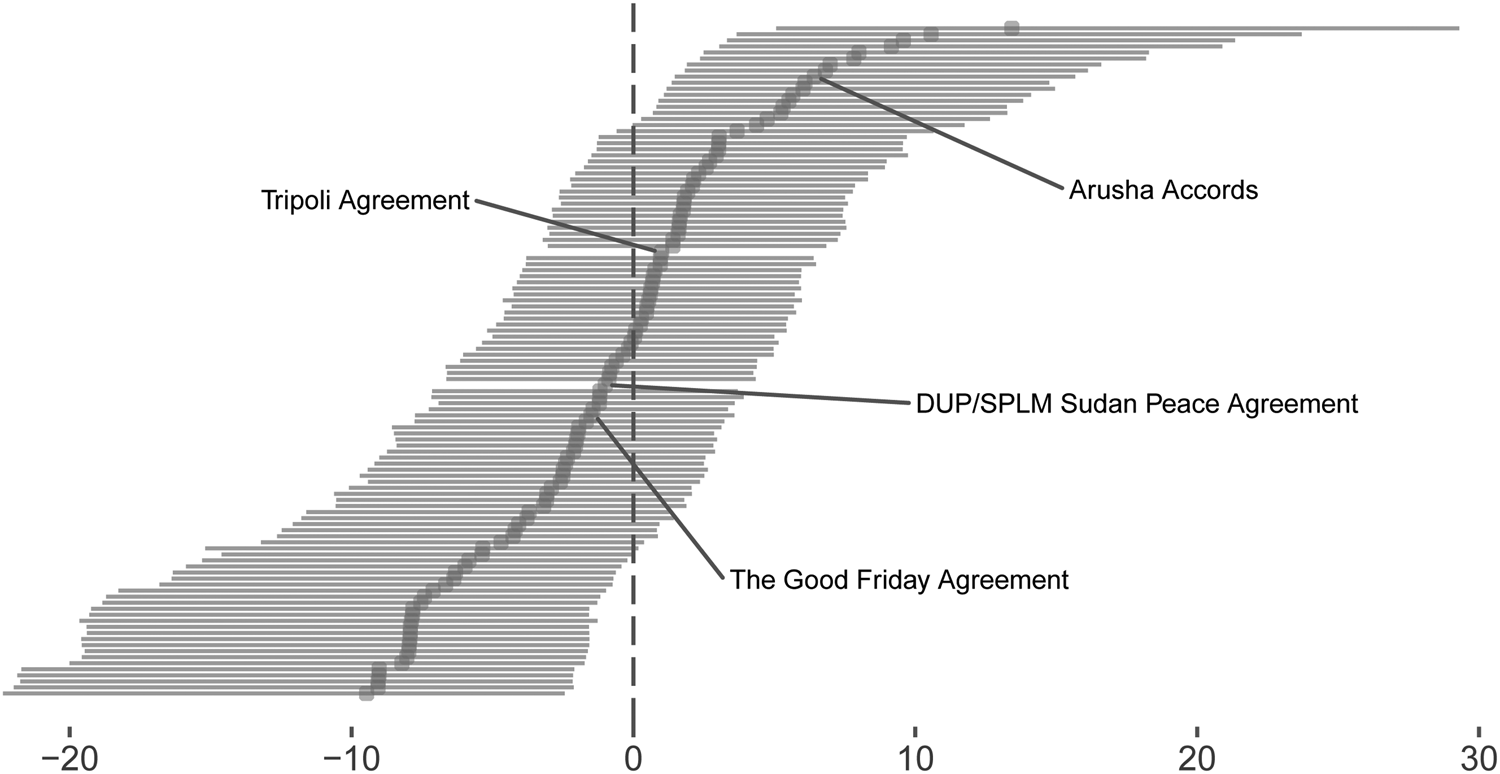
Figure 3 presents estimates for all agreements in our sample, along with associated measures of uncertainty.Footnote 6 The two-point estimates with no uncertainty are the agreements whose strength we fix to identify and orient our model.Footnote 7 The distribution of agreements along this latent scale is relatively invariant to different choices of agreements for the strong and weak identification restriction.Footnote 8 Interestingly, two frequently discussed agreements in the literature have opposite positions from what we would expect. The Arusha Accords are often held up as an example of a weak agreement that failed, leading to the resumption of hostilities and large-scale civilian killings. However, in our scale, they are one of the strongest peace agreements. The Good Friday Agreement, which ended the Troubles in Northern Ireland, is frequently considered to be a strong agreement responsible for the long-lasting peace. Yet it is in the lower half of the spectrum. We return to this puzzling finding further in our discussion.
The posterior mean of latent agreement strength is represented by the points, while the lines denote 95percent credible intervals. The observations without any uncertainty are the DUP/SPLM Sudan Peace Agreement and the Good Friday Agreement, whose values are fixed and thus not estimated.

Comparing estimates of agreement strength from the full probability model and the additive index demonstrates the benefits of our approach. We specifically look at the two agreements with the most provisions, and hence, the highest estimated strength with an additive index. The Global Ceasefire agreement between Transitional Government and the Forces pour la defence de la democratie (CNDD-FDD) of Mr. Nkúrunziza in Burundi and the Sudan Comprehensive Peace Agreement in Sudan both have 18 of the total 27 provisions in the data. An additive index approach would lead us to conclude that these two agreements have similar, if not identical, strengths. In fact, the full probability model estimates that the former has a strength of 13.42 while the latter has one of 5.31. The two agreements share only 13 of 18 provisions, and the provisions present in the former include national talks and civil service integration, which are two of the provisions with the highest discrimination parameter estimates, so their absence from the Sudan Comprehensive Peace Agreement indicates that it is weaker.
These two agreements demonstrate the nuance introduced by our measurement model compared to a simple additive index. Agreements can have the same number of provisions, but if they have different provisions, their strengths may radically vary. Our measurement model thus allows us to identify differences between agreements with the same number of provisions, which we cannot do with an additive index. Even when two agreements share the same provisions, our full probability model offers advantages over a traditional IRT model. While the agreements may share the same provisions, they will have different predictor values, and so they will receive different strength values.
Explanatory and control variables
We rely on the Threat and Imposition of Economic Sanctions (TIES) dataset to measure instances of economic sanctions (Morgan et al., Reference Morgan, Bapat and Krustev2009, Reference Morgan, Bapat and Kobayashi2014). We create a categorical variable that takes on a value of 0 for no sanction, 1 for a unilateral sanction episode, and 2 for a multilateral sanction episode. To measure whether an agreement was signed as part of a mediation process or not, we use the Civil Wars Mediation (CWM) dataset (DeRouen et al., Reference DeRouen, Bercovitch and Pospieszna2011; DeRouen and Bercovitch, Reference DeRouen, Bercovitch, Hewitt, Wilkenfeld, Gurr and Heldt2012) to code a categorical variable that takes on a value of 0 for no mediation, 1 for mediation, and 2 for regional mediation. Any agreement that is coded as a 1 on this variable indicates that mediation occurred, but there was no regional organization that participated as a mediator. We operationalize a state's dependence on foreign aid using the fraction of a state's GNI that comes from official development assistance (World Bank, 2018) to construct the variable aid. To determine whether a conflict is subject to third party military intervention, we use the International Military Intervention (IMI) Dataset (Pickering and Kisangani, Reference Pickering and Kisangani2009) to construct the dummy variable intervention, which denotes whether foreign military forces were engaged in an intervention in the country on the date an agreement was signed.
In addition to our explanatory variables, we employ a number of control variables to account for other sources of variation in peace agreement strength. To control for the possibility that stronger states will sign stronger agreements, we use relative political reach (RPR), from the Relative Political Capacity data (Arbetman and Kugler, Reference Arbetman and Kugler1997; Kugler and Tammen, Reference Kugler and Tammen2012). We also control for the possibility that conflict-level characteristics can affect the strength of agreements signed by belligerents by including a measure of whether the underlying incompatibility within a conflict was over government or territory. Because mediation efforts often target the most intractable cases (Greig, Reference Greig2005; Gartner and Bercovitch, Reference Gartner and Bercovitch2006), we include whether the conflict's cumulative intensity has exceeded 1,000 battle-deaths at the time of the agreement's signing (Gleditsch et al., Reference Gleditsch, Wallensteen, Eriksson, Sollenberg and Strand2002; Themnér and Wallensteen, Reference Themnér and Wallensteen2014). Due to decreasing security commitments after the end of the Cold War, Western governments can more credibly threaten the withdrawal of foreign aid (Bearce and Tirone, Reference Bearce and Tirone2010), so we include a dummy variable measuring whether an agreement was signed post cold war. Following standard practice, we also measure the government's polity2 score (Marshall et al., Reference Marshall, Gurr and Jaggers2014) at the time of agreement signing.
Results
In this section, we present and discuss results from our full probability model. Due to missingness in the explanatory variables, we generate five imputed datasets, run two chains on each, and then perform inference on all ten chains pooled together, averaging over the uncertainty in different imputed values (Little and Rubin, Reference Little and Rubin2002, 217–218). We run each chain for 30,000 warmup iterations, followed by 60,000 sampling iterations; all results presented are from the sampling iterations. All continuous predictors are centered and scaled to aid with mixing.Footnote 9
Agreement strength explanation
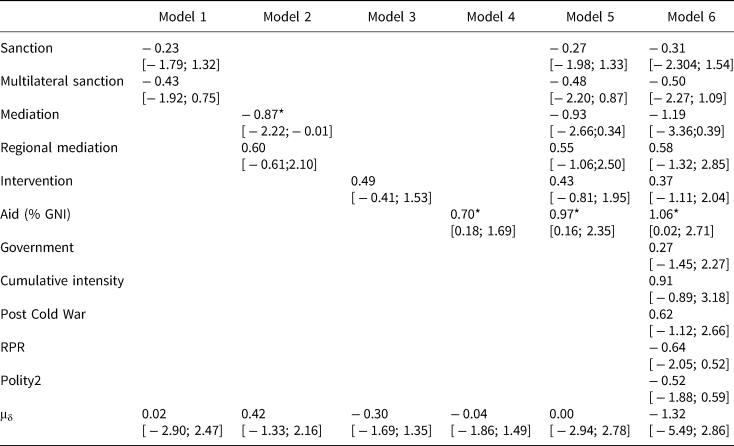
We summarize the samples from the posterior distribution for our full probability model in Table 1. The design matrix Z in the regression model does not contain an intercept term, so we include the mean of the random intercept μδ in our results as the grand mean of the regression model. We present the posterior mean and 95percent credible interval for each predictor. Models 1–4 include our explanatory variables individually, while Model 5 includes all explanatory variables. Model 6 adds our control variables. The results are relatively stable across all specifications.
Posterior density of parameter estimates for explanatory variables. The point estimates are posterior means and represent the most probable value for the relationship between each variable and agreement strength.

* 0 outside 95% credible interval
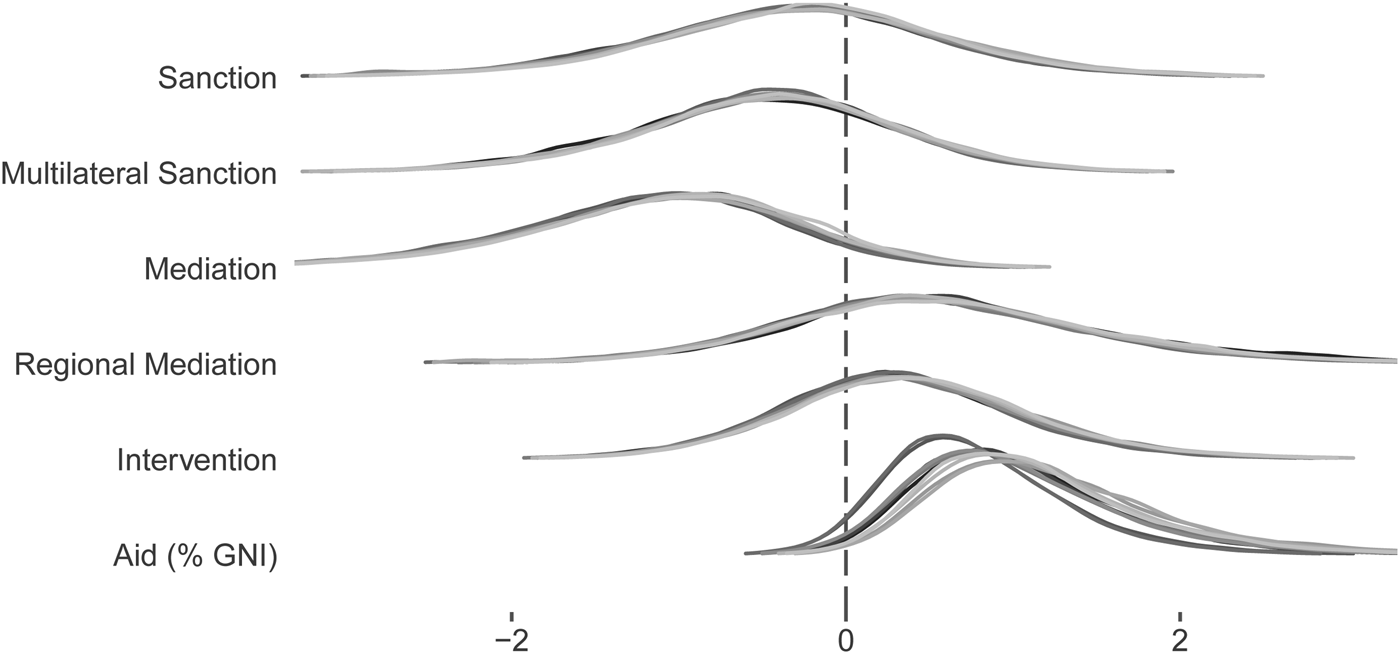
As we do not have a parametric hypothesis test threshold to evaluate the significance of our results, we want to be able to assess the effect magnitude and direction for each predictor. To accomplish this, we present our results graphically in Figure 4.
Posterior distributions for parameter estimates of our explanatory variables. Each shaded line represents a different chain, and the overlap between the lines indicates that the chains have converged to the stationary distribution. Although we display only our explanatory variables, these results are from Model 6 with control variables included.

We find support for some of our expectations pertaining to the relationship between international third-party actions and civil peace agreement strength. The posterior means of both sanctions and multilateral sanctions are negative. The model suggests that the probability that sanctions are associated with weaker peace agreements relative to no sanctions is 0.63, and the same probability for multilateral sanctions is 0.73. However, given that the β distributions for these two variables havea substantial density around 0, we are unable to state that economic sanctions or the threat thereof lead agreements to be weaker on average.
We find that mediation has a negative relationship with agreement strength relative to no mediation with probability 0.93, while regional mediation is positive relative to no mediation with probability 0.72. This lends support for our expectations, although there is a large amount of uncertainty over regional mediation relative to no mediation. Importantly, however, there is a substantial difference between the posterior estimates for mediation and regional mediation, providing evidence that the latter is associated with stronger agreements than the former. The model indicates that the probability that military intervention is positive is 0.68, contradicting our expectation. Finally, our model suggests that an increase in foreign aid dependence has a probability of 0.98 of being associated with stronger agreements. This finding does not conform with our theoretical expectations but may be due to measurement error because we are unable to directly measure the true concept of interest—threat of foreign aid revocation.
Although we find some support for our expectations, we are unable to find strong associations between the presence of economic sanctions or military intervention and the strength of an agreement. These null findings are surprising given the abundance of literature that shows how states are able to exercise some control over foreign countries' domestic politics by using these tools. Additionally, we find that regional mediation is associated with stronger agreements than non-regional mediation, but our model suggests that there is very little difference between the strengths of agreements associated with regional mediation and no mediation. The findings indicate the need for more research on the determinants of agreement strength.
Discussion
Our analysis suggests a need for more consideration of the relationship between provisions, agreement strength, and the duration of peace agreements. We find that agreement strength—treated as a function of the provisions within the document—is negatively correlated with agreement duration (ρ = −0.40). This unexpected negative correlation between agreement strength and duration raises an important question about the validity of our measure. Given that the majority of the literature argues that stronger agreements should last longer, one possibility is that we are not correctly measuring agreement strength. Another possibility, however, is that stronger agreements present belligerents with more encoded constraints over their future behavior, and parties to the agreement are more likely to renege when there are numerous provisions. Additionally, measurement error may exist in the duration of peace agreements because the coding rules used to determine whether or not an agreement has ended are imprecise.
One common validation approach in this situation is to replicate existing studies using the new measure (Smith and Spaniel, Reference Smith and Spaniel2018; Carroll and Kenkel, Reference Carroll and KenkelForthcoming). Unfortunately, we are unable to replicate a previous study because, to the best of the authors' knowledge, this study represents the first attempt to systematically measure the strength of peace agreements using more than one or two provisions. In related work, Hartzell (Reference Hartzell1999) codes the institutionalization of a peace agreement by determining whether it has rules regarding the use of coercive power, the distribution of political power, and the structuring of distributive policy. Hartzell and Hoddie (Reference Hartzell and Hoddie2003) use political, military, territorial, and economic power-sharing to code the institutionalization of an agreement. It is not clear how to translate these coding rules to the provisions in the UCDP Peace Agreement Dataset, making comparison with these studies difficult. Fortna (Reference Fortna2003) constructs a subjective measure of agreement strength, as well as an additive index of agreement provisions, but her sample is of interstate conflicts, so we cannot make comparisons to our measure of intrastate conflict agreement strength. Instead, our contribution lies in opening up new avenues of research into conflict resolution, which we discuss below.
Although we are unable to replicate previous work, we believe that the surprising latent strength values of some agreements in our sample offer insight into how we study conflict resolution. The position of the Arusha Accords near the top of our scale and the Good Friday Agreement below the middle are particularly curious. The model implies that the Arusha Accords are strong partially because several of their provisions have very high discrimination parameters in our measurement model such as military integration, peacekeeping operations, and elections. Thus, the agreement encoded a number of theoretically peace-improving provisions despite its short existence. Our model suggests that the Good Friday Agreement is not strong despite its persistence because it does not contain a provision for a ceasefire, which is relatively easy to come by and tells us quite a bit about the latent strength of an agreement. Additionally, several of the provisions in the Good Friday Agreement such as those pertaining to cultural freedoms and a referendum were dropped because we deemed them to relate to a different latent dimension. This second dimension of peace agreements presents one interesting avenue for future research.
Conclusion
By employing Bayesian IRT, we are able to measure and explain the strength of peace agreements without having to rely on simple additive indices or subjective codings of agreement strength. Our measure exhibits substantial variation, even among agreements with the same number of provisions, indicating that it is better at capturing qualitative differences between agreements. In contrast to subjectively weighting specific provisions, a Bayesian IRT model of agreement strength offers a principled way to exclude irrelevant provisions while allowing the data to determine the relationship between individual provisions and agreement strength.
We believe that our measurement strategy improves upon current operationalizations of peace agreement strength, but the decision about which measure to use is fundamentally dependent on the research question at hand. Our measure is essentially a consolidation of the information present in peace agreements that pertain to a single dimension of peace agreement strength. Because of this, this measure is useful when research questions focus on the strength of negotiated settlements as a concept. Our measure is not well suited for research questions that are concerned with the causes or effects of individual provisions present in peace agreements. Additionally, our measure of peace agreement strength cannot speak to issues of implementation or enforcement outside of what is contained in the provisions. While these research questions require different measures, our measurement strategy is appropriate for a large number of questions pertaining to an agreement's underlying strength.
The ability to reliably measure the strength of such small numbers of agreements opens up many new opportunities to ask questions researchers could not previously evaluate systematically. Are stronger peace agreements more likely to see full implementation (Joshi and Darby, Reference Joshi and Darby2013; Joshi et al., Reference Joshi, Quinn and Regan2015) of their various elements? Do different types of mediator leverage (Reid, Reference Reid2017) lead to stronger or weaker agreements? Do biased mediators (Svensson, Reference Svensson2009) lead to stronger agreements than unbiased ones? Do multilateral mediation efforts (Böhmelt, Reference Böhmelt2012) produce stronger agreements than unilateral ones? While we focus on intrastate conflicts due to the wealth of mediation data in the CWM data, analyses which employ explanatory variables also available for interstate conflicts can utilize all 216 agreements in the UCDP Peace Agreement Dataset. Such analyses could explore whether certain factors better explain agreement strength in each type of conflict.
Bayesian IRT measurement models have been used to study many phenomena in international relations, and the full probability model approach we employ allows these approaches to be used even when data are scarce. We measure the strength of only 111 peace agreements due to limited data availability. Yet due to the additional information contained in the predictors of agreement strength included in the full probability model, we are able to obtain stable estimates of agreement strength despite the small sample size. When lots of data are available, the additional effort required of the full probability model may not be warranted, but when observations are few, the increases in measurement validity make it worthwhile.
It is also important to highlight the shortcomings of our approach. The use of a full probability model that includes predictors in addition to a measurement model allows us to produce stable estimates of agreement strength despite our small sample size. However, this means that our measurements cannot easily be included in other analyses as response or explanatory variables. Instead, researchers must estimate a full probability model using their predictors of interest. The model can be computationally costly, but when data are scarce, as with our sample of 111 agreements, we believe that the ability to reliably estimate latent constructs outweighs the added computational burden.
Based on our results here, we make some basic methodological recommendations for researchers wishing to use IRT to measure the strength of peace agreements. First, if there are any agreements that are especially relevant to your theoretical argument, do not select them as identification restrictions. Agreements used to anchor the latent scale can shift greatly in the ranking of agreements when compared to a model where they are not selected as an identification restriction. However, agreements that are not chosen as identification restrictions rarely move more than five places in the ranking under different identification strategies. Second, use a full probability model instead of separate IRT and regression models. While this strategy is more computationally intensive, the estimates incorporate more information about the phenomena at hand which should lead to better predictive accuracy when used in other analyses.
If future work confirms our findings that mediation can weaken agreements in some contexts, this would suggest that merely solving the time inconsistency problem (Beardsley, Reference Beardsley2008) does not lead to stronger mediated agreements. By being able to measure the strength of peace agreements irrespective of their eventual success or failure, we can increase the range of questions we can ask, leading to a better understanding of conflict termination overall. Bayesian IRT can be used to better measure existing concepts when observations and observable indicators are few, but this paper shows that it can also be used to ask questions we otherwise would not be able to.
Supplementary Material
The supplementary material for this article can be found at https://doi.org/10.1017/psrm.2019.23
Author ORCIDs
Rob Williams 0000-0001-9259-3883.
Acknowledgments
An earlier version of this article was presented at the 2017 Annual Meeting of the International Studies Association, February 2017, Baltimore, MD, where Cliff Morgan provided valuable feedback. The authors also thank Elizabeth Menninga, Johannes Karreth, Ryan Bakker, Santiago Olivella, Layna Mosley, and two anonymous reviewers for their helpful comments which greatly improved the article.