

Introduction
Poultry is currently the largest meat production industry in the U. S. In 2013, the total live weight of broilers produced was 23 billion kg, equating to nearly $31 billion in revenue (NASS, 2014). This volume is almost double the amount of meat produced by the beef industry, which reached 11.7 billion kg (USDA, 2014). Of the poultry produced, only 3.3 billion kg were exported, leaving 19.7 billion kg of poultry to be consumed nationally (US Poultry and Egg Association, 2014).
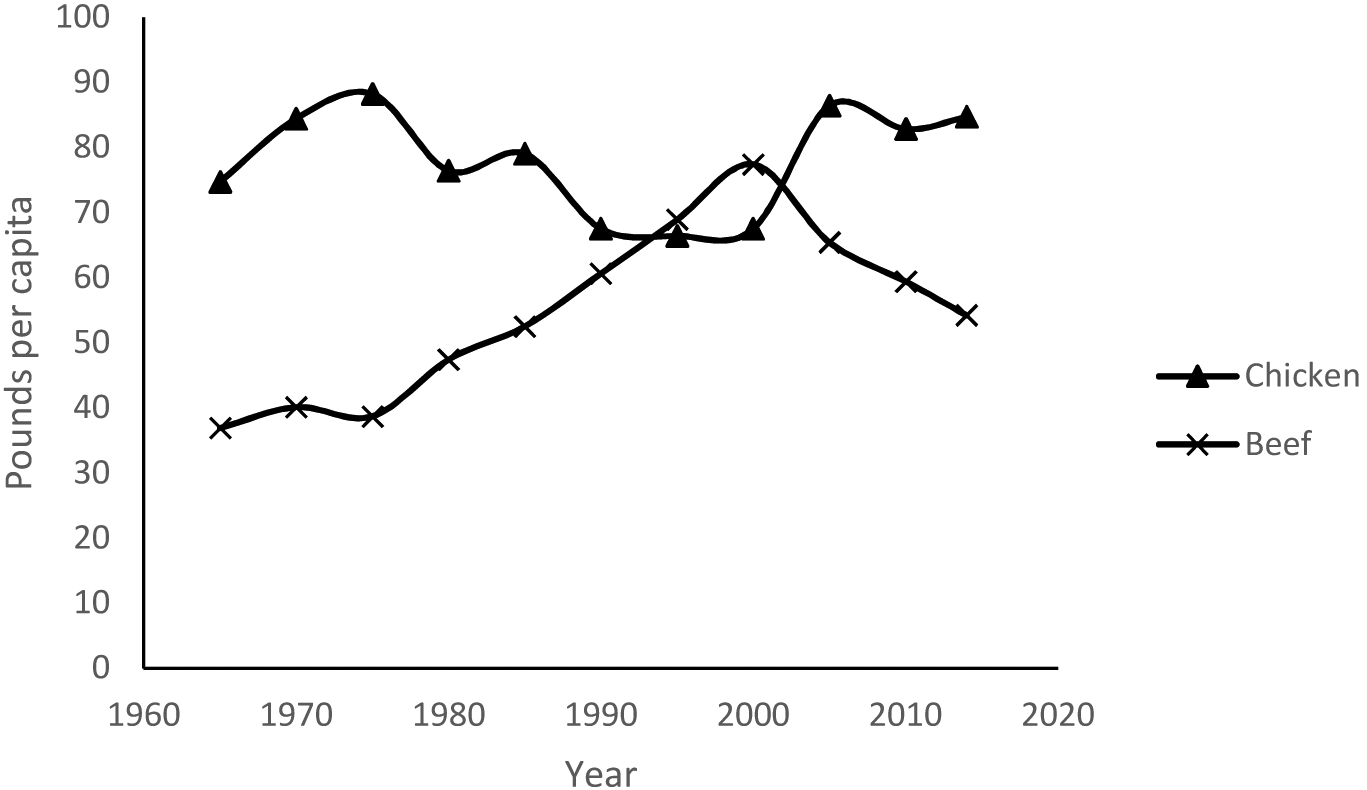
Worldwide poultry production and consumption is growing, especially in Asia, with China the second largest producer and consumer of poultry behind the U.S. (Figures 1a and b). Over the last 50 years, U.S. consumers have eaten an ever increasing amount of poultry and continue to consume less beef (Figure 2). This steadily increasing consumer preference for chicken meat is due to a combination of factors, including lower cost, increased convenience and ease of preparation as well as increased consumer awareness of health factors such as lower cholesterol in poultry as compared to red meat (Haley, Reference HALEY2001; Resurreccion, Reference RESURRECCION2004; Michel et al., Reference MICHEL, PUNTER and WISMER2011). Additionally, the International Agency for Research on Cancer (IARC) recently conducted a meta-analysis of 800 epidemiological studies and determined that at least half of the studies indicated an increased risk for colorectal cancer among those who consumed red meats; which were by the IARC definition, not only beef, but several other meats including pork (WHO, Reference WHO2015).
A: Top five chicken meat producing countries by year B: Top five chicken meat consuming countries by year. Values in metric tons (X 1000). Data abstracted from the International Poultry Council.

Sustainability and the carbon footprint of food sources are becoming important drivers for consumer purchases in today's environmentally-conscience world. Beef production uses 28 times as much land for livestock production as for pork or chicken, consumes 11 times more water and generates five times as many greenhouse gases (Eshel et al., Reference ESHEL, SHEPON, MAKOV and MILO2014). In the matter of feed conversion, broilers average 2:1 in feed to weight gain respectively, as compared to beef cattle which average around 6:1.
Per capita consumption of beef and chicken in the U.S. (in pounds). Data abstracted from the Economic Research Service of the United States Department of Agriculture.
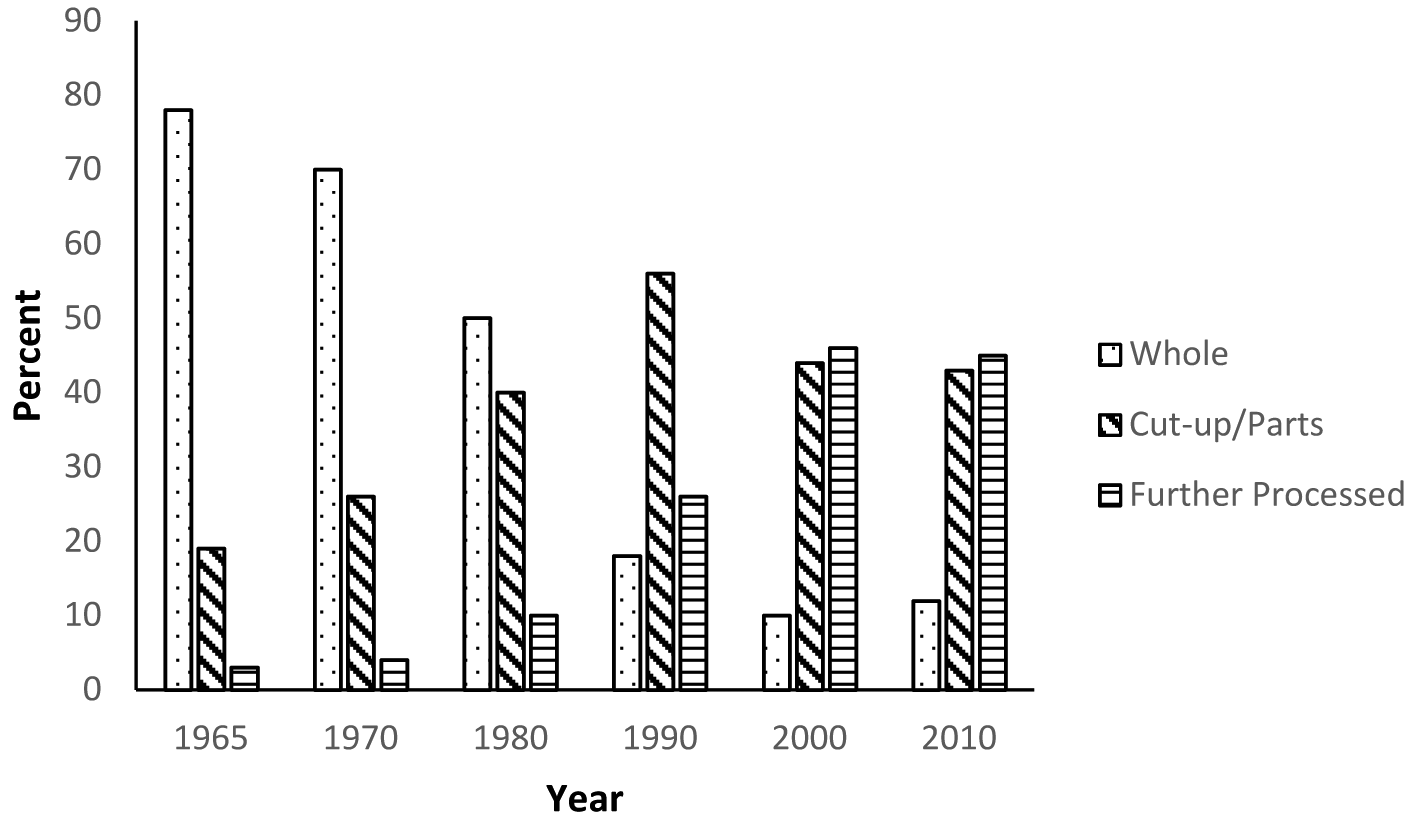
The trend of selling raw, whole chickens, referred to as WGs (without giblets or New York dressed) to consumers has steadily declined in recent years (Figure 3). Whole carcass purchases have dropped from more than 78% of sales in 1962 to 12% of total poultry meat sales in 2010.
Change in how broilers are marketed by percent.
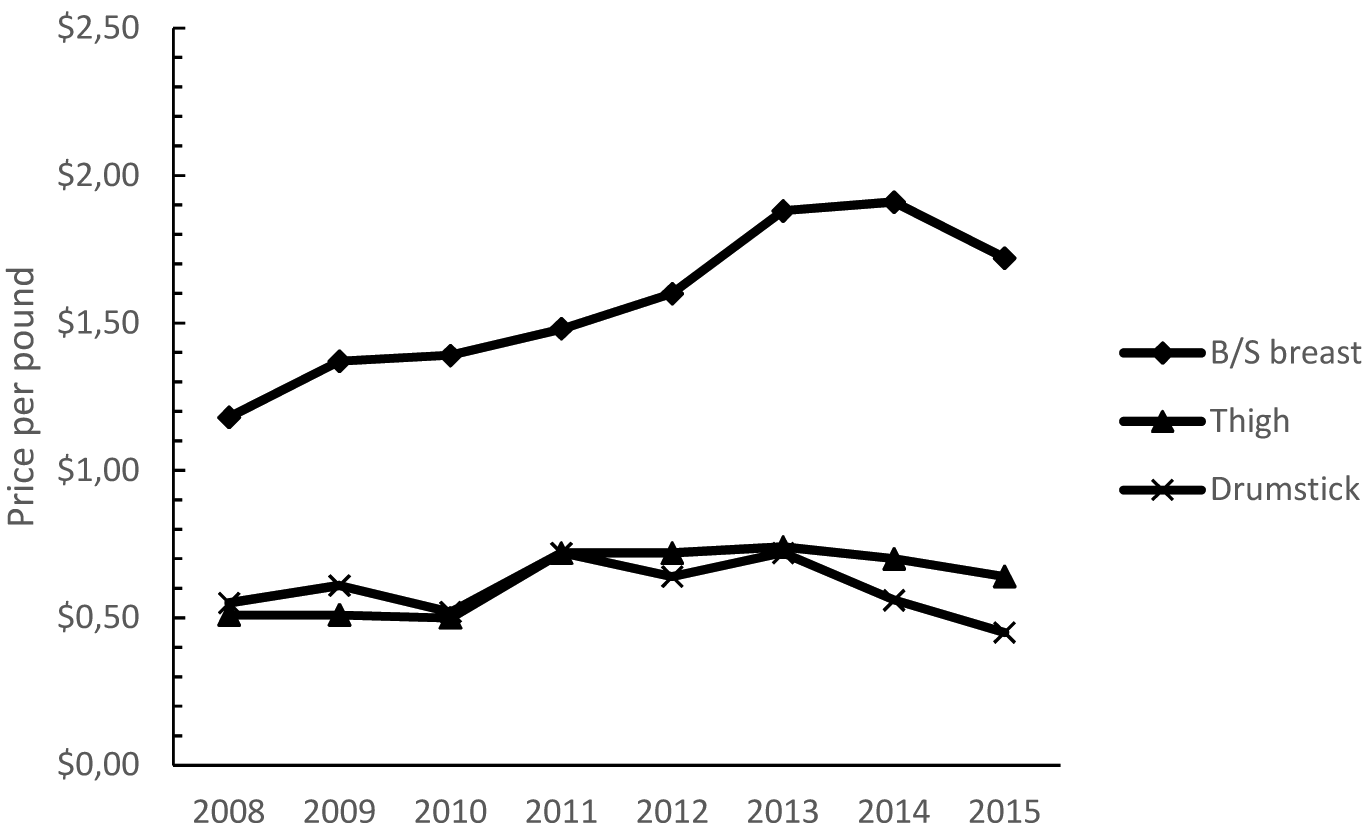
This is most likely due the increased amount of time required to prepare whole birds, with consumers preferring the ease and speed of cooking individual poultry parts (Magdelaine et al., Reference MAGDELAINE, SPIESS and VALCESCHINI2008). While worldwide preference of poultry cuts differs, in the U.S. breast meat is strongly preferred over dark meat. In 2012, a survey was conducted by the National Chicken Council to determine the frequency and preference of chicken consumption among U.S. consumers. The survey found that the average consumer eats chicken 10 times a month, and when chicken is prepared in the home 91% of those surveyed preferred white breast meat over dark poultry meat (National Chicken Council, 2012). Alternatively, consumers in China almost universally prefer dark meat and the feet of the chicken, with breast meat being sold at a lower value (ERS/USDA, 2013). Carcass yield analysis shows equal amounts of white and dark meat per bird, e.g. a 3.2 kg (7 lb) bird contains approximately 25% breast meat and 31% leg and thigh meat, so this strong consumer colour preference for white meat causes much of the dark meat to be exported or sold at lower prices. At the end of 2008, Georgia Dock Prices for skinless-boneless breast meat were US$1.18/lb, and the price has increased to US$1.72/lb in mid-November 2015, whereas leg and thigh meat has stayed relatively steady around US$0.60 to US$0.70/lb (Figure 4).
Price per pound at Georgia docks of select poultry parts. Data abstracted from Georgia Department of Agriculture (2015).
This review discusses the causes for colour difference in different cuts of poultry meat, examines how environmental and genetic factors influence the colour of poultry meat, and investigates ideas for increasing the marketing of dark meat poultry in the U.S.
Means of measuring poultry meat colour
instrumental methods
Colour preferences are a subjective characteristic of meat as interpreted by the consumer. In order to measure, classify and reproduce colour readings it has been necessary to develop objective instrumental parameters. Food colour is most frequently measured in terms of the CIE scale where L*, a*, b* values plus hue angle and chroma are quantified. The CIE Lab colour space defines the L*, a* and b* values against an international colour standard measurement, adopted by the Commission International d'Eclairage (CIE) in 1976 (Girolami et al., Reference GIROLAMI, NAPOLITANO, FARAONE and BRAGHIERI2013). In this method, the L* value is the lightness component, which ranges from 0 to 100 (from black to white); a* and b* both range from -120 to +120 with a* ranging from green if negative to red if positive and b* ranging from blue if negative to yellow if positive (Papadakis et al., Reference PAPADAKIS, ABDUL-MALEK, KAMDEM and YAM2000; Yam and Papadakis, Reference YAM and PAPADAKIS2004). Poultry meat colour is instrumentally measured using a colorimeter that measures the CIE L*, a* and b* values; colorimeters only measure an area of the meat between 2-5 cm2 (Kang et al., Reference KANG, EAST and TRUJILLO2008).
Visual methods
Assessment of colour by visual evaluation is most closely related to how consumers evaluate meat colour, but it is complex, expensive and time-consuming. Among the difficulties with using humans to evaluate meat is that colour as seen by each person is influenced by personal preference, the lighting of the area in which meat is observed, problems with vision of the individuals doing the evaluating as well as environmental appearance factors other than colour (AMSA, 2012). There are two types of sensory panels that can be used to evaluate meat colour, trained visual colour panels and consumer panels. The research studies reported in this paper which report visual colour assessments primarily used trained, descriptive visual colour panels which are regarded by many as being equal in precision and reproducibility to objective instruments (AMSA, 2012). These trained panellists undergo rigorous screening and training to be able to reproduce quantitative ratings of samples with a defined anchored scale. Consumer panels, on the other hand are normally asked to rate their personal preferences or acceptability of the samples they evaluate. Consumer panels are often also called on to rate preference and or acceptability of colour on a numeric scale. Information on how to set up and conduct visual assessments of colour can be found in Meilgaard et al. (Reference MEILGAARD, CIVILLE and CARR1991) and Miller (Reference MILLER1994).
One of the significant factors influencing consumer preference of poultry meat is the colour of the meat at the point of purchase (Font-i-Furnols and Guerrero, 2014). Consumers tend to prefer poultry meat that has a colour very similar to what they are used to (Kennedy et al., Reference KENNEDY, STEWART-KNOX, MITCHELL and THURNHAM2005). There are many factors that affect the colour of poultry meat, some having to do with the bird itself, but environment and processing can also affect meat colour. In the next section we will discuss these factors.
Factors affecting poultry meat colour
total haem and myoglobin content
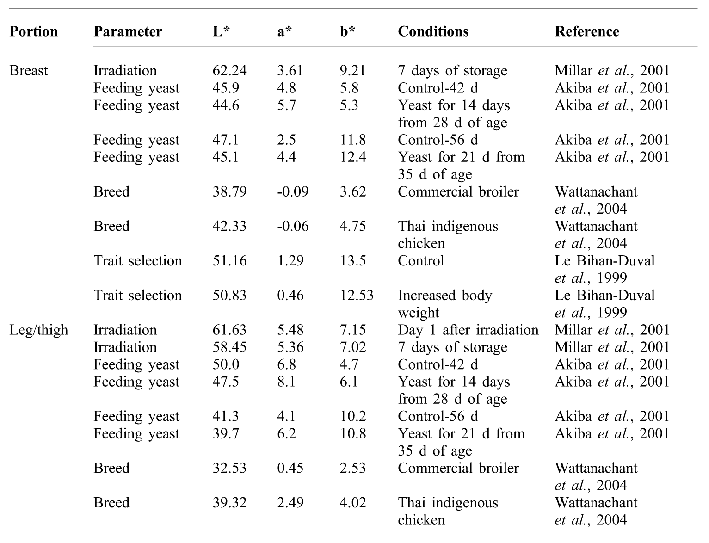
Meat colour is highly correlated to the amount of haem containing compounds such as myoglobin, haemoglobin, and cytochrome c (Froning et al., Reference FRONING, DADDARIO and HARTUNG1968; Fleming et al., Reference FLEMING, FRONING and YANG1991; Froning, Reference FRONING1995). Of these three haem iron containing compounds, myoglobin contributes the most to the colour of poultry meat. Table 1 displays total haem and myoglobin content and Table 2 displays Hunter L* a* b* readings of the breast, thigh and leg muscles from different broiler experiments. The results differ based on myoglobin extraction technique, treatment and bird source. However, within most individual experiments the myoglobin content in breast muscle was significantly lower than that of the leg/thigh muscle. The leg and thigh meat has a high proportion of what are known as red muscle fibres, while the breast meat is almost entirely composed of white fibres (Barbut, Reference BARBUT2001). Red fibres are high in myoglobin as compared to white fibres.
Total haem iron and myoglobin values from different broiler experiments.
Hunter colour values from different broiler experiments. L* values are for lightness (0 is black and 100 is white); a* values indicate redness (positive a* values indicate red and negative values indicate green); b* values indicate yellowness (positive b* values indicate yellow and negative values indicate blue).
Myoglobin extraction can be done using several different methods, and thus the results of different experiments may be affected by the specific extraction method used. Using the method of Rickansrud and Henrickson (Reference RICKANSRUD and HENRICKSON1967), Rhee and Ziprin (Reference RHEE and ZIPRIN1987) found that chicken drumstick meat had higher total haem pigments (0.68 and 0.41 mg/g) and myoglobin content (0.05 and 0.13 mg/g) than the total haem pigment (0.17 and 0.16 mg/g) and myoglobin content (0.0 mg/g) of breast meat. Total haem pigment includes haemoglobin and cytochrome c compounds, which also contain haem iron, as well as myoglobin. Using his own method, Fleming et al. (Reference FLEMING, BLUMER and CRAIG1960, Reference FLEMING, FRONING and YANG1991) found that ice-slush and air-chilled thigh meat had higher total haem pigment (0.59 and 0.79 mg/g) and myoglobin content (0.21 and 0.30 mg/g) than that of breast meat total haem pigment (0.32 and 0.44 mg/g) and myoglobin content (0.15 and 0.16 mg/g). Boulianne and King (Reference BOULIANNE and KING1998) determined that the ice-slush storage conditions of the breast meat may have caused some of the haem pigments to leak into the water; however, the strong negative correlation of the L* colour value and amount of haem in the breast meat suggest the lack of haem pigment directly correlates to the paleness of the breast meat.
Using total haem determination and size exclusion chromatography, Kranen et al. (Reference KRANEN, VAN KUPPEVELT, GOEDHART, VEERKAMP, LAMBOOY and VEERKAMP1999) found that the sartorius and adductor muscles of the thigh had higher total haem pigment (0.79 and 1.39 mg/g) and myoglobin content (0.12 and 0.56 mg/g) than that of pectoralis muscle of the breast (total haem pigment 0.24mg/g and myoglobin content not detected). Using the methods of Rickansrud and Henrickson (Reference RICKANSRUD and HENRICKSON1967), Boulianne and King (Reference BOULIANNE and KING1995) found significantly less total haem pigment and myoglobin content (0.96 and 0.12 mg/g) in pale pectoralis major muscle of the breast when compared to the total haem pigment and myoglobin content of normal pectoralis major muscle meat (1.47 and 0.17 mg/g).
Chickens displaying dark coloured breast meat, with no other lesions, are sometimes seen during slaughter. These carcasses are often condemned in the U.S. and Canada because inspectors may classify them under septicemia-toxemia in the U.S., or cyanosis in Canada. Using the methods of Rickansrud and Henrickson (Reference RICKANSRUD and HENRICKSON1967), Boulianne and King (Reference BOULIANNE and KING1998) found that unacceptably dark breast muscle meat showed higher total haem pigment and myoglobin concentrations (1.47 and 0.16 mg/g) when compared to the total haem pigment and myoglobin concentrations of normal breast muscle meat (0.96 and 0.12 mg/g); while it is unclear what the cause of the darkened breast meat is, there is once again a strong correlation between total haem pigment and L* values.
effect of pH on colour
The pH of the meat also seems to have a strong influence on the colour of the meat, with higher pH values resulting in a darker meat colour (Fletcher, Reference FLETCHER1999). Wattanachant et al. (Reference WATTANACHANT, BENJAKUL and LEDWARD2004) studied the pH and Hunter L* values of broiler thigh and breast, and found that the thigh had a pH of 6.62 and an L* value of 32.53 whereas the breast had a pH of 5.93 and an L* value of 38.79, supporting the contention that higher pH values result in a darker raw meat colour. Le Bihan-Duval et al. (Reference LE BIHAN-DUVAL, MILLET and REMIGNON1999) found that broiler breast with an average pH of 5.77 had an average L* value of 50.7. Lonergan et al. (Reference LONERGAN, DEEB, FEDLER and LAMONT2003) found that broiler breast muscle with an average pH of 5.82 had an average L* value of 43.34. This in turn can affect the colour of the cooked meat since dark raw meat results in cooked meat that is significantly darker (Fletcher et al., Reference FLETCHER, QIAO and SMITH2000). Dark raw breast meat with an average pH of 5.93 and an L* value of 45.4 had an average pH of 6.21 and an average L* value of 78.8 after cooking, whereas normally coloured raw breast meat had an average pH of 5.84 and an L* value of 47.6, with the pH and L* values rising to 6.15 and 79.6 respectively when cooked (Fletcher et al., Reference FLETCHER, QIAO and SMITH2000). The high pH of the darker meat may also lead to the more rapid development of off-odours and a lowered shelf-life (Allen et al., Reference ALLEN, RUSSELL and FLETCHER1997; Reference ALLEN, FLETCHER, NORTHCUTT and RUSSELL1998).
effect of age/sex of birds on colour
Froning et al. (Reference FRONING, DADDARIO and HARTUNG1968) observed when broilers are slaughtered at an increased age, the L* values of the breast and thigh meat decrease, regardless of sex. This darkening of the meat may be related to the increase of myoglobin content as the bird ages. Brewer et al. (Reference BREWER, KUTTAPPAN, EMMERT, MEULLENET and OWENS2012) found that sex did not affect the colour of breast fillets in four different broiler strains. Ngoka et al. (Reference NGOKA, FRONING, LOWRY and BABJI1982) found that turkey breast muscles significantly increased in L* value when 16-week old turkeys were compared to 20-week old turkeys (50.62 to 53.24 respectively). Smith et al. (Reference SMITH, LYON and LYON2002) however, found no effect of age on the colour of poultry broiler breast fillets. Alternatively, Abdullah et al. (Reference ABDULLAH, MUWALLA, MAHARMEH, MATARNEH and ISHMAIS2010) found that broilers slaughtered at 32 days had significantly (p< 0.05) lower L* values (51.11) compared to broilers slaughtered at 42 days (53.35). In general, colour of breast and thigh seems to be independent of the sex of the bird but tends to become darker as the bird ages.
effect of breed on colour
Bianchi et al. (Reference BIANCHI, PETRACCI and CAVANI2006) compared Cobb 500 and Ross 508 strains, and found no difference in broiler breast meat colour based on genotype of the bird. When comparing five commercial broiler strains, Mehaffey et al. (Reference MEHAFFEY, PRADHAN, MEULLENET, EMMERT and OWENS2006) found no significant difference in breast L* colour values among these breeds. Brewer et al. (Reference BREWER, KUTTAPPAN, EMMERT, MEULLENET and OWENS2012) found that strain of broiler did not have a major effect on breast filet colour. However, when comparing Hubbard classic and Lohman strains of broilers, Abdullah et al. (Reference ABDULLAH, MUWALLA, MAHARMEH, MATARNEH and ISHMAIS2010) found that the breast meat in Lohman broilers was significantly lighter in colour (L* value 51.14) than in Hubbard (L* value 53.32), even though the pH of the breast meat was essentially identical.
Selective breeding for higher weight and breast meat yields has been standard throughout the poultry industry for decades to improve profits. Berri et al. (Reference BERRI, WACRENIER, MILLET and LE BIHAN-DUVAL2001) found that this selection for higher body weight and breast meat yield led to lighter breast meat when compared to commercial and experimental groups, which they attributed to the lower haem iron content of these birds breast meat. Comparing a slow-growing French label-type line and a fast-growing standard line of commercial chickens, Debut et al. (Reference DEBUT, BERRI, BAEZA, SELLIER, ARNOULD, GUEMENE, JEHL, BOUTTEN, JEGO, BEAUMONT and LE BIHAN-DUVAL2003) found that the breast and thigh meat of the fast-growing line were lighter (L* values 52.82 and 51.22 respectively) than that of the breast and thigh meat of the slow-growing line (L* values 50.76 and 50.07 respectively). Lonergan et al. (Reference LONERGAN, DEEB, FEDLER and LAMONT2003) compared inbred Leghorn, inbred Fayoumi, commercial broilers, F5 broiler-inbred Leghorn cross, and F5 broiler-inbred Fayoumi cross and determined that the breast meat of all strains had equivalent L* values, but the inbred leghorns had a more intense red colour.
effects of diet on colour
The composition of the poultry ration may affect meat colour, as Smith et al. (Reference SMITH, LYON and LYON2002) found when poultry fed a wheat-based diet produced significantly lighter coloured fillets than poultry fed a corn-based diet. Du and Ahn (Reference DU and AHN2002) found that increasing conjugated linoleic acid levels in the diet did not affect the a* values of broiler breast fillets. Lyon et al. (Reference LYON, SMITH, LYON and SAVAGE2004) found that the breast meat of broilers fed a wheat-based diet had significantly higher (lighter) raw and cooked L* values (47.12 and 80.24 respectively) when compared to corn- (45.20 and 79.44) and milo- (45.47 and 79.57) based diets. Ryu et al. (Reference RYU, RHEE, LEE and KIM2005) found that adding supplemental selenium to a broiler diet had no effect on the colour of the breast or the thigh muscles. Jiang et al. (Reference JIANG, JIANG, LIN, XI, YU and WU2007) found that supplementing a broiler diet with 40 or 80 mg of a synthetic soybean isoflavone significantly increased the L* value of the breast meat (57.5 and 56.9 respectively) compared to a control group (54.7). Nam et al. (Reference NAM, MIN, YAN, LEE, MENDONCA, WESLEY and AHN2003) found that adding 100 IU/kg synthetic vitamin E to turkey diets increased the a* of the breast meat (8.1) when compared to the control (7.0). Kim et al. (Reference KIM, LEE and CHOI2014) determined that feeding red ginseng to broilers did not lighten the thigh meat, and actually increased the a* value of the thigh meat. Souza et al. (Reference SOUZA, FREITAS, DOS SANTOS, CIPRIANO, FIGUEIREDO and DANTAS2015) determined that adding annatto seed to a sorghum based diet increased the L* values of the thigh meat significantly over the diet without annatto, indicating that there are some dietary interventions that may be valuable to influence the colour of chicken thigh meat.
effect of rearing on colour
Kucukyilmaz et al. (Reference KUCUKYILMAZ, BOZKURT, CATLI, HERKEN, CINAR and BINTAS2012) compared quality parameters of slow-growing broilers reared under either organic or conventional rearing systems, with fast-growing broilers grown under conventional conditions. Breast and thigh meat from conventionally raised fast-growing birds was significantly redder but less yellow than slow growers reared conventionally. Organic production system increased the yellowness of the meat regardless of rearing. Almasi et al. (Reference ALMASI, ANDRASSYNE, MILISITS, KUSTOSNE and SUTO2015) determined that the thigh muscle of a slow growing breed of chicken kept on free range was darker (L*=75.12 vs. 78.33) when compared with the same breed grown indoors. Considering these results it does not appear that method of rearing has a significant effect on the colour of poultry meat.
effect of processing parameters on colour
Chilling method
Fleming et al. (Reference FLEMING, FRONING and YANG1991) studied the difference in colour and haem pigment levels in breast and thigh muscles of ice-slush-chilled versus air-chilled broilers. There were no significant differences in L*, a* and b* values between methods for the same muscle, although they discovered significant differences in the total haem pigment levels between the breast and thigh. No significant effects on haemoglobin and myoglobin levels were observed between chilling methods, but there was significantly more cytochrome c in the muscles of the air chilled birds, which would explain the difference in total haem pigments. Bowker et al. (Reference BOWKER, ZHUANG and BUHR2014) similarly found no difference in L*, a* or b* values of deboned breast meat of broilers that were air chilled as compared to those that were water immersion chilled, confirming lack of effect of chilling method.
Chemicals used as antimicrobials
Most further-processing methods focus on reducing the microbial load of the broiler carcass before it is shipped to consumers, preventing potential food-borne pathogen consumption and increasing the shelf life of the product. Weak organic acids such as citric acid, lactic acid, and malic acid have been have been employed as antimicrobials on poultry meat and may affect the colour of the meat. Treatment of chicken legs with succinic acid at 3% (w/v) and 5% (w/v) caused the legs to develop a greyish appearance due partially to the reduced yellowness of skin colour (Cox et al., Reference COX, MERCURI, JUVEN, THOMSON and CHEW1974). Del Río et al. (Reference DEL RÍO, PANIZO-MORÁN, PRIETO, ALONSO-CALLEJA and CAPITA2007) treated chicken legs with citric acid (2% w/v) and had an untrained consumer panel evaluate the samples which found no difference in colour of the treated samples as compared to untreated controls. On the other hand, Kolsarici and Candogan (Reference KOLSARICI and CANDOGAN1995) found that the appearance of chicken legs treated with lactic acid was not acceptable when compared to the control samples. Other organic acids such as malic acid and benzoic acid caused no significant changes in appearance of breast fillets (Skrřivanová et al., Reference SKRŘIVANOVÁ, MOLATOVA, MATENOVA and MAROUNEK2011). Chemical agents such as phosphates, particularly trisodium phosphate (TSP), have been studied to a great extent to validate their potency as antimicrobials. Whole chicken carcasses treated with TSP dodecahydrate were found to be pinker in appearance compared to the untreated controls and were preferred by the untrained panellists even after the eighth day of storage (Hollender et al., Reference HOLLENDER, BENDER, JENKINS and BLACK1993). All of these studies were done with skin on chicken, so it is unknown whether any colour changes occur in the actual meat itself.
Increasing the use of dark meat
change U.S. consumers’ perceptions of dark meat
To increase U.S. consumption of dark poultry meat is possible. In the past, advertising promoted white meat as the healthiest part of the chicken due to its low fat content. In retrospect however, this may have been a mistake, and to help consumer acceptability, advertising needs to change to promote all parts of a chicken as being healthy. This will a challenge as more than 90% of U.S. consumers have a strong preference for breast meat even when offered an extreme price discount for dark meat. For instance, Perdue has produced broilers with yellow skin pigment for many years, which is different to broilers produced by most other companies. Currently Perdue Farms is ranked as the 4th largest U.S. broiler company, producing over 56 million pounds of chicken in 2014 (US Poultry, 2015). Through effective communication and aggressive marketing Purdue is able to sell their product on a consistent basis, finding that customers now prefer the yellow pigment, viewing it as an indication of a natural, healthy bird (Williams, Reference WILLIAMS1992). If dark meat can be successfully marketed as equally healthy to white meat, then consumers may be more willing to switch.
A 2010 Harris Poll found that eight out of 10 U.S. adults watch at least one cooking show per week (The Harris Poll, 2010). Out of those who watch cooking programs, 57% have purchased specific foods as the result of seeing it on a show. The hosts on several of these cooking shows have started promoting thigh meat over breast meat in many recipes, promoting its flavour and ability to retain moisture during cooking. Continued promotion of recipes that use thigh and leg meat over breast meat may increase consumer demand for dark meat. The preference for white breast meat of many of the U.S. consumers could potentially be changed so that dark meat and white meat are equally used; thus, the value of dark meat could rise and the cost of export could drop, resulting in higher profits for the industry.
surimi type products made from thigh meat
The Japanese word surimi literally means ‘minced meat’ and originally referred to a frozen concentrate of fish myofibrillar proteins which was stabilised by cryoprotectants to protect the proteins from denaturation during freezing (Zamula, Reference ZAMULA1985). The surimi technique includes washing, leaching, additive addition and freezing (Kim and Park, Reference KIM and PARK2007). The leaching process removes pigments as well as other compounds, increasing the whiteness of the product (Balange and Benjakul, Reference BALANGE and BENJAKUL2009). However, to completely remove all of the pigments from the chicken dark meat a longer leaching process at a higher temperature is needed which negatively impacts the functionality of the protein, including gelation, water holding capacity and emulsifying ability (Ismail et al., Reference ISMAIL, HUDA and FAZILAH2011).
extraction of protein using pH shift
The pH shift method for extracting proteins was first developed for fish dark meat and is now widely used in the fish processing industry (Kristinsson and Hultin, Reference KRISTINSSON and HULTIN2003). The advantages of this process over that of the surimi process are that it is economical, has a high yield and does not negatively impact the functionality of the fish proteins (Undeland et al., Reference UNDELAND, KELLEHER and HULTIN2002; Kristinsson et al., Reference KRISTINSSON, THEODORE, DEMIR and INGADOTTIR2005). Omana et al. (Reference OMANA, MOAYEDI, XU and BETTI2010) found that by using alkali extraction of proteins from dark meat of chicken at a high pH they were able to produce proteins with lighter colour, increased texture and good functionality.
Conclusions
Consumers in the U.S. have a clear preference for lighter coloured, poultry breast meat compared to darker leg/thigh meat. There are several opportunities for novel marketing of dark poultry meat to make it more appealing to consumers, especially in the USA. However, physical, physiological, or chemical treatments to make dark meat more acceptable will take time to develop, may not have the desired strength of effect, and may not be accepted by consumers. Therefore the marketing of dark meat needs to change in order for consumers to consider dark meat as equal to white meat. The majority of fat in dark meat chicken is mono- and poly-unsaturated fat, which is equal to or greater than the amount found in breast meat. With research showing that reducing saturated fats and adding unsaturated fats to a diet can reduce heart disease risk, marketing all poultry meat as healthy is justifiable. There may be a perceived better texture of dark meat compared to breast meat for some consumers, and there is a need to demonstrate that tenderness is equal between cuts. Promoting the use of dark meat in recipes on cooking shows and in other media would be beneficial, as if consumer perception can change, then there is no need to modify the meat itself.