INTRODUCTION
The intracellular protozoan parasite Neospora caninum is an important cause of abortions and congenital infections in cattle. Dogs and coyotes have been identified as definitive hosts of the parasite, and can excrete oocysts in their faeces after eating tissues from infected animals. Cattle can become infected by ingestion of feed contaminated with oocysts, and in pregnant cows the infection can be transmitted to the foetus. Transplacental infection occurs as a result of a primary infection during pregnancy, but also after reactivation in chronically infected cows, and this is the dominant route of infection in cattle. Congenitally infected calves can show neuromuscular symptoms, or can be born apparently healthy but later in life they transmit the infection to their offspring. Neospora caninum can also cause neuromuscular disease in dogs and occasionally in other animal species (Dubey et al. Reference Dubey, Buxton and Wouda2006).
Mice are often used to study various aspects of N. caninum infection. While many mouse strains are more or less resistant and do not develop the disease, some inbred strains such as the BALB/c and C57 strains have been found to be susceptible (Lindsay et al. Reference Lindsay, Lenz, Cole, Dubey and Blagburn1995; Long et al. Reference Long, Baszler and Mathison1998). After parenteral administration of live tachyzoites, the infection is disseminated throughout the body. In the early stage of infection parasites can be detected in the blood, and in several organs such as lungs, liver, spleen and lymph nodes. In severe cases, general unspecific symptoms, such as a rough hair coat and decreased activity and appetite, are seen during the acute stage of the infection. As host immune responses develop, the parasites are more or less cleared from the spleen, liver and lungs and, after approximately 14 days, they are mainly found in the brain. This stage of infection is associated with the development of neurological symptoms, such as tilting of the head, walking in circles, hind limb weakness and stilted gait, and affected mice will lose weight and eventually die (Alaeddine et al. Reference Alaeddine, Keller, Leepin and Hemphill2005; Collantes-Fernández et al. Reference Collantes-Fernández, López-Pérez, Álvarez-Garcia and Ortega-Mora2006; Lindsay et al. Reference Lindsay, Lenz, Cole, Dubey and Blagburn1995; Nishikawa et al. Reference Nishikawa, Inoue, Xuan, Nagasawa, Igarashi, Fujisaki, Otsuka and Mikami2001).
Since the central nervous system is a predilection site for N. caninum, neurological symptoms, brain pathology and brain parasite load, which are detected either by immunohistochemistry or PCR, are often used as parameters of disease severity in mice (Cannas et al. Reference Cannas, Naguleswaran, Müller, Gottstein and Hemphill2003; Lindsay et al. Reference Lindsay, Lenz, Cole, Dubey and Blagburn1995; Long et al. Reference Long, Baszler and Mathison1998). Others have used pathological lesions and occurrence of parasites in other organs during the earlier stages (Baszler et al. Reference Baszler, Long, McElwain and Mathison1999; Nishikawa et al. Reference Nishikawa, Inoue, Xuan, Nagasawa, Igarashi, Fujisaki, Otsuka and Mikami2001). The development of a semi-quantitative competitive PCR (Liddell et al. Reference Liddell, Jenkins and Dubey1999) and quantitative real-time PCR assays (Collantes-Fernández et al. Reference Collantes-Fernández, Zaballos, Álvarez-Garcia and Ortega-Mora2002; Müller et al. Reference Müller, Vonlaufen, Gianinazzi, Leib and Hemphill2002; Okeoma et al. Reference Okeoma, Stowell, Williamson and Pomroy2005) have substantially increased the possibility of studying the pathogenesis of neosporosis, and evaluating methods for immune prophylaxis and antimicrobial therapy. For example, real-time PCR has been used to study the occurrence of parasites in the blood of experimentally infected mice (Collantes-Fernández et al. Reference Collantes-Fernández, López-Pérez, Álvarez-Garcia and Ortega-Mora2006) and in naturally infected pregnant cows (Okeoma et al. Reference Okeoma, Stowell, Williamson and Pomroy2005). Detection and quantification of parasites in the blood is of great interest, since it is reasonable to assume that the duration and level of parasitaemia will determine to which extent the brain or placenta will be infected (Innes et al. Reference Innes, Andrianarivo, Björkman, Williams and Conrad2002; Staska et al. Reference Staska, McGuire, Davies, Lewin and Baszler2003). Since both of these organs are considered as immunoprivileged sites, the key to effective prophylaxis could be finding a means to prevent or minimize parasitaemia after primary infection or reactivation of a chronic infection.
We have previously reported that an experimental vaccine containing recombinant NcSRS2, one of the major immunodominant surface antigens of N. caninum, bound to immune stimulating complexes (iscoms) induces immunity sufficient to reduce both clinical symptoms and the amount of parasite DNA in the brains of infected mice (Pinitkiatisakul et al. Reference Pinitkiatisakul, Mattsson, Wikman, Friedman, Bengtsson, Ståhl and Lundén2005, Reference Pinitkiatisakul, Friedman, Wikman, Mattsson, Lövgren-Bengtsson, Ståhl and Lundén2007). To further assess the protective effect of this iscom vaccine, we have now used real-time PCR to detect and quantify N. caninum DNA in blood after challenge infection of immunized mice. In addition, the relationship between the level of parasitaemia during the acute stage and the amount of parasite DNA in the brain 3 weeks after infection, as well as the disease severity measured as body weight loss, was investigated.
MATERIALS AND METHODS
Mice and parasites
Specific pathogen-free female BALB/c mice, 10–12 weeks of age, were obtained from the National Veterinary Institute, Uppsala, Sweden, and kept in accordance with the national guidelines (Swedish permit no. C274/3). The NC-1 isolate of N. caninum (Dubey et al. Reference Dubey, Dorough, Jenkins, Liddell, Speer, Kwok and Shen1998) was propagated in Vero cells in F-DMEM with 2 mm L-glutamine (National Veterinary Institute) and 5% horse serum (Gibco, Karlsruhe, Germany), as previously described (Lundén et al. Reference Lundén, Marks, Maley and Innes1998). For inoculation of mice, the parasites were suspended in cell-culture medium without horse serum.
Recombinant protein and iscoms
The recombinant protein and the different iscom preparations used in this study have been described previously (Pinitkiatisakul et al. Reference Pinitkiatisakul, Friedman, Wikman, Mattsson, Lövgren-Bengtsson, Ståhl and Lundén2007; Wikman et al. Reference Wikman, Friedman, Pinitkiatisakul, Hemphill, Lövgren-Bengtsson, Lundén and Ståhl2005). Briefly, a fusion protein, consisting of a 232 amino acid segment (SRS2′) from the central region of NcSRS2, streptavidin (SA) and a His6-tag, was expressed in Escherichia coli. This protein was then bound either via the streptavidin to biotinylated iscom matrix (i.e. iscoms without any antigen) or via the His6-tag to Ni2+-coated iscom matrix. The resulting iscoms were denoted SRS2′-iscom(Bio) and SRS2′-iscom(Ni), respectively.
Experimental design and sample collection
Experiment 1
Initially an experiment was set up to evaluate whether the previously developed real-time PCR assay (Pinitkiatisakul et al. Reference Pinitkiatisakul, Friedman, Wikman, Mattsson, Lövgren-Bengtsson, Ståhl and Lundén2007) was sensitive enough to detect differences in parasitaemia by analysis of the relatively small volumes of blood that can be collected from a mouse on several subsequent occasions. Forty-two mice were divided into 3 groups of 12 mice each and inoculated subcutaneously (s.c.) at the base of the tail with 5×10⁶ (Group 1), 106 (Group 2) or 105 (Group 3) freshly harvested NC-1 tachyzoites in 0·1 ml of cell-culture medium. The remaining 6 mice (Group 4) were injected with 0·1 ml of cell-culture medium, and served as uninfected controls.
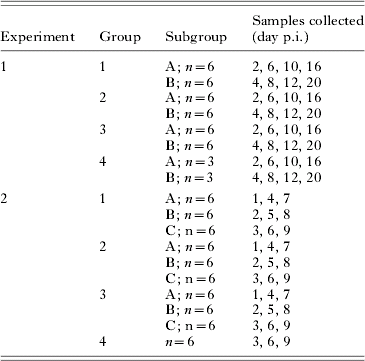
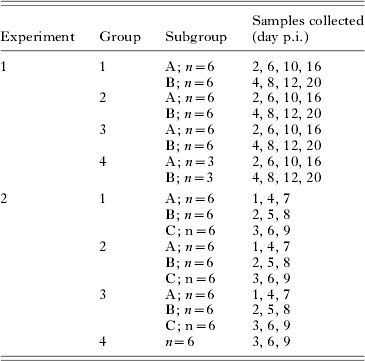
To detect parasitaemia after the infection, whole blood samples were collected every second day for 12 days post-inoculation (p.i.), and on days 16 and 20 p.i. Each group was divided into 2 subgroups (A and B) with 6 (Groups 1–3) or 3 mice (Group 4) each, which were bled on alternate sampling days as shown in Table 1. At sampling, 6 drops of blood from the ventral tail artery were collected into 75 μl of Alsever's solution (citric acid monohydrate, 0·5 mg/ml; D-glucose, 20·5 mg/ml; sodium chloride, 4·2 mg/ml; tri-sodium citrate dihydrate, 8 mg/ml; pH 6·1).
Collection of blood samples
After inoculation, the mice were observed daily, and clinical symptoms recorded. Each mouse was individually weighed on day −1 p.i. and from day 5 p.i. at 2–4 day intervals. Mice that showed neurological symptoms or had lost more than 15% of their initial body weight were killed before the end of the experiment. The remaining mice were killed on day 23 p.i. (6 mice in Group 1) or day 25 p.i. (Groups 2–4). The brain was collected from each mouse and divided longitudinally, and one of the halves was stored at −70°C for real-time PCR analysis. On day 25, blood samples were taken from all mice before they were killed.
Experiment 2
Sixty mice were divided into 3 groups of 18 mice (Groups 1–3) and 1 group with 6 mice (Group 4). Groups 1–3 were each divided into 3 subgroups with 6 mice (A–C). Groups 1 and 2 were immunized s.c. at the base of the tail with SRS2′-iscom(Bio) and SRS2′-iscom(Ni), respectively, each dose containing 1 μg protein and 4–5 μg Quil A in 0·1 ml of phosphate-buffered saline (PBS). Groups 3 and 4 were given 0·1ml of sterile PBS, and served as non-immunized, infected controls and as uninfected controls, respectively. After 28 days, all groups received a second injection identical to the first. The mice were bled from the tail at day 43, and the antibody responses to native N. caninum antigens were analysed by ELISA as previously described (Wikman et al. Reference Wikman, Friedman, Pinitkiatisakul, Hemphill, Lövgren-Bengtsson, Lundén and Ståhl2005).
On day 49 after the first immunization, all mice in Groups 1–3 were inoculated s.c. with 107 freshly harvested NC-1 tachyzoites in 0·1 ml of cell-culture medium, while the mice in Group 4 were injected with 0·1 ml of cell-culture medium. From days 1 to 9 p.i., blood samples were collected from the different subgroups on alternate days as shown in Table 1. Six drops of blood were collected into 100 μl of Alsever's solution. Individual mice were weighed daily from days −2 to 21 p.i., and clinical symptoms were recorded daily. As in the first experiment, severely affected mice were killed before the end of the experiment on day 21 p.i. The brains from all mice were collected and stored as in Exp. 1.
DNA extraction and real-time PCR analysis
From each blood sample, 200 μl were taken for DNA extraction with the EZ1 DNA Blood 200 μl Kit in a Bio Robot EZ1 (Qiagen, Hilden, Germany), according to the manufacturer's instructions. The DNA was eluted in a final volume of 100 μl of H2O and stored at −20°C until analysis. Each brain hemisphere was weighed and divided into 4 parts, from which genomic DNA was extracted as previously described (Pinitkiatisakul et al. Reference Pinitkiatisakul, Friedman, Wikman, Mattsson, Lövgren-Bengtsson, Ståhl and Lundén2007). The DNA was eluted in 100 μl of H2O, and 10 μl from each of the 4 samples from each mouse was pooled. The concentration of the extracted DNA was measured with a NanoDrop ND-1000 spectrophotometer (NanoDrop Technologies, USA), and 60–100 ng DNA from blood or 15–25 ng DNA from brain were used in each PCR reaction.
A real-time PCR assay, based on the detection of the Nc-5 repeated sequence of N. caninum and the double-stranded DNA binding dye SYBR Green, was used to detect and quantify parasite DNA in the blood and brain samples. The analysis was performed as previously described (Pinitkiatisakul et al. Reference Pinitkiatisakul, Friedman, Wikman, Mattsson, Lövgren-Bengtsson, Ståhl and Lundén2007), using Power SYBR Green (Applied Biosystems, Foster City, CA).
Neospora caninum DNA extracted from NC-1 tachyzoites was used as a positive control and to generate a standard curve that was included in each run, together with a negative control with water. The detection limit of the test was 0·008 pg, because the standard dilution with less N. caninum DNA did not give any amplification product. Since the SYBR Green dye binds unspecifically to double-stranded DNA, samples that had a Ct value close to that of the negative control or samples from uninfected mice were separated by 1·5% agarose gel electrophoresis and stained with ethidium bromide, to view any possible bands before being judged as positive or negative. For the blood samples, the results were expressed as pg N. caninum DNA per mg total DNA, and for the brain samples as pg N. caninum DNA per mg brain tissue.
Statistical analysis
The statistical significance of differences between groups in body weight changes was analysed by one-way ANOVA and Tukey's pairwise comparison of the regression coefficient for the change over time of individual mice. The regression analysis was done with the weights recorded on days 9–21 p.i. in Exp. 1. For Exp. 2, weight changes during days 4–9 p.i. and 9–21 p.i. were analysed separately, since the infected control mice started to lose weight on day 5 p.i. while the immunized mice did not begin to lose weight until day 9 p.i.
One-way ANOVA and Tukey's pairwise comparison were also used to compare the amounts of N. caninum DNA in the brains and the log(10)-transformed antibody titres. The significance of differences in concentration of parasite DNA in the blood between groups and over time was examined with a two-factorial ANOVA. Before analysis, the concentration was expressed as pg parasite DNA/mg total DNA +1 and log(10)-transformed to diminish the effect of extreme values. To get an estimate of the degree of parasitaemia to compare with the parasite load in the brains, the area under the curve for each group (Figs 1B and 2B) was calculated and expressed in an arbitrary unit.
RESULTS
Experiment 1
Clinical symptoms
Clinical symptoms such as a ruffled hair coat were observed in all inoculated mice from day 6 p.i. In the groups inoculated with the two highest doses these symptoms remained until the end of the experiment, while most of the mice given the lowest dose recovered and appeared to be normal after day 10 p.i. Some of the mice developed neurological symptoms typical of neosporosis, and 6 mice in Group 1, 3 mice in Group 2 and 2 mice in Group 3 showed such severe symptoms that they had to be killed between days 16 and 23 p.i. No clinical symptoms were observed in the uninfected control group.
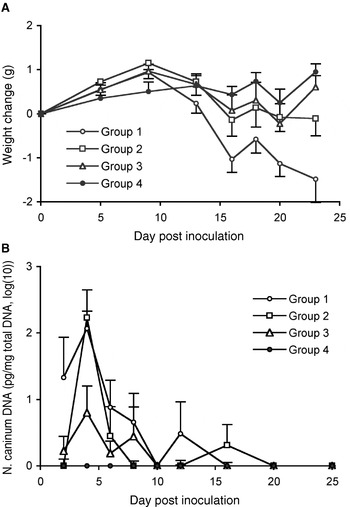
In all inoculated groups the average body weight started to decline from day 9 p.i., whereas in the uninfected group it remained approximately the same from this time-point until the end of the experiment (Fig. 1A). The differences between the groups were statistically significant (P<0·01), and the pair-wise comparisons showed that the mice given 5×10⁶ tachyzoites lost significantly more weight than those given the lower doses of 106 and 105 tachyzoites. However, the weight changes in the two latter groups were not significantly different from those of the uninfected control group.
Body weight changes (A) and amount of parasite DNA in blood (B) of mice inoculated with different numbers of Neospora caninum tachyzoites, Group 1: 5×10⁶; Group 2: 106; Group 3: 105; Group 4: uninfected control. Six mice in Group 1, 3 mice in Group 2 and 2 mice in Group 3 were killed on days 16–23 p.i. because of severe symptoms. The results are presented as means±s.e.m., n=12 for Groups 1–3 and n=6 for Group 4. Blood was collected from 6 infected and 3 control mice on each occasion.

Parasite DNA in blood and brains
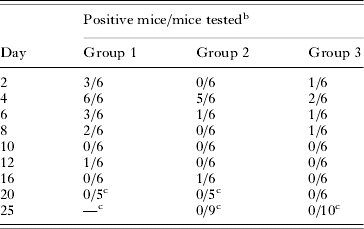
Neospora caninum DNA was detected in blood samples from all infected groups, most frequently from days 2 to 8 p.i. and thereafter only sporadically (Table 2). The amount of parasite DNA in the different groups is shown in Fig. 1B. The variance between mice given different numbers of parasites was statistically significant (P<0·01) as well as the variance over time (P<0·001) without any significant interaction between group and time (P=0·102). In all groups, the peak of parasitaemia appeared to occur at day 4 p.i., as judged by the number of positive mice as well as by the geometrical means.
Neospora caninum DNA detected in blood of mice after inoculation with different numbers of live tachyzoitesFootnote a
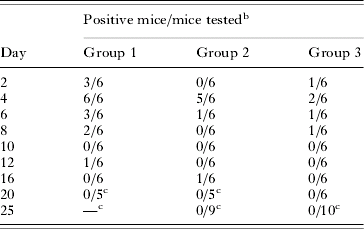
a The inoculation dose was 5×10⁶ for Group 1, 106 for Group 2 and 105 for Group 3.
b There were 12 mice in each group, and 6 of them were bled at alternate time-points.
c Some mice were killed before day 25.
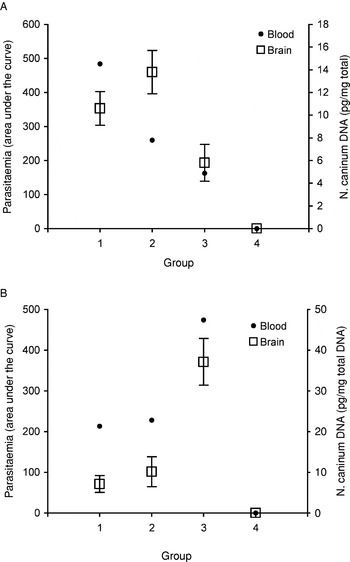
Neospora caninum DNA was detected in the brain from all inoculated mice, except 3 mice given the lowest number of tachyzoites. The levels were slightly, but not significantly, higher in Group 2 than in Group 1, while the levels in Group 3 was significantly lower than in Group 2 but not than in Group 1 (P<0·01 for the overall significance between groups). All brain and blood samples from the uninfected control mice were negative (Fig. 3A).
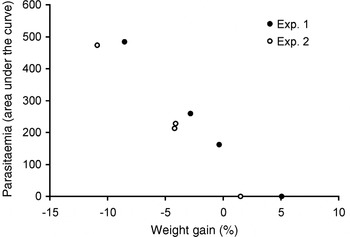
The relationship between the parasite load in the brains and the degree of parasitaemia measured as the area under the curve day 0–10 p.i. is shown in Fig. 3A. The level of parasitaemia appeared to correlate well with the inoculation dose, and fairly well with the level of N. caninum DNA in the brains. The level of parasitaemia also correlated well to disease severity measured as average body weight changes (Fig. 4).
Experiment 2
Antibody responses to immunization
Analysis of the sera collected before infection revealed high levels of N. caninum-specific antibodies in all mice immunized with the two different SRS2′ iscom preparations, without any significant differences between Group 1 and 2 (data not shown). The non-immunized mice in Group 3 were all seronegative.
Clinical symptoms
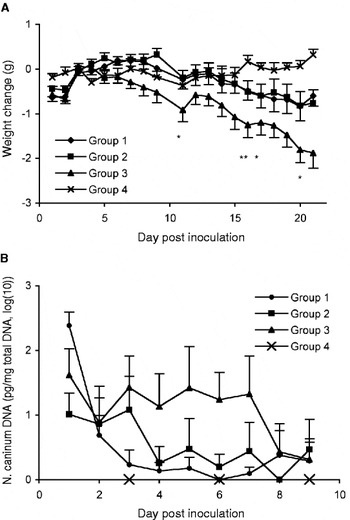
Mild clinical signs such as a ruffled hair coat were observed from days 5 to 10 p.i. in all mice inoculated with NC-1 tachyzoites. Thereafter, most immunized mice recovered and appeared to be normal. However, some of them continued to show mild signs of illness until the end of the experiment; and in 2 mice in Group 1 and 1 mouse in Group 2 the symptoms aggravated, and they were killed on day 20 p.i. The non-immunized infected mice in Group 3 developed progressive clinical signs, such as more ruffled hair coats, hind limb weakness, stilted gait and other typical neurological signs of neosporosis. Five of the 18 mice in this group had to be killed at days 11, 16 (2 mice) 17 and 20 p.i. as indicated in Fig. 2A.
Body weight changes (A) and amount of parasite DNA in blood (B) of mice inoculated with Neospora caninum tachyzoites. Groups 1 and 2 were immunized with NcSRS2 iscoms, Group 3 were non-immunized infected controls and Group 4 were uninfected controls. * Indicates the days when 5 mice in group 3 were killed because of severe symptoms. The results are presented as means ± s.e.m., n=18 for Groups 1–3 and n=6 for Group 4. Blood was collected from 6 infected mice each day, and from the 6 uninfected mice on days 3, 6 and 9.

In Group 3, the average body weight (Fig. 2A) started to fall on day 4 p.i. and continued to decrease until the end of experiment. In contrast, the average weights in Groups 1 and 2 did not start to decrease until day 9 p.i., and the losses (days 9–21) were significantly less than in Group 3 (P<0·001), while the differences on days 4–9 were not significant (P=0·327). There were no significant differences in weight changes between the two immunized groups, and although the mean body weight of the uninfected controls in Group 4 increased slightly during the experiment it did not differ significantly from that of Groups 1 and 2.
Parasite DNA in blood and brains
In this experiment blood was collected every day from days 1 to 9 p.i. and the amount of N. caninum DNA in the different groups is presented in Fig. 2B. For the inoculated groups the variation between groups and over time was statistically significant (P<0·001 and P<0·01), and although there was no significant interaction between groups and days (P=0·228), the duration of parasitaemia appeared to be shorter in Groups 1 and 2 than in Group 3. In Group 1, parasite DNA was detected in 3 mice or more only on days 1 and 2 p.i., and in Group 2 on days 1 to 3 p.i., while in Group 3 at least 3 mice were positive on days 1–7 p.i.
The amount of N. caninum DNA in the brains from the different groups is shown in Fig. 3B. Parasite DNA was detected in all mice in Group 3, and the levels were significantly higher than in both immunized groups (P<0·001), in which 5 and 4 mice, respectively, had levels below the detection limit. The levels in Group 2 were slightly, but not significantly, higher than in Group 1.
Relationship between parasitaemia and brain parasite load. (A) Mice were inoculated with different doses of Neospora caninum tachyzoites; Group 1: 5×10⁶; Group 2: 106; Group 3: 105; Group 4: uninfected. (B) Mice immunized with NcSRS2 iscoms (Groups 1 and 2) and non-immunized mice (Group 4) were inoculated with 107 tachyzoites. As the measure of parasitaemia the area under the curves in Figs 1B and 2B was used. The amount of N. caninum DNA in the brain is expressed as the mean±s.e.m.

As shown in Fig. 3B and Fig. 4, there appeared to be a good correlation between the degree of parasitaemia measured as the area under the curve and the concentration of parasite DNA in the brains, as well as with the changes in body weight after infection.
Correlation between average body weight gain (%) and level of parasitaemia measured as the area under the curve (Figs 1B and 2B) for the different groups in Exps 1 and 2.

DISCUSSION
To study the duration and level of parasitaemia in mice infected with N. caninum, we needed a method that could detect and quantify parasites in the relatively small amounts of blood that can be collected from mice on multiple occasions. Thus, we have previously developed a real-time PCR (Pinitkiatisakul et al. Reference Pinitkiatisakul, Friedman, Wikman, Mattsson, Lövgren-Bengtsson, Ståhl and Lundén2007) which we now used to analyse blood from mice inoculated with different numbers of tachyzoites. In the mice given the highest dose, parasites were detected in at least 3 of 6 mice on days 2, 4 and 6 p.i., while most of the samples collected at later time-points were negative. In the mice given the two lower doses, fewer samples were positive but the pattern of parasitaemia was similar. These results agree well with a similar recently published study, in which parasitaemia was detected in the majority of inoculated mice from days 1 to 7 p.i., and thereafter only sporadically (Collantes-Fernández et al. Reference Collantes-Fernández, López-Pérez, Álvarez-Garcia and Ortega-Mora2006).
These results were used to design the second experiment, in which we compared parasitaemia in immunized and naïve mice after challenge infection with a large number of tachyzoites. By analysis of blood samples collected daily from days 1 to 9 p.i., we found significant differences between the groups as regards the amount of parasite DNA, and that the duration of parasitaemia appeared to be shorter in the immunized mice than in the non-immunized controls. Furthermore, the level of parasitaemia seemed to be correlated to the amount of parasite DNA detected in the brains at day 21 p.i., and to disease severity measured as body weight losses. Brain parasite load is generally considered to be a relevant parameter for the severity of murine neosporosis. For example, it has been shown that both the number of parasites detected by immunohistochemistry and the number of histological brain lesions increase with increasing inoculation doses (Long et al. Reference Long, Baszler and Mathison1998), and that mice with neurological symptoms have significantly more parasite DNA in their brains than do infected but asymtomatic mice (Collantes-Fernández et al. Reference Collantes-Fernández, López-Pérez, Álvarez-Garcia and Ortega-Mora2006).
We have previously shown that recombinant NcSRS2-iscoms induces immunity sufficiently to reduce both clinical symptoms and the amount of parasite DNA in the brain after challenge infection (Pinitkiatisakul et al. Reference Pinitkiatisakul, Friedman, Wikman, Mattsson, Lövgren-Bengtsson, Ståhl and Lundén2007). The results of the present study indicate that the immunized mice were able to control the infection already during the early stage, resulting in reduced parasitaemia and a lower number of parasites reaching the brain. Similarly, in a study with the closely related Toxoplasma gondii, mice immunized with an attenuated strain of the parasite had reduced parasitaemia after challenge infection as demonstrated by PCR (Kirisits et al. Reference Kirisits, Mui and McLeod2000).
It might seem obvious that the degree of parasitaemia will influence the outcome of an infection with N. caninum, but to our knowledge there are limited data actually showing this. However, there is some evidence presented by Macaldowie et al. (Reference Macaldowie, Maley, Wright, Bartley, Esteban-Redondo, Buxton and Innes2004) supporting this assumption. In 2 groups of pregnant cattle inoculated at day 70 of gestation, foetal mortality was higher and occurred earlier in the group that was inoculated intravenously than in the groups given the parasites subcutaneously. Also, although parasite DNA could only be detected in 2 out of several blood samples, these 2 were both from intravenously inoculated animals. In the present study, we found that in both experiments the groups with the highest degree of parasitaemia (measured as the area under the curve) lost significantly more weight than did the other groups, indicating an association between the degree of parasitaemia and severity of murine neosporosis.
The model used in the present study was suitable to demonstrate reduced parasitaemia in immunized mice. However, for evaluation of vaccine efficiency it would be ideal to have a more sensitive method to detect the minimum level of parasitaemia that results in clinical disease. For example, parasites were only detected in a few samples from the mice inoculated with the lowest number of parasites, although several of them developed symptoms typical of neosporosis. The detection limit for the real-time PCR was 0·008 pg N. caninum DNA, which is at the same level as for other similar assays (Collantes-Fernández et al. Reference Collantes-Fernández, Zaballos, Álvarez-Garcia and Ortega-Mora2002). This corresponds to approximately 0·1 genome equivalent and, since the DNA from each blood sample was eluted in 100 μl and 1–5 μl of that used for the analysis, this means that a blood sample must contain 2 to 10 tachyzoites in order to give a positive reaction. The probability of detecting parasites could be increased by analysing larger volumes of blood or by more frequent sampling, but that is obviously difficult in the mouse model and would require a larger number of experimental animals. Nevertheless, real-time PCR is a useful method to detect and quantify parasitaemia in both experimentally and naturally infected animals (Collantes-Fernández et al. Reference Collantes-Fernández, López-Pérez, Álvarez-Garcia and Ortega-Mora2006; Ferre et al. Reference Ferre, Aduriz, Del-Pozo, Regidor-Cerrillo, Atxaerandio, Collantes-Fernández, Hurtado, Ugarte-Garagalza and Ortega-Mora2005; Okeoma et al. Reference Okeoma, Stowell, Williamson and Pomroy2005).
To conclude, real-time PCR was used successfully to quantify the level of parasitaemia in mice infected with N. caninum. The level of parasitaemia appeared to correlate with disease severity and cerebral parasite load, and it was shown that mice immunized with recombinant NcSRS2-iscoms had reduced parasitaemia after challenge infection compared to non-immunized controls. Since the degree of parasitaemia is likely to be an important factor for the outcome of an infection, detection and quantification of N. caninum DNA in the blood by real-time PCR constitutes an important parameter for evaluation of vaccines and drugs against the parasite.
We are grateful to Eva-Britt Jakubek for excellent assistance with laboratory work; to Stefan Ståhl, Maria Wikman and Mikaela Friedman for the recombinant proteins; and to David Morrison for valuable advice on statistical analysis. The study was financed by the Agria Research Foundation; and S. Pinitkiatisakul was supported by a scholarship from the Royal Thai Government.