Introduction
Chronic fatigue syndrome (CFS) is a complex and medically unexplained illness that is characterized by severe and prolonged disabling fatigue and a combination of symptoms, including sleep disturbance, musculoskeletal pain and impairment in concentration and short-term memory (Fukuda et al. Reference Fukuda, Straus, Hickie, Sharpe, Dobbins and Komaroff1994). Fatigue is the central symptom of CFS and yet very little research has been devoted to it. Previous research in CFS emphasizes the role of the central nervous system in the subjective perception of fatigue (Kent-Braun et al. Reference Kent-Braun, Sharma, Weiner, Massie and Miller1993; Georgiades et al. Reference Georgiades, Behan, Kilduff, Hadjicharalambous, Mackie, Wilson, Ward and Pitsiladis2003). This is not surprising considering the effect that factors such as emotion, attention and motivation can have on fatigue perception (St Clair Gibson et al. Reference St Clair Gibson, Baden, Lambert, Lambert, Harley, Hampson, Russell and Noakes2003).
Like chronic pain sufferers, CFS patients have been shown to avoid physical activities (van der Werf et al. Reference van der Werf, Prins, Vercoulen, van der Meer and Bleijenberg2000) and to score highly on the Tampa Scale of Kinesiophobia, or phobia of physical movement and activity (Silver et al. Reference Silver, Haeney, Vijayadurai, Wilks, Pattrick and Main2002). CFS patients believe that physical activity will increase their fatigue, leading to avoidance in a similar way that phobia-related cognitions lead to avoidance in phobic patients (Deale et al. Reference Deale, Chalder and Wessely1998; Chalder et al. Reference Chalder, Cleare, Wessely, Mostofsky and Barlow2000). It has also been shown that exercise lowers the pain threshold in CFS patients (Whiteside et al. Reference Whiteside, Hansen and Chaudhuri2004), probably making any physical sensation a painful experience. If this is the case, it is not difficult to understand that for most CFS patients physical activity can be a highly demanding and emotional situation, leading to fear and avoidance. In fact, the cognitive-behavioural model of CFS highlights the importance of fear and avoidance in the aetiology and/or maintenance of the disorder (Chalder et al. Reference Chalder, Cleare, Wessely, Mostofsky and Barlow2000) and cognitive-behavioural therapy (CBT) techniques aimed at tackling these symptoms are effective in reducing fatigue (Whiting et al. Reference Whiting, Bagna, Sowden, Cornell, Mulrow and Ramírez2001). Moreover, anxiety is a major co-morbidity in CFS (e.g. Fischler et al. Reference Fischler, Cluydts, De Gucht, Kaufman and DeMeirleir1997) and a high proportion of patients with anxiety disorders complain of fatigue (e.g. Angst & Dobler-Mikola, Reference Angst and Dobler-Mikola1985), reinforcing the link between CFS and anxiety disorders.
Little is known about the neural correlates of fatigue. Recent neuroimaging studies have compared brain responses to cognitively challenging tasks between CFS patients and healthy controls (Lange et al. Reference Lange, Steffener, Cook, Bly, Christodoulou, Liu, Deluca and Natelson2005; Caseras et al. Reference Caseras, Mataix-Cols, Giampietro, Rimes, Brammer, Zelaya, Chalder and Godfrey2006; Cook et al. Reference Cook, O'Connor, Lange and Steffener2007) but only one of these studies correlated subjective fatigue scores with brain activity during a working memory task (Cook et al. Reference Cook, O'Connor, Lange and Steffener2007). To our knowledge, no previous studies have used in vivo functional neuroimaging techniques to study brain activation during the experimental provocation of imagined physical fatigue in CFS. Symptom provocation is a useful research paradigm because it allows the testing of important questions that cannot be answered if the patients are asymptomatic. It has proven invaluable in neuroimaging studies of a variety of problems such as obsessive–compulsive disorder (Mataix-Cols et al. Reference Mataix-Cols, Wooderson, Lawrence, Brammer, Speckens and Phillips2004) or depression (Beauregard et al. Reference Beauregard, Paquette and Levesque2006). The current functional magnetic resonance imaging (fMRI) study used a novel fatigue provocation procedure to examine the neurophysiological basis of the experience of imaginal fatigue in healthy volunteers and in CFS patients. Because fatigue is often accompanied by negative emotional states, we also included an anxiety-provoking condition to control for any non-specific emotional effects on brain activation. We predicted that, compared to healthy controls, CFS patients would show enhanced neural responses in brain regions implicated in the representation of pain and internal somatic states (i.e. insular cortex, anterior cingulate gyrus, somatosensory cortex, posterior parietal cortex). In addition, we expected higher activations in limbic and paralimbic regions in CFS patients compared with controls, consistent with the accompanying negative affect during the provocation of fatigue.
Method
Participants
Thirteen right-handed CFS patients (eight women; age range 22–45 years) and 12 right-handed healthy controls (eight women; age range 24–45 years) were included in the study. The CFS patients were recruited between February and October 2005 from the CFS Research and Treatment Units of King's College London (n=12) and St Bartholomew's Hospital (n=1), and fulfilled strict Centers for Disease Control and Prevention (CDC) criteria for CFS (Fukuda et al. Reference Fukuda, Straus, Hickie, Sharpe, Dobbins and Komaroff1994). The patients were referred by their general practitioner (GP) to the CFS Units with a suspected diagnosis of CFS. At the CFS Units a physician conducted a complete clinical interview and reviewed the results of the required tests to exclude other conditions, before accepting the diagnosis of CFS as valid. Finally, a clinical psychologist independently confirmed the diagnosis using a checklist of the CDC criteria.
Control participants were recruited by advertisement and included staff at the Institute of Psychiatry and members of the wider local community. Exclusion criteria were present or past history of CFS (controls only) or any psychiatric disorder, history of brain injury, claustrophobia, suspected pregnancy, presence of any metallic implants and regular physical exercise. We selected controls with a low to medium level of physical fitness (i.e. those reporting practising sports ‘almost never’ or ‘once a month or less’) to make them as comparable as possible to the CFS group.
Two participants (one control and one patient) reported not being able to successfully complete the imagination task and were therefore excluded from the analysis. The final sample included 12 patients and 11 controls.
The study was approved by the ethics committees of the South London and Maudsley National Health Service (NHS) Trust and St Bartholomew's Hospital. All individuals gave written informed consent to participate.
Measures
After confirming the presence of CFS, an experienced clinician administered the Mini International Neuropsychiatric Interview (MINI; Sheehan et al. Reference Sheehan, Lecrubier, Sheehan, Amorim, Janavs, Weiller, Hergueta, Barker and Dunbar1998) to rule out the presence of major psychiatric co-morbidity. All participants completed the Chalder Fatigue Scale (ChFS; Chalder et al. Reference Chalder, Berelowitz, Pawlikowska, Watts, Wessely, Wright and Walalce1993), the Physical Functioning Scale from the Short Form Health Survey SF-36 (Ware & Sherbourne, Reference Ware and Sherbourne1992), the Work and Social Adjustment Scale (WSAS; Mundt et al. Reference Mundt, Marks, Greist and Shear2002; Mataix-Cols et al. Reference Mataix-Cols, Cowley, Hankins, Schneider, Bachofen, Kenwright, Gega, Cameron and Marks2005) and the Hospital Anxiety and Depression Scale (HADS; Zigmond & Snaith, Reference Zigmond and Snaith1983).
Procedure
Fatigue and anxiety provocation task
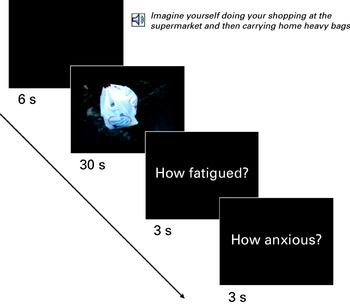
Subjects were requested to imagine themselves in different situations while viewing video-clips previously selected to induce fatigue, anxiety or relaxation (see Fig. 1). To enhance the participants' experience, the video-clips were filmed from a first person's point of view and were back-projected onto a screen that could be seen through a mirror mounted on the head-coil.
Design of the study.

Before each video-clip, participants heard a pre-recorded voice file through high-fidelity pneumatic headphones telling them which situation they were required to imagine. For example, the instruction ‘imagine yourself doing your shopping at the supermarket and then carrying home heavy bags’ preceded a video-clip showing a person carrying heavy shopping bags. Similarly, for the anxiety-provoking videos, the instruction ‘imagine yourself standing on the edge of a high cliff and looking over the edge’ was followed by a video-clip showing the feet of a person on the edge of a cliff. Finally, for the relaxation videos (the control condition), the instruction ‘imagine yourself sitting in a comfy armchair drinking a nice cup of tea’ was followed by a clip of somebody holding a cup of tea with her feet up. After each video, the participants were requested to produce two separate subjective ratings of fatigue (on a visual analogue scale of 0–10, where 0=no fatigue and 10=extreme fatigue) and anxiety (on a visual analogue scale of 0–10, where 0=no anxiety and 10=extreme anxiety) after imagining themselves in each situation (Fig. 1). All participants received a training session prior to scanning to ensure that they understood the task.
A pilot study involving seven CFS patients and four healthy controls (not included in this study) led to the selection of the final four fatigue-inducing, four anxiety-inducing and eight relaxing videos among an originally larger pool of video-clips. Fatigue and Anxiety videos were 30 s long and Relax videos 16 s long. The videos were separated by 12 s: 6 s of a black screen preceded each video during which time the pre-recorded voice was played, and 6 s following each video during which time the subjects were requested to rate their fatigue and anxiety (3 s per rating). The relaxation videos were always interspersed between the fatigue and anxiety videos to prevent any carry-over effects. Two different order playlists were created and used randomly: Relax/Fatigue/Relax/Anxiety (four times) and Relax/Anxiety/Relax/Fatigue (four times). The specific video-clip to be played on each occasion was chosen randomly. A random half of the participants saw one playlist, while the other half saw the other.
Image acquisition
Single-shot, gradient echo, echo-planar imaging was used to acquire 184 T2*-weighted image volumes on a 1.5 T GE Excite MRI scanner (General Electric, Milwaukee, WI, USA) at the Centre for Neuroimaging Sciences of the Institute of Psychiatry, King's College London. For each volume, 25 non-contiguous axial planes parallel to the inter-commissural plane were collected with the following parameters: TR=2000 ms, TE=40 ms, slice thickness=5 mm, slice skip=0.5 mm, field of view (FOV)=24 cm, image acquisition matrix 64×64, yielding an in-plane spatial resolution of 3.75 mm. Four dummy acquisitions were also made at the beginning of each run to set the longitudinal magnetization into steady state. The start of the task was triggered by the scanner immediately at the end of the dummy acquisition.
Fifteen whole-brain volumes were acquired during the fatigue- and anxiety-inducing videos, and eight volumes during the relaxing videos. During the 6 s of verbal instructions preceding each video, three ‘dummy-volumes’ were excited using the same radio-frequency envelope and gradient slice selection parameter, with the same repetition time of 2 s to allow magnetization to reach an equilibrium amplitude prior to the next period of data acquisition. The frequency-encoding gradient was turned off during this period to minimize acoustic noise and ensure that the instructions were heard clearly by the subjects. After each video a 6-s period of silence was introduced to help the experimenter to hear the ratings of fatigue and anxiety reported by the participants. The three dummy-volumes before and after each video were modelled in the analyses and treated as a nuisance variable.
To facilitate co-registration of the fMRI data in standard space, we also acquired during each session a 43-slice, high-resolution echo planar image of the whole brain in the same inter-commissural plane with the following parameters: TR=3000 ms, TE=40 ms, slice thickness=3 mm, slice skip 0.3 mm, NEX=8, image acquisition matrix 128×128, yielding an in-plane spatial resolution of 1.875×1.875 mm.
Data analysis
Age, years of education and clinical measures were compared between groups by means of Student's t tests. The association between gender and group was calculated by means of a χ2 statistic in a 2×2 contingency table. The subjective fatigue and anxiety scores were analysed by means of separate ANOVAs including a between-participants factor – Group (control, CFS), and a within-participants factor – Situation (Relax, Fatigue, Anxiety).
fMRI data analysis
The fMRI data were analysed with software developed at the Institute of Psychiatry (XBAM), using a non-parametric approach to minimize assumptions. Data were first corrected for subject motion (Bullmore et al. Reference Bullmore, Brammer, Rabe-Hesketh, Curtis, Morris, Williams, Sharma and McGuire1999a) and then smoothed using a Gaussian filter [full width at half maximum (FWHM) 7.2 mm] chosen to improve signal-to-noise ratio over the spatial neighbourhood of each voxel. Responses to the experimental paradigms were then detected by time-series analysis using a linear model in which each component of the experimental design was convolved separately with two gamma variate functions (peak responses at 4 s and 8 s respectively) to permit variability in the haemodynamic delay. The method of Friman et al. (Reference Friman, Borga, Lundberg and Knutsson2003) was used to constrain model fits to those deemed physiologically plausible. Following computation of the model fit, a goodness-of-fit statistic was computed. This consisted of the ratio of the sum of squares of deviations from the mean image intensity due to the model (over the whole time-series) to the sum of squares of deviations due to the residuals (SSQratio). This addresses the problem inherent in the use of the F statistic that the residual degrees of freedom are often unknown in fMRI time-series because of the presence of coloured noise in the signal. Following computation of the observed SSQratio at each voxel, the data were permuted by the wavelet-based method described and characterized extensively in Bullmore et al. (Reference Bullmore, Long, Suckling, Fadili, Calvert, Zelaya, Carpenter and Brammer2001), which permits the data-driven calculation of the null distribution of SSQratios under the assumption of no experimentally determined response. This distribution can then be used to threshold the activation maps at any desired type I error rate. In addition to the SSQratio, the percentage blood oxygen level dependent (BOLD) change was also calculated from the model fit at each voxel.
The detection of activated regions was extended from voxel to cluster level using the method described in detail by Bullmore et al. (Reference Bullmore, Long, Suckling, Fadili, Calvert, Zelaya, Carpenter and Brammer2001). The observed and randomized SSQratio data for each individual were transformed into standard space (see Talairach & Tournoux, Reference Talairach and Tournoux1988) and group maps of activated regions were computed using the median observed and randomized SSQratio data as described by Brammer et al. (Reference Brammer, Bullmore, Simmons, Williams, Grasby, Howard, Woodruff and Rabe-Hesketh1997). Permutation methods and median statistics were used to allow exact computation of p values with minimal assumptions and the minimization of outlier effects. The hierarchical method of analysis used above also allows separate treatment of intra- and inter-individual variance. After extension of inference from voxel to cluster level (Bullmore et al. Reference Bullmore, Brammer, Rabe-Hesketh, Curtis, Morris, Williams, Sharma and McGuire1999b), the resulting cluster maps were thresholded to give <1 expected type I error cluster per whole brain volume to make interpretation of maps as intuitive as possible.
Between-group comparisons
For each level of the task, comparison of responses between groups was performed by fitting the data at each intra-cerebral voxel at which all subjects have non-zero data using a linear model of the type Y=a+bX+e, where Y is the vector of BOLD effect sizes for each individual, X is the contrast matrix for the particular intergroup contrasts required, a is the mean effect across all individuals in the various groups, b is the computed group difference and e is a vector of residual errors. The model is fitted by minimizing the sum of absolute deviations rather than the sums of squares to reduce outlier effects. The null distribution of b is computed by permuting data between groups (assuming the null hypothesis of no effect of group membership) and refitting the above model 50 times at each voxel and combining the data over all intra-cerebral voxels. Group difference maps are at any desired voxel or the cluster-wise type I error rate can then be computed by appropriate thresholding of this null distribution.
Results
Demographic and clinical measures
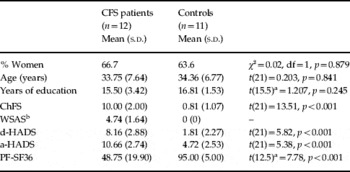
CFS patients and controls did not differ in terms of age, sex distribution or years of education. However, the patients' scores on all the clinical measures were within the severe range and were significantly higher than those of the controls (Table 1).
Comparison between CFS patients and controls on demographic and clinical variables

CFS, Chronic fatigue syndrome; s.d., standard deviation; df, degrees of freedom; ChFS, Chalder Fatigue Scale; WSAS, Work and Social Adjustment Scale; d-HADS, depression scale from the Hospital Anxiety and Depression Scale; a-HADS, anxiety scale from the Hospital Anxiety and Depression Scale; PF-SF36, Physical Functioning scale from the 36-item Short Form Health Survey.
a Degrees of freedom were corrected after Levene's test.
b Statistics were not computed because all the controls scored 0 on this scale.
Success of the fatigue provocation task
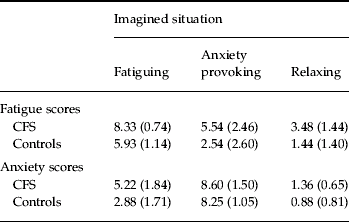
Regarding subjective fatigue scores, both patients and controls rated the fatigue-provoking situations as more fatiguing than anxiety-provoking situations, and both were rated as more fatiguing than the relaxing situations [Situation F(2, 42)=56.14, p<0.001]. In all three situations, patients reported higher levels of fatigue than controls [Group F(1, 21)=22.26, p<0.001]. The Situation×Group interaction was not significant [F(2, 42)=0.579, p>0.1] (Table 2).
Mean and standard deviations of the fatigue and anxiety scores reported by chronic fatigue syndrome (CFS) patients and controls after each type of imagined situation
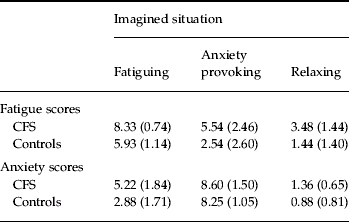
Analysis of the subjective anxiety scores revealed a slightly different picture. Again, both main effects Group [F(1, 21)=19.26, p<0.05] and Situation [F(2, 42)=230.99, p<0.001] were significant. However, they were subjected to a significant Situation×Group interaction [F(2, 42)=5.31, p<0.01]. Pairwise comparisons revealed no differences in levels of anxiety between patients and controls when presented with relaxing- and anxiety-provoking situations (p>0.1), but patients experienced higher levels of anxiety during the fatiguing situations [t(21)=3.15, p<0.005]. Both patients and controls reported being more anxious during the anxiety-provoking situations than the fatiguing situations, both being more anxiety provoking than the relaxing situations [the smaller test was t(10)=4.89, p<0.005] (Table 2).
fMRI results
The BOLD responses associated with the fatiguing and anxiety-provoking situations were calculated using the relaxing videos as the contrast condition.
Fatiguing videos
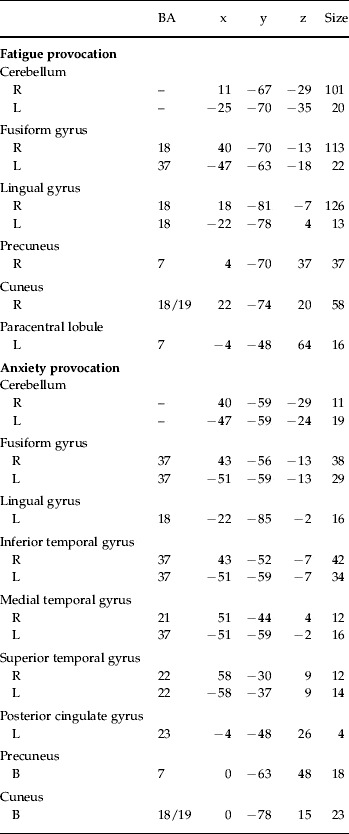
Taking the 23 participants together, the fatigue>relaxation contrast produced a large significant cluster with its peak in the fusiform gyrus, which included most of the occipito-parietal cortex, extending towards the cerebellum (1183 voxels; peak at x=47, y=−63, z=−13; p=0.0009) (see Table 3 for a breakdown of this cluster).
Brain areas with significant blood oxygen level dependent (BOLD) response resulting from the contrasts Fatigue>Relaxation and Anxiety>Relaxation, including the whole sample

BA, Brodmann area; R, right; B, bilateral; L, left.
Only the clusters with the largest number of voxels within each region are reported. The Talairach coordinates correspond to the most activated voxel in each cluster.
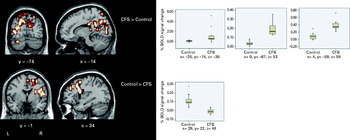
When comparing BOLD responses during the fatiguing situations between CFS patients and controls, the former showed greater activation than controls in a cluster with its peak in the precuneus [Brodmann area (BA) 7; 425 voxels; peak at x=0, y=−67, z=53; p=0.00003] but extending towards the bilateral posterior cingulate cortex (BA 23/29/31), left thalamus, the left fusiform (BA 19) and lingual gyri (BA 18); a second cluster in the right precuneus and cuneus (BA 7; 32 voxels; peak at x=4, y=−59, z=59; p=0.0008); and a third cluster in the left cerebellum (7 voxels; peak at x=−25, y=−74, z=−35; p=0.0049) (Fig. 2).
Differences in activation between chronic fatigue syndrome (CFS) patients and controls during the fatigue-inducing scenarios. CFS patients showed greater activation than controls in the cerebellum (peak at x=−25, y=−74, z=−35; 7 voxels; p=0.0049), bilateral parietal cortex [peak at x=0, y=−67, z=53; Brodmann area (BA) 7; 425 voxels; p=0.00003] and right precuneus (peak at x=4, y=−59, z=59; BA 7; 32 voxels; p=0.0008). Controls showed greater activation in the right dorsolateral prefrontal cortex (peak at x=29, y=22, z=48; BA 8; 186 voxels; p=0.0002). Each box plot shows the median (horizontal line), quartiles (box) and extreme values (whiskers). This figure is for display purposes only and indicates the most representative slices. L, left; R, right.

The healthy controls showed greater activation than the CFS patients in a cluster with its peak at the right superior dorsolateral prefrontal cortex (BA 8; 186 voxels; peak at x=29, y=22, z=48; p=0.0002), extending towards the right middle frontal gyrus (BA 9), the medial parts of the frontal gyrus (BA 6), the right insula/superior temporal gyrus (BA 22/42), and the right precentral gyrus (BA 4) (Fig. 2).
Anxiety-provoking videos
In the patients and controls combined, the anxiety>relaxation contrast revealed a significant cluster with its peak in the left parietal cortex (BA 7; 297 voxels, peak at x=−4, y=−52, z=64, p=0.005); a second cluster with its peak at the fusiform gyrus (BA 37)/cerebellum (220 voxels, peak at x=−51, y=−59, z=−18; p=0.005); and a similar right-sided cluster with its peak at the right inferior temporal gyrus (BA 37; 217 voxels, peak at x=43, y=−52, z=−7; p=0.005) (see Table 3 for a breakdown of these clusters).
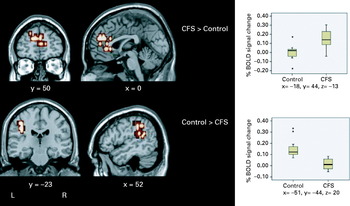
CFS patients showed greater activation than controls in a cluster (227 voxels; peak at x=−18, y=44, z=−13; p=0.0002) occupying the bilateral ventral prefrontal cortex (BA 10/11/47) and medial prefrontal cortex including the anterior cingulate (BA 9/10/24/32) (Fig. 3). However, controls showed greater activation than CFS patients in a cluster (67 voxels; peak at x=−51, y=−44, z=20; p=0.001) occupying the left superior temporal gyri (BA 22/41/42) and extending towards the inferior parietal/postcentral gyrus (BA 40) and precentral gyrus (BA 4).
Differences in activation between chronic fatigue syndrome (CFS) patients and controls during the anxiety-inducing scenarios. CFS patients showed greater activation than controls in a cluster with its peak in the left ventral prefrontal cortex [peak at x=−18, y=44, z=−13; Brodmann area (BA) 11, 227 voxels; p=0.0002]. Controls showed greater activation than CFS patients in a cluster with its peak in the superior temporal lobe/lateral sulcus (peak at x=−51, y=−44, z=20; BA 22/42; 67 voxels; p=0.001). Each box plot shows the median (horizontal line), quartiles (box) and extreme values (whiskers). This figure is for display purposes only and indicates the most representative slices. L, left; R, right.

Within-group analyses (differences between video contents)
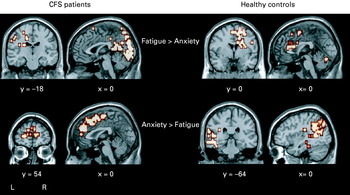
In the CFS group (n=12), the fatigue-provoking videos resulted in significantly greater BOLD responses than the anxiety-provoking videos in the cerebellum and occipito-parietal regions bilaterally (BA 7, 17, 18, 19) extending towards the dorsal and posterior parts of the cingulate gyrus bilaterally (BA 24, 29, 31), the left hippocampal gyrus (BA 36) and the left caudate nucleus (Fig. 4). The opposite contrast yielded activation in the bilateral anterior cingulate cortex (BA 24, 32) and medial parts of the frontal cortex (BA 6, 10), in the inferior frontal gyrus [BA 44, 45 (right) and 47 (left)] and superior temporal gyrus (BA 38) extending towards the bilateral insula, and towards the right precentral gyrus (BA 6) and basal ganglia (Fig. 4).
Within-group comparisons of the activations obtained in the fatigue- and anxiety-inducing scenarios. In the chronic fatigue syndrome (CFS) group, the fatigue>anxiety contrast produced greater activation in the cerebellum and occipito-parietal regions extending towards the posterior cingulate gyrus. The anxiety>fatigue contrast yielded greater activation in the anterior cingulate cortex and medial parts of the frontal cortex extending towards the insula, the right precentral gyrus and the basal ganglia. In the control group, the fatigue>anxiety contrast produced greater activations in the dorsolateral and medial prefrontal cortex, anterior cingulate gyrus, insula and caudate nucleus. The anxiety>fatigue contrast produced greater activity in the temporal and parietal lobes and visual areas. This figure is for display purposes only and indicates the most representative slices. L, left; R, right.

In the healthy control group, the fatigue-provoking videos produced greater BOLD responses than the anxiety-provoking videos in the right dorsolateral (BA 9, 46) and bilateral medial (BA 6, 10) prefrontal cortex extending towards the anterior cingulate (BA 24, 32), right insula and right caudate nucleus (Fig. 4). In addition, the cerebellum and right occipital cortex (BA 18, 19) including the fusiform gyrus (BA 37) bilaterally were significantly more activated in the fatigue- than the anxiety-provoking videos. The anxiety-provoking videos produced greater activity than the fatiguing ones in the left temporal lobe (BA 20, 37, 39), extending towards parietal (BA 7, 19) and visual areas (BA 18) (Fig. 4).
Discussion
To our knowledge, this is the first study to examine the neural correlates of experimentally induced feelings of fatigue in CFS and healthy controls. We used a novel symptom provocation procedure consisting of the presentation of audio instructions and fatigue-inducing videos designed to mimic real-life situations. We also included a non-fatiguing anxiety-provoking condition in the experiment to control for the non-specific effects of anxiety.
Pilot work and analysis of the current data confirmed that the symptom provocation procedure was effective. Fatigue-inducing videos yielded higher subjective fatigue scores than anxiety-inducing videos and, conversely, anxiety-inducing videos yielded higher subjective anxiety scores than fatigue-inducing videos. CFS patients found all types of videos more fatigue inducing than healthy controls. Patients and controls did not differ in their subjective ratings of anxiety during the anxiety-provoking scenarios, but, interestingly, CFS patients experienced higher rates of anxiety during the fatiguing scenarios, suggesting that feelings of fatigue and anxiety are intimately linked in CFS.
Turning to the fMRI results, in patients and controls combined, the provocation of imaginal fatigue resulted in large widespread activations in posterior brain regions, mainly occipital and parietal cortices. Between-group analyses revealed that CFS patients showed significantly greater activation in these brain regions than healthy controls. In addition, CFS patients also showed greater activations in the posterior cingulate cortex. Within-group analyses showed that CFS patients activated these same regions significantly more during the fatiguing than the anxiety-provoking videos. Similar brain regions correlated with subjective fatigue in a recent study that used a cognitively challenging task (Cook et al. Reference Cook, O'Connor, Lange and Steffener2007). These brain regions have consistently been implicated in the processing of emotional stimuli and the retrieval of emotional memories (Nielsen et al. Reference Nielsen, Balslev and Hansen2005; Garret & Maddock, Reference Garret and Maddock2006; Pourtois et al. Reference Pourtois, Schwartz, Seghier, Lazeyras and Vuilleumier2006; Smith et al. Reference Smith, Stephan, Rugg and Dolan2006) using a variety of experimental paradigms. The results seem to suggest that the provocation of fatigue in patients with CFS is associated with activation in brain regions implicated in emotion processing and the retrieval of emotional memories. This is consistent with the cognitive-behavioural model of CSF, which proposes that fear and avoidance are key maintaining factors for the disorder (Chalder et al. Reference Chalder, Cleare, Wessely, Mostofsky and Barlow2000). It could be argued that patients remember feeling severely fatigued in the past and that they are anxious about feeling so fatigued again. It is the fear of feeling fatigue that can lead them to avoid activity.
During the provocation of fatigue, the CFS group also showed reduced activations in dorsolateral and dorsomedial prefrontal regions (BA 6/8/9), compared with the healthy controls. These prefrontal cortical regions form part of a network that has been associated with inhibitory processes and emotion regulation (Ochsner et al. Reference Ochsner, Bunge, Gross and Gabrieli2002; Phillips et al. Reference Phillips, Drevets, Rauch and Lane2003; Phan et al. Reference Phan, Fitzgerald, Nathan, Moore, Uhde and Tancer2005). Our results suggest that CFS patients may experience difficulties down-regulating or suppressing the emotional states associated with feelings of fatigue.
These results do not support our initial hypothesis that CFS patients would show exaggerated neural responses in brain areas previously associated with pain perception and conscious interoception (i.e. anterior cingulate, insula and somatosensory cortex). In fact, the reverse was true; controls showed greater activations than CFS patients in these regions. The reasons for this are unclear but it could be speculated that during the imaginal fatigue condition, the patients' attentional resources are primarily allocated to the highly salient stimuli at the expense of a conscious processing of interoceptive information (Critchley, Reference Critchley2004). It is also plausible that this may lead to CFS patients misinterpreting anxiety or stress as fatigue or the failure to recognize that the fatigue is a symptom of the underlying anxiety/stress response. This misinterpretation could be related to difficulties in identifying and/or accepting emotions (Creswell & Chalder, Reference Creswell and Chalder2001).
Analysis of the anxiety-provoking condition revealed that CFS patients showed increased activations in both ventral (BA 10/11/47) and dorsal (BA 9/10/24/32) prefrontal regions compared with healthy controls. The ventral prefrontal regions have been implicated in numerous studies using a variety of emotional paradigms (see Phan et al. Reference Phan, Wager, Taylor and Liberzon2002 for a meta-analysis), whereas the dorsal prefrontal regions have been implicated in emotional regulation (Ochsner et al. Reference Ochsner, Bunge, Gross and Gabrieli2002; Phillips et al. Reference Phillips, Drevets, Rauch and Lane2003; Phan et al. Reference Phan, Fitzgerald, Nathan, Moore, Uhde and Tancer2005). Within-group analyses revealed that these regions were significantly more activated in the anxiety- than the fatigue-provoking condition among CFS patients and that the opposite was true in the control group. These results seem to suggest more general emotion-processing alterations in CFS that are not exclusively associated with the provocation of fatigue. This would be consistent with recent reports that have demonstrated that early adverse experience, stress and emotional instability are important risk factors for the development of the disorder (Heim et al. Reference Heim, Wagner, Maloney, Papanicolaou, Solomon, Jones, Unger and Reeves2006; Kato et al. Reference Kato, Sullivan, Evengard and Pedersen2006). It is possible that although CFS patients fail to down-regulate their emotional responses to fatiguing situations (as discussed above), they may tend to over-regulate their emotional responses to more general emotional stimuli. Indeed, a recent study has shown that engaging in emotional processing during therapy was significantly associated with a good therapeutic outcome in CFS (Godfrey et al. Reference Godfrey, Chalder, Ridsdale, Seed and Ogden2007). This hypothesis would be consistent with a previous study that showed that patients with CFS tend to suppress their emotional responses in general (Creswell & Chalder, Reference Creswell and Chalder2001).
The main limitation of the current investigation was its relatively small sample. However, the patients were well characterized, unmedicated, and free of any co-morbid psychiatric disorder. Although we used robust non-parametric methods of statistical analysis that minimize the probability of false-positive results, the results require replication in a larger patient sample. The diagnostic specificity of the findings remains to be established by comparing CFS with other emotional disorders. It is possible that CFS patients could find the whole scanning process more fatiguing than controls. This is a common problem in many neuroimaging studies of emotional disorders. For example, the scanning process is likely to be more anxiety provoking for anxious patients than for controls. Future research using absolute rather than relative measures of brain activity is warranted to control for this potential problem. Finally, the temporal stability of the findings will require testing using repeat administrations of this paradigm before and after treatment.
Acknowledgements
This research was funded by grants from the South London and Maudsley NHS Trust (Drs Godfrey and Mataix-Cols), the Spanish Ministry of Education and Science (Dr X. Caseras, grant no. EX-2004-1137), and the Get Well Club, Surrey. Professor Peter White and Giselle Whiters helped with the recruitment of one participant at St Bartholomew's Hospital.
Declaration of Interest
None.