Implications
Intensive selection for high milk yield in dairy cows has been at the cost of reduced fertility and reduced expression of oestrous behaviour, the genomic regulation of which is largely unknown. Identifying and studying genes associated with oestrous behaviour that are expressed in the bovine anterior pituitary and brain areas at different phases of the oestrous cycle will help to improve our understanding of the genomic regulation of oestrous behaviour expression. This knowledge may lead to better management strategies and tools to improve or monitor reproductive performance in bovines.
Introduction
Several decades of intensive selection for high milk yield in dairy cows has raised production levels substantially, but at the cost of reduced fertility as the unfavourable genetic correlation between milk yield and fertility traits used to be ignored (Royal et al., Reference Royal, Darwash, Flint, Webb, Woolliams and Lamming2000; Roxstrom et al., Reference Roxstrom, Strandberg, Berglund, Emanuelson and Philipsson2001). The expression of oestrous behaviour (heat), a key fertility trait that marks the fertile period in cows, has decreased both in duration and intensity over generations of cows selected for high milk yield (Lopez et al., Reference Lopez, Satter and Wiltbank2004). Short heat periods and the absence of clear behavioural signs of heat make farmers fail to detect heat or misjudge the optimum time of insemination of their cows, resulting in financial losses because of prolonged interval from calving to first insemination, reduced conception rates and increased calving intervals.
Some key hormones that regulate oestrous cycle in mammals are gonadotropin-releasing hormone (GnRH) produced in the hypothalamus; follicle-stimulating hormone (FSH) and luteinizing hormone (LH) in the anterior pituitary; oestrogen and progesterone in the ovaries; and prostaglandin in the uterus. These hormones may influence the expression of oestrous behaviour by targeting specific brain areas, directly or indirectly. For example, oestrogen dependent gene transcription in the hypothalamus and midbrain establishes the neural circuitry required for lordosis behaviour in female rats (Pfaff, Reference Pfaff2005). The hormonal regulation of oestrous cycle is well studied and several hormone-driven mechanisms in the brain that influence the mammalian sexual behaviour are known (Pfaff, Reference Pfaff2005), but specific knowledge on the genomic regulation of oestrous behaviour in cows is lacking. Understanding the genomic regulation of oestrous behaviour may help to develop better management strategies and tools to improve or monitor reproductive performance in bovines (Veerkamp and Beerda, Reference Veerkamp and Beerda2007).
Conventionally, DNA microarray technology is used to identify differentially expressed genes between groups of individuals belonging to contrasting classes of a phenotypic trait of interest. However, when the trait of interest is quantitative (e.g. oestrous behaviour quantified as heat score), the grouping of individuals into qualitative classes, ignoring the continuous scale, is indistinct and dilutes the available information. In such cases, the association between gene expression and phenotypic trait is better analysed using the individual quantitative measurements (Reiner-Benaim et al., Reference Reiner-Benaim, Yekutieli, Letwin, Elmer, Lee, Kafkafi and Benjamini2007). Recent studies on microarray gene expression data have successfully linked genes to quantitative traits of interest by correlation, linear regression or complex regression models (Blalock et al., Reference Blalock, Geddes, Chen, Porter, Markesbery and Landfield2004; Jia and Xu, Reference Jia and Xu2005; Qu and Xu, Reference Qu and Xu2006; Jia et al., Reference Jia, Tang, Mercola and Xu2008). Some of these models have the added advantage that they account for non-linear relationships between gene expression and phenotypic trait that occur because of complex interactions among genes in regulatory networks. The Bayesian hierarchical mixed model developed by Jia et al. (Reference Jia, Tang, Mercola and Xu2008) fits linear as well as non linear associations between gene expression patterns and quantitative measures of a trait using orthogonal polynomials.
Here, the Bayesian hierarchical mixed model was used for the objective to identify and study those genes that were associated with oestrous behaviour among genes expressed in the bovine anterior pituitary, either at the start of oestrous cycle, or at the mid-cycle (around day 12 of cycle), or regardless of the phase of cycle.
Material and methods
Phenotypic data recording and tissue isolation
The current study is a part of an experiment which was originally set up to investigate differential gene expression in brain tissue samples of Holstein Friesian (HF) cows, which were either of a low or high genetic merit for fertility and which belonged to two different stages of oestrous cycle. However, here we focus on identifying genes whose expression profiles were associated with oestrous behaviour at the start or mid of oestrous cycle, or regardless of the phase. The associated gene lists thus identified were compared for similarities or differences. No tests were performed to identify genes that significantly differ in their level of expression between the groups of animals in different phases.
Twenty-eight healthy HF heifers were selected for this study, of which 14 belonged to a lower fertility group with estimated breeding values (EBVs) for fertility ranging between 93 and 97 whereas the remaining 14 belonged to a higher fertility group with values ranging between 101 and 103. The EBVs are expressed on a standardised scale with 100 as the base value and with a s.d. of 4 units for EBV with a reliability of 0.80. The base value of 100 corresponds to the average EBV of black and white HF cows born in the year 2000. The EBV for fertility was based on the traits: time to first insemination, percentage non-return within 56 days after first insemination and interval between calvings (NRS, 2009). The EBVs for fertility of the selected heifers were calculated using the EBVs for fertility of their sire (weighing factor 2) and their dam’s sire (weighing factor 1).
At least 4 weeks before their expected calving date, the experimental heifers were moved to a free stall barn with slatted concrete floor at the Waiboerhoeve research farm at Lelystad in the Netherlands and reared under identical conditions of feeding and management. The age of the heifers at calving varied between 22 and 30 months, with calving dates in the period from September 2006 to December 2006. After calving, the cows were observed daily for the signs of oestrous expression during two observation periods of 30 min each: one in the morning (after milking but before feeding) and one in the evening (after milking and feeding). Cows were kept in one group of animals of similar age, which over time ranged in size from 15 to 30 animals. At the start and end of the study, cows from the main herd were added to the experimental group so as to maintain a group size of at least 15 individuals. Oestrous behaviour was expressed as heat scores, with specific behaviours being weighted according to the scoring protocol described by Van Eerdenburg (Reference Van Eerdenburg2006): mucous vaginal discharge (three points), flehmen (three points), restlessness (five points), being mounted but not standing (ten points), sniffing the vulva of another cow (ten points), resting with chin on the back of another cow (fifteen points), mounting other cows, or attempting to do so (thirty-five points), mounting head side of other cows (forty-five points), standing heat (hundred points). Heat scores per 30 min observation bouts were calculated by adding up the recorded occurrence of each specific behaviour multiplied by its weight as per the scoring protocol described above. However, the recording of the occurrence of restlessness behaviour was limited to one per observation bout. From 30 days in milk (DIM) onwards, milk progesterone levels were assessed twice a week. Ovarian structure was evaluated by trans-rectal ultrasonography either performed on alternate days or daily during the week preceding expected oestrus. The time of oestrus was established on the basis of milk progesterone levels and trans-rectal ultrasonography to help determine the right moment of euthanizing cows and not miss those with possible silent heat. Cows in silent heat were awarded a heat score of 0. Cows were assumed to be in oestrus when the cumulative heat score from two consecutive observation periods exceeded 50 points. An average heat score value was calculated for each cow to quantify the degree to which it expressed oestrous behaviour (i.e. as a trait) based on its heat scores at oestrus observed during all consecutive oestrous cycles from 30 DIM onwards, excluding the heat score at oestrus on the day of sacrifice. All cows were euthanized in the period ranging between 77 and 139 DIM by intravenous injection of 20 ml of T61. They were sacrificed in a stress-free, quick and standardised way, between 8 and 11 am, in a room only a few metres away from their home section. Fourteen of the 28 cows were euthanized at the start of their oestrous cycle (hereafter indicated as day 0) and the remaining 14 were euthanized at mid-cycle around day 12 (hereafter indicated as day 12) when milk progesterone levels were high. Each group of 14 cows that were euthanized at a particular time point consisted of seven cows with high and seven with low-genetic merit for fertility. Within an hour of death, tissue samples from the anterior pituitary and brain areas, that is the hippocampus, amygdala, dorsal and ventral hypothalamus, were collected, snap-frozen in liquid nitrogen and stored at −70°C until the RNA isolation was made.
The study was approved by the Animal Care and Ethics Committee of the Animal Sciences Group of Wageningen University and Research Centre, Lelystad.
RNA isolation and microarray hybridisation
The procedure used for RNA isolation from all the separate brain samples collected was similar to that described by Niewold et al. (Reference Niewold, Veldhuizen, van der Meulen, Haagsman, de Wit, Smits, Tersteeg and Hulst2007) but without the sodium citrate/NaCl precipitation step. Bovine 24K oligonucleotide (70-mer) microarrays designed and produced by the Bovine Oligonucleotide Microarray Consortium (BOMC) (http://www.bovineoligo.org/) were used. A total of 56 arrays were prepared in a common reference design with the dye labels swapped between individual anterior pituitary samples and a reference sample consisting of equal proportions of RNA from the anterior pituitary, hippocampus, amygdala, dorsal hypothalamus and ventral hypothalamus of all 28 cows. Exactly 5 μg of RNA was used per labelling using the RNA MICROMAX TSA™ labelling and detection kit (Perkin-Elmer, Boston, MA, USA). Following hybridization, cover slips were removed after allowing a 5 min delay at room temperature followed by three washings of 15 min each in: 2 × SSC (saline sodium citrate) + 0.2% SDS (at 42°C), 2 × SSC (room temperature) and 0.2 × SSC (room temperature). The rest of the protocol conformed to that described by Niewold et al. (Reference Niewold, Veldhuizen, van der Meulen, Haagsman, de Wit, Smits, Tersteeg and Hulst2007). Part of the processed slides were scanned using ScanArray 5000 (Packard Biosciences, Billerica, MA, USA), part using ScanArray Express (Perkin-Elmer, Boston, MA, USA) and the remaining using GenePix 4200A (Molecular Devices, Sunnyvale, CA, USA), with identical settings. Image processing was performed using GenePix Pro 6 software. All processed images were visually inspected for proper data recording and any bad spots that remained undetected by the software were manually flagged.
Pre-processing of microarray data
LIMMA (linear models for microarray data) package (Smyth, Reference Smyth2005) within Bioconductor project (Gentleman et al., Reference Gentleman, Carey, Bates, Bolstad, Dettling, Dudoit, Ellis, Gautier, Ge, Gentry, Hornik, Hothorn, Huber, Iacus, Irizarry, Leisch, Li, Maechler, Rossini, Sawitzki, Smith, Smyth, Tierney, Yang and Zhang2004) of R statistical programming language (http://www.r-project.org/) was used for pre-processing the microarray data including microarray data quality checking. The quality of the array data was checked by means of several data visualisation plots such as image plots, MA-plots, density plots and box plots. The image plots of the background intensities for the two dyes showed that the background was inconsistent within and between arrays. Background correction was therefore required and was performed using the ‘normexp + offset’ method (Ritchie et al., Reference Ritchie, Silver, Oshlack, Holmes, Diyagama, Holloway and Smyth2007) available in LIMMA. This method always produces positive corrected values so that no spot information is lost. In addition, an offset of 50 was used to stabilise the variability of the log-ratios (M-values) as a function of intensity. Within array normalisation was performed using print tip loess method, which is a good method to correct for spatial effects and intensity dependent biases. To make the arrays comparable, between arrays normalisation was performed using quantile method, which equalizes the intensity distribution across all arrays. A comparison of the MA-plots and box plots on data before and after normalisation showed that the normalisation procedure followed had corrected intensity dependent biases and made the ranges of intensity distributions comparable across arrays. On the basis of observations of the above-mentioned plots, we concluded that the microarray data quality was good and that the background correction and array normalisation procedures followed were adequate. The M-values per probe of the dye-swap pairs for each individual were averaged (after reversing the sign of M-value for one of the dye channels) to obtain the gene expression data. As the gene expression data was generated using a two colour common reference design microarray experiment, the gene expression levels in the anterior pituitary were assessed relative to expression levels in reference tissue consisting of samples from the anterior pituitary and four brain areas as obtained during two phases of the oestrous cycle. This means that genes with negative M-values were lower expressed in the anterior pituitary than in the common reference while genes with positive M-values were higher expressed in the anterior pituitary than in the common reference.
Associating heat scores with gene expression data
The Bayesian hierarchical mixed model developed by Jia et al. (Reference Jia, Tang, Mercola and Xu2008) was used to associate quantitative phenotypes to expressed genes using orthogonal polynomials. In this model, the expression level of gene i (Yi) across N subjects, as a function of the phenotypic value of a quantitative trait, Z, is given by:

where  is the gene specific intercept for gene i, βi (Z ) is an arbitrary function describing the relationship between the gene expression of gene i and the phenotypic values and εi is the random error term with assumed normal distribution, N(0,σε 2). Using orthogonal polynomials to describe the functional relationships between the model parameters and Z, followed by a linear contrasting scheme to remove the mean expression (μ) of each gene (Qu and Xu, Reference Qu and Xu2006), the model becomes:

where p is the order of the orthogonal polynomial ( j ) and X is an N × p matrix denoting Z after transformation to its orthogonal polynomials. In the mixed model, the gene specific regression coefficient (βij) is assumed to be sampled from a mixture of two normal distributions: one with a very small variance, N(0,∂) and one with a larger variance, N(0,σj 2),where ∂ = 10−4 (a small positive number) and σj 2 is an unknown variance assigned to the jth polynomial. This approach used by Jia et al. (Reference Jia, Tang, Mercola and Xu2008) is based on a procedure called stochastic search variable selection developed by George and McCulloch (Reference George and McCulloch1993). The variable ηij = {0,1} is used to indicate whether βij is sampled from the distribution with the small variance in which case βij is approximating 0 or whether βij is sampled from the distribution with the large variance, in which case βij will have a non-trivial value and should be estimated from the data. Both variance components, σj 2 and σε 2 are estimated by borrowing information across all genes. Using the Markov Chain Monte Carlo simulation, the association status of gene i with the jth polynomial is determined based on the posterior mean of ηij. According to this association status, genes are clustered in 2p clusters. More details can be found in Jia et al. (Reference Jia, Tang, Mercola and Xu2008).
For the current study, we used the above mentioned algorithm of Jia et al. (Reference Jia, Tang, Mercola and Xu2008) coded in SAS® language, kindly provided by the authors. Average heat score was selected as the quantitative phenotype to associate with gene expression, as it was the most representative for the trait oestrous behaviour. This was determined in a principal component analysis where oestrous behaviour related parameters as collected over time were correlated, with heat scores showing the strongest loadings (B. Beerda, unpublished results). The interpretation of the results obtained in the association methodology used in this study differs from that for differential gene expression analysis in LIMMA where contrasting groups of individuals are compared against each other for significant differences in gene expression levels without considering its association with a quantitative trait.
The clustering program was run on SAS® software, Version 9.1 of the SAS® System for Windows. Gene expression was modelled as a function of average heat score transformed into third order polynomials, thereby clustering genes into eight binary based categories. The categories were represented as 000, 100, 010, 001, 110, 101, 011 and 111. Genes with no association in all three orders of the polynomial belong to cluster 000, those with a linear association alone belong to cluster 100, those with a linear and quadratic association belong to cluster 110 and so on. The algorithm was run for 10 000 iterations with a burn-in period of 5000 iterations. Trace plots of the estimated residual variance in consecutive iterations showed that the parameter stabilised within a narrow range at approximately 3000 iterations and therefore the selected burn-in period of 5000 iterations was sufficient. After the burn-in period, results of one iteration in 20 were saved, resulting in 250 samples used for calculating posterior means of each variable. The cut-off value for  for cluster assignment was set at 0.8 to limit the false discovery rate (FDR) of cluster assignment below 1% (Jia and Xu, Reference Jia and Xu2007).
The clustering program was run in three separate analyses (Table 1). To identify genes of which the expression in the bovine anterior pituitary at the start of oestrus was associated with oestrous behaviour (objective 1), we analysed gene expression data of day 0 cows and their average heat scores (analysis 1). Similarly, to identify genes of which the expression in the bovine anterior pituitary around mid cycle (dioestrus) was associated with oestrous behaviour (objective 2), we analysed gene expression data of day 12 cows and their average heat scores (analysis 2). Finally, to identify genes of which the expression in the bovine anterior pituitary at the start of oestrus and at around mid-cycle was associated with oestrous behaviour, that is regardless of the phase of oestrous cycle (objective 3), we analysed together, the gene expression data of day 0 and day 12 cows and their average heat scores (analysis 3).
Description of the three analyses and their objectives

Gene ontology (GO) based analysis of oestrous behaviour associated genes
For gaining insight into biological processes underlying associations between gene expression profiles and oestrous behaviour as identified by the described clustering program, we performed statistical analysis for over-representation of GO terms in sets of oestrous behaviour associated genes (study sets) in the three analyses compared to the set of all genes represented on the array (population set). The GO term over-representation analysis was performed using the Ontologizer (Bauer et al., Reference Bauer, Grossmann, Vingron and Robinson2008), a web based software package, with the parent–child intersection method developed by Grossmann et al. (Reference Grossmann, Bauer, Robinson and Vingron2007) that addresses the problem of dependencies between annotation of parent and child terms in the GO hierarchy. The Ontologizer software uses a modified Fisher’s exact test to calculate the statistical significance of over-represented GO terms. In addition to the study sets and the population set, the Ontologizer software required as input, the OBO (Open Biomedical Ontologies) file and the GO association file, both of which were available for download from the website of the GO project (http://www.geneontology.org/). The OBO file consists of GO terms, their definition and structure, whereas the GO association file maps gene products (protein, gene and transcript, etc) to GO terms. Here, the OBO and GO association files downloaded on 22 July 2008 were used. The microarray probe annotation file provided by the BOMC (http://www.bovineoligo.org/) for the bovine oligonucleotide array provides the Ensembl ID (http://www.ensembl.org/) of the best matching human homologous protein for 16 464 probes in the array. As human genes are better annotated than bovine genes, it was decided to use the human homologous protein information for the GO-based analysis. The human homologous protein Ensembl IDs were converted to the corresponding UniProt ID (http://www.uniprot.org/) wherever possible using the g:Convert module of the web-based tool g:Profiler (Reimand et al., Reference Reimand, Kull, Peterson, Hansen and Vilo2007) as the majority of the GO terms in the GO association file were mapped to UniProt IDs followed by Ensembl and NCBI RefSeq IDs (http://www.ncbi.nlm.nih.gov/RefSeq/). After filtering out genes in the population set without any GO term associations, 7635 genes remained. The GO analysis was performed separately on the list of genes from each associated cluster in each analysis and also with the combined list of genes from all associated clusters per analysis because associated genes from different clusters could be involved in common biological processes. To reduce the stringency of FDR control on the small number of genes having GO annotation and thereby observe general trends in the data, the adjusted P-value cutoff of correction for multiple testing by Benjamini-Hochberg method was relaxed to 0.35 while still considering only GO terms with ordinary P-value below 0.01 as significant.
Further, the GO analysis was re-performed by defining a smaller refined set of genes as the population set. The refined set included only genes that were expressed in the anterior pituitary with variability across samples and excluded genes, which were either not expressed or whose expression remained fairly constant across all samples. To determine this refined population set, we filtered out genes whose expression values had an inter-quartile range less than 0.5 across all the array samples, leaving a total of 9608 genes. After filtering out genes in this set without any GO term associations, 2461 genes remained.
Results
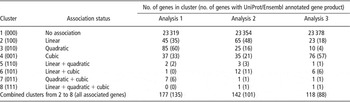
The trait of expressing oestrous behaviour was quantified as a cow’s average heat score. Data from one of the day 0 cows was excluded from further analysis because of its high outlier heat score (1750). The average heat scores for the remaining 13 day 0 cows ranged from 0 to 405, with a mean value of 178.4 (s.d. 125.7), and the average heat scores for the 14 day 12 cows ranged from 2 to 505, with a mean value of 244.7 (s.d. 175.4). These scores were used with the corresponding gene expression data to run the three analyses as already described. The total number of heat score associated genes found per cluster in each analysis is provided in Table 2, including the number of genes for which UniProt/Ensembl annotated gene product information was available. All three analyses showed that over 99% of the genes had no association with heat scores. Genes that were associated with heat scores typically showed linear, quadratic or cubic relationships and only a few showed combinations of these relations. The combined numbers of associated genes in all clusters in the three analyses were 177, 142 and 118, respectively. Figure 1 presents a Venn diagram showing the number of oestrous behaviour associated genes found per analysis and their overlap. The number of common genes that were associated with oestrous behaviour across analyses was lower when comparing the results from analyses 1 and 2 than comparing those from 1 and 3 or 2 and 3. The difference in the sets of genes identified in the three analyses indicate that the relationship between gene expression profiles and oestrous behaviour depend on the phase of oestrous cycle.
Association status of gene expression patterns to average heat score in the three analyses

Venn diagram of number of genes identified as associated with heat score in the three analyses.

Some of the genes/probes had limited or no annotation in the microarray probe annotation file provided by BOMC, in which case, we reverted to the recent re-annotation of the bovine microarray probes (Version 2, Ensembl 50: 11 September 2008) by the European Animal Disease Genomics Network of Excellence for Animal Health and Food Safety (EADGENE) (http://www.eadgene.info). Supplementary Table A (additional file 1) provides a list of all oestrous behaviour associated genes found in the three analyses along with their annotation from 2 sources – BOMC and EADGENE.
Of the nine genes associated with oestrous behaviour in all three analyses, interestingly, three genes were immunoglobulin related and one was follicle-stimulating hormone beta (FSHB) subunit, a key hormone in the regulation of oestrous cycle. Figure 2 shows the association of gene expression profile of FSHB with heat score for the three analyses – a linear relationship in analysis 1, cubic in analysis 2 and quadratic in analysis 3. Unfortunately, the association status of LH, another key hormone in the regulation of oestrous cycle could not be ascertained as probes for LH beta subunit were not present on the array. Several genes in the list of heat score associated genes are known from literature to be related to oestrous expression. These included prolactin (PRL) precursor, pituitary-specific positive transcription factor 1 (PIT1) and melanin-concentrating hormone (MCH) which associated with oestrous behaviour in analyses 1 and 2 separately but not in analysis 3. Further, considering a few examples of associated genes with a nervous system related function, Homo sapiens neurotrimin precursor (HNT), associated with oestrous behaviour in analyses 1 and 3, neurokinin-B precursor (NKB) and neurogenic differentiation factor 2 (NEUROD2) associated with oestrous behaviour only in analysis 1.
Association of gene expression profile of FSH (beta) gene with heat score in the three analyses. a Note the difference in scale in Figure 2a.

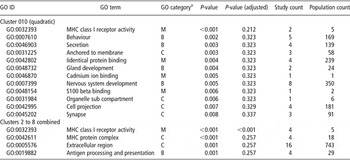
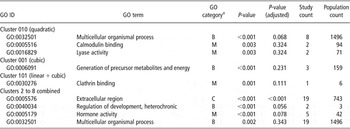
The genes that showed associations with oestrous behaviour were further analyzed based on their GO annotations provided by BOMC. The significant GO terms in the clusters of heat score associated genes in analyses 1, 2 and 3 are given in Tables 3, 4 and 5, respectively. The study count and population count provided in the tables correspond to the number of gene products annotated to the particular over-represented GO term in the cluster being analyzed and in the whole array, respectively. It was noticed that certain GO terms enriched in the combined cluster were different from the terms in the separate cluster analysis.
Gene ontology terms over-represented in clusters of heat score associated genes from analysis 1 (day 0 cows) (adjusted P < 0.35)

GO = gene ontology; MHC = major histocompatability complex.
aB = biological process; M = molecular function; C = cellular component.
Gene ontology terms over-represented in clusters of heat score associated genes from analysis 2 (day 12 cows) (adjusted P < 0.35)

GO = gene ontology.
aB = biological process; M = molecular function; C = cellular component.
Gene ontology terms over-represented in clusters of heat score associated genes from analysis 3 (day 0 + day 12 cows) (adjusted P < 0.35)

GO = gene ontology.
aB = biological process; M = molecular function; C = cellular component.
Considering only those GO terms that were supported by at least four genes, significant terms within the GO category ‘biological processes’ for analysis 1 were: ‘behaviour’; ‘secretion’; ‘nervous system development’ and ‘antigen processing and presentation’ and for analysis 2 was ‘multicellular organismal process’. Within the GO category ‘molecular function’ the following terms resulted: from analysis 1 – ‘major histocompatability complex (MHC) class I receptor activity’ and ‘identical protein binding’; and from analysis 2 – ‘hormone activity’. Within the GO category ‘cellular component’, both analyses 1 and 2 generated the term ‘extracellular region’ and analysis 1 produced in addition ‘cell projection’ and ‘MHC protein complex’. Genes identified in analysis 3 did not have any significant enriched GO term with at least four genes. The gene products in the over represented GO terms are presented in Supplementary Tables B, C and D (Additional file 2) for analyses 1, 2 and 3, respectively.
When the GO analysis was re-performed with a population set consisting of only the genes expressed with a certain variability across samples, the top listed over represented GO terms corresponded to those found in the earlier analysis but the order of ranking of the terms based on P-values differed and the P-values were less significant because of the smaller population size. However, to understand the general trends in the biological processes enriched in the lists of heat score associated genes, the choice of either population set did not matter in this case.
Discussion
Gene expression profiles in the anterior pituitary of dairy cows were associated with oestrous behaviour by applying a Bayesian hierarchical mixed model based method for clustering genes on the basis of their linear, quadratic or cubic relation with a quantitative phenotype of interest, that is heat score. Genes in a regulatory network may interact in complex ways (feedback mechanisms, cooperation or competition between genes) to result in non-linear associations between gene expression levels and phenotype. Therefore it is advantageous to use a model that accounts for both linear and non-linear associations, for example, through polynomial regression. In this study, we began the microarray data analysis with pre-processing steps performed in LIMMA. However, for the association analysis, we did not attempt to model polynomial regression in LIMMA but instead we chose the SAS program developed by Jia et al. (Reference Jia, Tang, Mercola and Xu2008) in which polynomial regression was already implemented. Jia et al. (Reference Jia, Tang, Mercola and Xu2008) reported that their method was a better and faster algorithm to detect quantitative trait associated genes in comparison to similar methods like the one described by Qu and Xu (Reference Qu and Xu2006) based on an expectation-maximization (EM) algorithm. The increased speed is achieved by logically fixing the number of clusters beforehand thereby obviating the need for extra model evaluations for determining optimal cluster number as required in the EM algorithm. In our study, we tested the association between gene expression values and phenotypic trait measurements transformed in three orders of orthogonal polynomials, and consequently, fixed the number of clusters to eight. By running the three analyses, as defined earlier, we were able to detect several genes associated with the expression of oestrous behaviour. Each analysis took less than 6 h to complete on a normal desktop computer. Analyses were performed to identify genes that were associated with heat score during different phases of the oestrous cycle but not intended to identify genes differentially expressed between these phases. Analysis 1 identified genes that may have a direct association with the expression of oestrous behaviour whereas analysis 2 identified genes that may be involved in facilitator processes that prepare the cow for later oestrous behaviour. Analysis 3 identified genes whose expression during both phases of the cycle may be associated with the expression of oestrous behaviour. The increased power gained by the greater number of data points in analysis 3 revealed significant genes that did not show up in the other two analyses. The overlap in the results from the three analyses indicate that certain genes that were directly associated with the expression of oestrous behaviour at oestrus were also involved in oestrous behaviour related processes at other phases in the cycle.
An alternative approach for doing three separate analyses would be to add nested regressions to account for phase-specific associations in a single model. However, we were not able to do so within the current framework of the SAS program as the algorithm followed would not support the steps following the model fitting if we altered the model by adding nested regressions. This could be taken up as a useful feature to add to the existing algorithm in the future.
It is likely that some of the genes predicted by this program to be associated with heat scores are false positives. To test the robustness of the algorithm used, we performed multiple runs of the algorithm on data from analysis 1 as a test case. The overlap between the original lists of associated genes reported here and the three repeated test runs were 79%, 83% and 88%. This showed that the algorithm was reasonably robust. In addition, we also did a leave-one-out analysis, although we realise that this analysis would give drastic results given the size of the current dataset. Nevertheless, even in the worst-case scenario using the smallest dataset (analysis 1), the overlap varied from 44% to 76% depending on the position of the data point removed. As expected, the differences were not only in the number of associated genes found but also the pattern of association it was assigned to. Owing to the small number of data points available, leaving out even one data point was expected to result in a change in the pattern of the association and thereby changes in the association status. Therefore, the relatively low number of animals sampled in this study was a constraint on this methodology due to which, especially the higher order relationships captured by, this method seemed to be in some cases an artefact of the method and were less reliable. For datasets of the size as in this study, it would be better to initially focus on the more reliably predicted linearly associated genes and then carefully consider genes that are associated with higher order relationships. The results may be checked for genes already known from literature to be involved in regulating oestrous. Further, rather than focusing on individual genes found associated by this method, it would be more reliable to focus on those genes that were together involved in certain biological processes as detected in the GO term enrichment analyses.
Known oestrus regulating genes and new candidate genes associated with oestrous behaviour
On the basis of annotation of the list of genes identified to be associated to oestrous behaviour (Supplementary Table A in Additional file 1), the list included genes that encoded for hormones, transcription factors, signalling molecules or other gene products. Some of these genes could be identified to have a function related to oestrous regulation and/or behaviour, examples of which are discussed below.
Among the key hormones known to regulate the oestrous cycle, probes for GnRH and LH were, unfortunately, not represented on the DNA microarray while the beta subunit of FSH was. FSHB was found to be associated with heat score either linearly or non-linearly in all the three analyses (Figure 2). Transient rises in FSH drive the emergence and growth of small antral follicles, with FSH concentrations reaching peak values around 28 h after the onset of a new oestrous cycle (Mihm and Austin, Reference Mihm and Austin2002). Relatively high expression levels of the FSHB gene may mirror a general good functioning of pituitary gonadotropes, promoting gonadotrophin-induced steroidogenesis by ovarian follicles with the resulting oestrogens facilitating oestrous behaviour (Pfaff, Reference Pfaff2005). PRL was associated with the oestrous behaviour in analysis 1. PRL, usually associated with lactation, is a multifunctional hormone that has been reported to have a negative effect on sexual arousal (Bancroft, Reference Bancroft2005). Oestrous behaviour may, therefore, be enhanced at lower PRL level. The findings indicate, to some degree, the opposite functioning of biological processes underlying lactation and reproduction. Some of the genes that were found to be associated with oestrous behaviour have known functions related to behaviour or nervous development, making them likely candidates regulating the oestrous behaviour expression. These include HNT and synapsin-2 as found in analyses 1 and 3; neurexophilin-2, PIT1 and MCH in analyses 1 and 2; tachykinin-3 precursor (containing NKB and neuromedin-K), NEUROD2 and early growth response protein 1 (EGR1) found in analysis 1. EGR1 regulates LH (beta subunit) gene expression in the pituitary gland (Lee et al., Reference Lee, Sadovsky, Swirnoff, Polish, Goda, Gavrilina and Milbrandt1996). Relatively high LH activity, like that of FSH, may reflect appropriate functioning of pituitary gonadotropes and responsiveness to the oestrogens that synchronise oestrous behaviour and LH surge-induced ovulation. Similarly, PIT1 may be an important regulator of oestrous behaviour due to its function as a transcription factor that activates expression of growth hormone and PRL genes. MCH is a neuropeptide whose administration in female rats stimulates sexual behaviour (Gonzalez et al., Reference Gonzalez, Vaziri and Wilson1996) and proestrus FSH and LH releases, which resembles the effect produced by GnRH (Chiocchio et al., Reference Chiocchio, Gallardo, Louzan, Gutnisky and Tramezzani2001). Possibly, it plays a similar role in regulating bovine oestrous behaviour. The predominant expression site for MCH is not the pituitary but the hypothalamus, hence the relatively negative expression values noticed for this gene in all cows at both phases.
The gene product sodium/potassium-transporting ATPase subunit alpha-3 (ATP1A3) was found to be heat score associated in analysis 1. ATP1A3 has been implicated in rapid-onset dystonia parkinsonism, characterised by sudden onset of neurological symptoms over hours to a few days (de Carvalho Aguiar et al., Reference de Carvalho Aguiar, Sweadner, Penniston, Zaremba, Liu, Caton, Linazasoro, Borg, Tijssen, Bressman, Dobyns, Brashear and Ozelius2004), suggesting a role in the sudden onset of behavioural changes like during oestrus. Several genes annotated to have immunological function were found to be associated with oestrous behaviour in all three analyses. Genes with immunological function were also identified in a related study by Beerda et al. (Reference Beerda, Wyszynska-Koko, te Pas, de Wit and Veerkamp2008) on the same experimental cows as in this study but using tissue from the ventral tegmental area of the brain. In their study, an analysis using LIMMA for differential gene expression between groups of day 0 and day 12 cows demonstrated up-regulation of multiple immunoglobulin superfamily proteins in day 0 cows. Immunoglobulin superfamily proteins may play important roles in brain developmental processes and the functioning of neuronal networks in adults because they provide the ideal structure for protein–protein interactions and, thus, cell-cell interactions (Rougon and Hobert, Reference Rougon and Hobert2003). Immunoglobulins may facilitate remodelling of synaptic networks, which occurs during oestrogen promoted female sexual behaviour (Pfaff, Reference Pfaff2005).
The genes discussed above can be linked to oestrous behaviour on the basis of earlier reports on the functioning of their products, which identifies them as candidates for regulating oestrous behaviour in dairy cows. The heat score associated genes found in the different analyses may help us to postulate hypotheses on the genomic regulation of oestrous behaviour. There were several oestrous behaviour associated genes that are not currently annotated or whose function in the brain is still unknown and these genes may be of particular interest to target in future research.
Biological processes associated with oestrous behaviour
Gene ontology analysis of genes found in the different clusters of the three analyses revealed over-represented GO terms. The highest number of over-represented GO terms was found in analysis 1, confirming that relationships between gene expression profiles and oestrous behaviour are most strong around the time of oestrus. As expected, the biological processes, ‘behaviour’, ‘secretion’, and ‘nervous system development’ emerged from analysis 1. Also, the GO term, ‘antigen processing and presentation’, enriched in analysis 1 was in line with expectations, given the role of immunoglobulins in remodelling of synaptic networks, which occurs during oestrogen promoted female sexual behaviour. Some of the over-represented GO terms, particularly in analyses 2 and 3, had no clear relationship with oestrous behaviour or fertility, and may represent more general processes that facilitate oestrous expression at a later phase. It would be interesting to study further the genes associated with these processes for useful new insights.
Some of the GO terms that emerged from the three analyses were supported by only a few genes in the study set. In part, this resulted from the limited number of genes for that GO term appearing on the whole array. For example, the term ‘cadmium ion binding’ in analysis 1 and ‘mesenchymal cell proliferation’ in analysis 3 have only one gene each in the study set and in the whole array associated to it. The GO terms that are based upon only few genes need to be evaluated critically regarding their importance in the regulation of oestrous behaviour, as it could be that these terms appear enriched just by chance.
Conclusions
The Bayesian hierarchical mixed model based clustering method used in this study was successful in detecting the oestrous behaviour associated genes based on the pattern of the relationship of the expression values of these genes with the quantitative phenotype, that is heat score. Although most of the oestrous behaviour associated genes and the biological processes they controlled were activated around the time of oestrus, there were also genes expressed in mid-cycle that associate with oestrous behaviour, indicating that these genes may play a role in facilitating the next oestrus. Studying these genes and the processes they control will help improve our understanding of the genomic regulation of oestrous behaviour expression, ultimately leading to better management strategies or tools to improve or monitor reproductive performance. The list of oestrous behaviour associated genes identified may be useful for studying gene networks and also for inferring possible functions for non-annotated genes. On the basis of success of this method, a similar study may be repeated on other brain areas already sampled in this experiment. The results could then be integrated to get an overall view of the gene expression patterns of oestrous behaviour associated genes in different brain areas and the likely genetic cross-talk between them and how they contribute to the expression of oestrous behaviour.
Acknowledgements
Regarding the animal experiment, the support of Jan Bloemert and co-workers of the research farm Waiboerhoeve is highly appreciated and we are indebted to Henk Sulkers and Diana Baumann for their assistance. We thank Norbert Stockhofe for helping to set up the study and Ad Korevaar for his crucial role in the tissue collection. Zhenyu Jia and Shizhong Xu are acknowledged for kindly providing the SAS code for detection of quantitative trait associated genes and helpful initial instructions. The study was financially supported by the international cattle breeding co-operative CRV and has been co-financed by the European Commission, within the 6th Framework Programme, contract No. FOOD-CT-2006-016250 (SABRE) and FOOD-CT-2004-506416 (EADGENE). The text represents the authors’ views and does not necessarily represent a position of the Commission who will not be liable for the use made of such information.