1 Introduction
A growing body of recent work focuses on the challenging problem of scene understanding using a variety of cross-modal methods fusing techniques from image and text processing. Among the tasks dealing with scene understanding, the automatic generation of image descriptions has been widely studied. Most current approaches draw inspiration from machine translation and use a Recurrent Neural Network to learn to translate image features into an English sentence, one word at a time (Vinyals et al. Reference Vinyals, Toshev, Bengio and Erhan2015; Xu et al. Reference Xu, Ba, Kiros, Cho, Courville, Salakhudinov, Zemel, Bengio, Blei and Bach2015).
While the results obtained by Recurrent Neural Network-based approaches are often impressive, the learned representations do not explicitly encode the relations between the objects in a scene. They are generally agnostic of who is doing what to whom and as a result are neither interpretable nor particularly suitable for reasoning. Efforts to advance scene understanding have seen the emergence of new tasks such as visual question answering (Antol et al. Reference Antol, Agrawal, Lu, Mitchell, Batra, Lawrence Zitnick and Parikh2015), where the aim is to provide an accurate natural language answer given a question about an image, e.g., by predicting the form the answer might take (Kafle and Kanan Reference Kafle and Kanan2016). Another strand of research focuses on how to explicitly encode the underlying semantics of images, making use of structural representations (Elliott and Keller Reference Elliott and Keller2013; Ortiz et al. Reference Ortiz, Wolff and Lapata2015; Johnson et al. Reference Johnson, Krishna, Stark, Li, Shamma, Bernstein and Fei-Fei2015; Yatskar, Zettlemoyer and Farhadi Reference Yatskar, Zettlemoyer and Farhadi2016b). Knowing what entities are depicted in an image and how they relate to each other would allow algorithms to correctly infer the actions taking place, the key participants, and their semantic roles.
In this paper, we aim to develop explicit, symbolic representations for the semantics of scenes which we operationalize as visual (constituent or dependency) trees. Our algorithm constructs tree representations deterministically based on the set of objects or entities automatically detected in a scene and their spatial configurations (e.g., beside, close). We depart from previous work (Elliott and Keller Reference Elliott and Keller2013; Elliott and de Vries Reference Elliott and de Vries2015; Yatskar et al. Reference Yatskar, Zettlemoyer and Farhadi2016a) in decoupling the semantic representations from the dataset or application scenario for which they are developed. Our representations are generic, they can be derived for any existing dataset, as long as they contain images, without relying on additional annotator effort or expertise. We also argue that representations based on well-known types of tree structures are expedient from a modeling perspective as they allow us to reuse standard tools and methods from natural language processing. We showcase the utility of our representations in two applications, namely image description generation and image-based retrieval. Our generation model builds on statistical machine translation (SMT; Koehn et al. Reference Koehn, Hoang, Birch, Callison-Burch, Federico, Bertoldi, Cowan, Shen, Moran, Zens, Dyer, Bojar, Constantin and Herbst2007), however, unlike related work (Ortiz et al. Reference Ortiz, Wolff and Lapata2015) which uses a model inspired by phrase-based SMT to produce descriptions for abstract scenes (Zitnick, Vedantam and Parikh Reference Zitnick, Vedantam and Parikh2016), we employ syntax-based techniques and operate on objects automatically detected in real-world images. Moreover, we propose a situation-driven approach that exploits semantic predicate–argument structures (PASs) to derive training data for components of our generation system. Our image retrieval model uses tree-kernel methods over visual trees to quantify the similarity between images. We experimentally evaluate whether (a) tree-based approaches are superior to models using less or no structure and (b) the type of tree representation (i.e., constituency versus dependency) has any bearing on model performance. Our results show that both types of representation perform comparably, while models making use of bags of objects, relational tuples (Ortiz et al. Reference Ortiz, Wolff and Lapata2015) or templates (Elliott and de Vries Reference Elliott and de Vries2015) lag behind. In comparison with previous work on structural representations of visual scenes (Elliott and Keller Reference Elliott and Keller2013; Johnson et al. Reference Johnson, Krishna, Stark, Li, Shamma, Bernstein and Fei-Fei2015), our representation framework is less resource and labor-intensive. Compared to neural methods, our approach requires more resources but is not task-specific. For example, neural models are typically end-to-end systems developed for a specific task such as image captioning. Our framework is more generic—it encodes situations, participants, and their spatial relations—and can be easily used for various downstream tasks (not just image captioning) and further reasoning modules.
In the remainder, we first discuss related work and then introduce our visual representation framework (Section 2). Next, we describe how visual trees lend themselves to the development of image description generation and retrieval models (Sections 4 and 5). Finally, we present experimental results in Section 6 and conclude the paper in Section 7.
2 Related work
Previous work has shown that structured image representations are useful for tasks such as image description generation (Elliott and Keller Reference Elliott and Keller2013; Elliott and de Vries Reference Elliott and de Vries2015; Ortiz et al. Reference Ortiz, Wolff and Lapata2015) and retrieval (Lan et al. Reference Lan, Yang, Wang and Mori2012; Elliott and de Vries Reference Elliott and de Vries2015). Most related to our research is the work of (Elliott and Keller Reference Elliott and Keller2013) who introduce Visual Dependency Representation (VDR) as an intermediate structure that captures the spatial relationships between objects in an image. Follow-up work (Elliott and de Vries Reference Elliott and de Vries2015) infers VDRs automatically using an object detector and the description of an image. Descriptions of unseen images are produced by first predicting their VDRs and then generating the text with a template-based model.
We create visual trees over objects detected in an image deterministically. Our VDR construction procedure is guided by the visual modality alone and is thus applicable to any image dataset with or without descriptions. Aside from dependencies, we also introduce visual representations based on constituency trees and explore differences and commonalities between the two. Our approach is applicable to large-scale datasets exhibiting multiple object classes, actions, and object interactions, while Elliot and deVries (Reference Elliott and de Vries2015) focus on ten actions that are describable by transitive verbs (e.g., riding a bike). Other work (Ortiz et al. Reference Ortiz, Wolff and Lapata2015; Lan et al. Reference Lan, Yang, Wang and Mori2012) exploits relational tuples of the form object–spatial-relation–object rather than full-blown syntactic representations. Ortiz et al. (Reference Ortiz, Wolff and Lapata2015) use such tuples to represent abstract scenes created from collections of clip art images (Zitnick et al. Reference Zitnick, Vedantam and Parikh2016) and show how these can be used to generate scene descriptions following an SMT-based approach. We experimentally examine whether their model scales beyond abstract scenes and whether it can deal with real-world images and automatically detected objects.
The structured representations we employ capture spatial relationships between objects in an image (e.g., beside, surrounds). These relationships are typically based on rules which take geometric features into account such as the angle, distance, and pixel overlap of two object regions (Elliott and de Vries Reference Elliott and de Vries2015; Ortiz et al. Reference Ortiz, Wolff and Lapata2015; Yatskar, Ordonez and Farhadi Reference Yatskar, Ordonez and Farhadi2016a). Early work on image description generation predicts the prepositional relationships between two objects based on their spatial arrangement. For instance, Kulkarni et al. (Reference Kulkarni, Premraj, Dhar, Li, Choi, Berg and Berg2011) use spatial relations to inform the language model of their generation system and for a template-based approach. In a similar vein, Li et al. (Reference Li, Kulkarni, Berg, Berg and Choi2011) create triples encoding a spatial relation between two objects and use the web to find n-grams verbalizing them, while Mitchell et al. (Reference Mitchell, Han, Dodge, Mensch, Goyal, Berg, Yamaguchi, Berg, Stratos and Daumé2012) represent spatial relations as prepositions and use them to generate syntactic trees describing an image. Spatial relations have been also used in the context of learning how to manipulate tasks performed by robots such as making a peanut butter and jelly sandwich (Zampogiannis et al. Reference Zampogiannis, Yang, Fermüller and Aloimonos2015). Finally, in text-to-scene conversion, where 3D scenes are generated from textual descriptions (e.g., The dinosaur is in front of the horse.), spatial relations are used to define the basic layout of scenes (Coyne and Sproat Reference Coyne and Sproat2001).
Our work joins others in explicitly representing the structure of images in order to enable reasoning about the entities and their relationships. Johnson et al. (Reference Johnson, Krishna, Stark, Li, Shamma, Bernstein and Fei-Fei2015) introduce scene graphs which capture the detailed semantics of images by explicitly modeling objects, their attributes, and relationships between objects. They use hand-crafted scene graphs as queries for retrieving semantically similar images (i.e., those images where the query graph can be most likely grounded). Schuster et al. (Reference Schuster, Krishna, Chang, Fei-Fei and Manning2015) extend this approach with a parser which maps dependency-parsed natural language descriptions to scene graphs. Other work (Lin et al. Reference Lin, Fidler, Kong and Urtasun2015) infers 3D scene graphs from images and converts them to tree representations or employs a knowledge base and reasoning module (Aditya et al. Reference Aditya, Baral, Yang, Aloimonos and Fermuller2016). In comparison, our approach is knowledge-lean, the representations are constructed without requiring additional annotations or resources such as a database or a parser. Finally, our work relates to recent efforts to define visual semantic role labeling tasks (Gupta and Malik Reference Gupta and Malik2015; Yatskar et al. Reference Yatskar, Ordonez and Farhadi2016a), although we do not explicitly identify roles or actions in an image.
3 Structural visual representations
In the following, we present the details of our visual representation framework which is based on the entities detected in an image and their spatial relations. We first describe the inventory of spatial relations we consider and then discuss our tree construction procedure. Throughout the section, we assume we are provided with a set of detected objects, we describe how these are obtained in Section 6.
3.1 Spatial relations
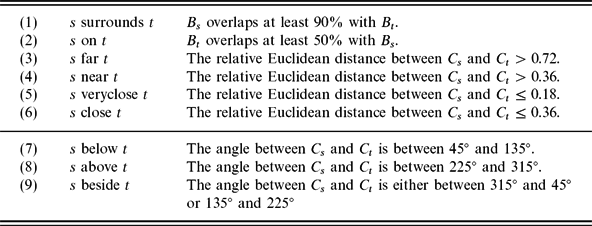
Table 1 summarizes the definitions we apply for determining a spatial relation between two objects. Our inventory of spatial relations is a refined version of those presented in Elliott and Keller (Reference Elliott and Keller2013) and Ortiz et al. (Reference Ortiz, Wolff and Lapata2015) so as to account for the wide variety of object interactions attested in open domain real-world scenes. Elliott and Keller (Reference Elliott and Keller2013), in conjunction with human annotators, developed the relations with the goal to discriminate between mere object co-occurrence and action-related object interactions. For details, see Elliott (Reference Elliott2015, p. 12ff). We introduce relations 3 and 5, and additionally allow combinations of several relations. Parameters in the definitions of relations were based on those deemed optimal in previous work (Ortiz et al. Reference Ortiz, Wolff and Lapata2015; Elliott and Keller Reference Elliott and Keller2013). Relations 1–6 are mutually exclusive. If one of the conditions for relations 7–8 applies to a pair of objects, we concatenate the relation with the chosen relation from 1–6 to form a finer relation (e.g., on_below). We estimate the relative Euclidean distance between the centroids of objects s and t in relation to the length of the image’s diagonal (relations 3–6 in Table 1).
Definitions of spatial relations between objects s and t based on pairwise relationships between bounding boxes B or their centroids C

To compute the angle between centroids, we follow the definition of the unit circle, i.e., 0° lies to the east of its center and 90° to the north.
We also experimented with learning abstract relations from data through a k-means clustering approach, which used as features three geometric properties, namely pixel overlap of regions, and the angle and the distance between regions (see the definitions in Table 1). Experimental results revealed, however, that tree representations which used these induced relations performed worse (see the caption generation experiments in Section 6).
Finally, for an automatic induction of more elaborate and generic relations (e.g., attached to; moving towards; instrument for), which go beyond purely spatial ones, datasets of, e.g., images and their descriptions, would not suffice. This goal would not only require human annotations, but would further lead to arbitrary data (e.g., Johnson et al. (Reference Johnson, Krishna, Stark, Li, Shamma, Bernstein and Fei-Fei2015)).
3.2 Trees
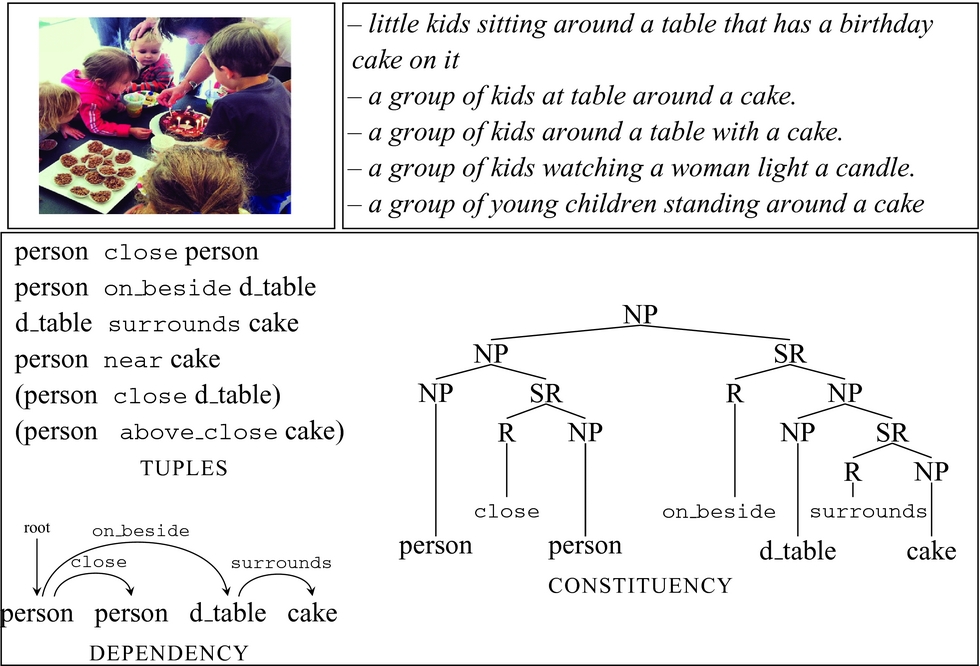
Previous work (Lan et al. Reference Lan, Yang, Wang and Mori2012; Ortiz et al. Reference Ortiz, Wolff and Lapata2015) represents an image as a set of binary tuples between objects and their spatial relations. Figure 1 (bottom left) gives an example. Representations based on object pairs cannot express ditransitive verbs. Furthermore, tuples with more than two objects are ambiguous with respect to the scope of the spatial relations, unless implicit conventions on the interpretation of their order are applied. For example, in the tuple 〈person surroundscarrot on_beside person closegiraffe〉, it is not clear whether the giraffe is close to the person, the carrot, or both.
Top: example of image and its descriptions collected from humans. Bottom: types of representations (tuples, dependency, and constituency trees; dining_table is abbreviated to d_table to save space). Tuples in parentheses denote duplicates—both its objects are part of a previous tuple. Spatial relations were determined from image regions (Section 3.1).

We opt to represent objects and their relations through the use of tree structures (Elliott and Keller Reference Elliott and Keller2013) as they allow us to capture an arbitrary number of scene participants and can express complex relationships involving, e.g., transitive and ditransitive verbs. In addition, they allow for the quantification of multiple object class instances (see Figure 1 for an example). In analogy to syntactic representations of sentences, we formulate two different types of visual trees based on dependency and constituency relations. We first formally introduce visual trees and then explain how these are automatically constructed.
Constituency Trees: Our visual constituency trees are based on a context-free grammar G c = 〈R, T, N, S〉. S is the start symbol and T are terminal symbols comprising all spatial relation labels (e.g., below, surrounds_above) and object class labels (e.g., umbrella); N denotes non-terminals which in our case are object phrases (NPs; e.g., skateboard, or skateboard on_below person), spatial relation phrases (SRs; e.g., on_below person), and spatial relations (Rs; e.g., on_below). The grammar rules for G c are defined as follows:

Figure 1 (right) shows an example tree. A spatial relation phrase can be interpreted as a stand-in for a verbal or prepositional phrase in a linguistic constituency tree.
Dependency Trees: A dependency grammar encodes the structure of sentences by pairwise asymmetric relations between terminal symbols known as dependency (or head-dependent) relations. A dependency structure is a directed acyclic graph which contains the terminal symbols as its nodes, and their dependencies as edges. The (finite) verb is the center of the structure to which all other nodes are connected through the dependencies. In a visual dependency tree, nodes are object labels and edges correspond to spatial relations. The structural center of the visual dependency grammar is an individual object assumed to play a central role in the depicted scene. This definition is similar to Elliott and Keller’s (Reference Elliott and Keller2013) VDR; however, our trees are ultimately different due to another construction procedure which we outline below. The dependency grammar G D in Table 1 defines the set of spatial relations we employ and Figure 1 (bottom left) provides an example of a visual dependency tree, with the center (person) being the dependent of the root label. Dependencies can capture nuanced semantics of seemingly related images. For example, an image showing a man standing on a flying airplane is representated by below_veryclose(airplane, person), whereas the tree for an image depicting people boarding a plane would be surrounds(airplane, above_veryclose(person, person)). Alternatively, if the image showed people standing by an airplane, the appropriate representation would be veryclose(airplane, above_veryclose(person, person)).
Visual dependency trees capture object interactions via pairwise spatial relationships. The latter are part of the grammar which describes the language. Constituency trees explicitly group objects in spatial proximity into phrases. Spatial relations and object labels are both terminal symbols, i.e., words of the language, and differ in terms of their grammatical categories (formally, NP and R). Intuitively, constituency trees may be better suited at modeling phrases (i.e., groups of objects) and their compositionality.
3.3 Tree creation
For each image, we construct a tree automatically in a deterministic manner. Assuming objects have been identified with an object detector, we rank all possible object pairings in ascending order of the Euclidean distance between their centers. Starting with a forest where each node (i.e., object) is a separate tree, we create a minimum spanning tree (MST). An MST is a subset of the edges of a connected, edge-weighted graph which connects all the nodes of the graph together and whose sum of edge weights is as small as possible. We process the list of object pairs top–down, connecting the corresponding nodes if they are not yet in the same tree, until all objects have been linked. We then transfer the MST to a constituency or dependency tree. In our MST construction procedure, we follow Kruskal’s (Reference Kruskal1956) MST algorithm.Footnote 1 We use this algorithm due to its simplicity and general applicability to a variety of graph structured problems; however, other well-known algorithms (Prim Reference Prim1957; Karger, Klin and Tarjan Reference Karger, Klin and Tarjan1995) could have been employed instead.
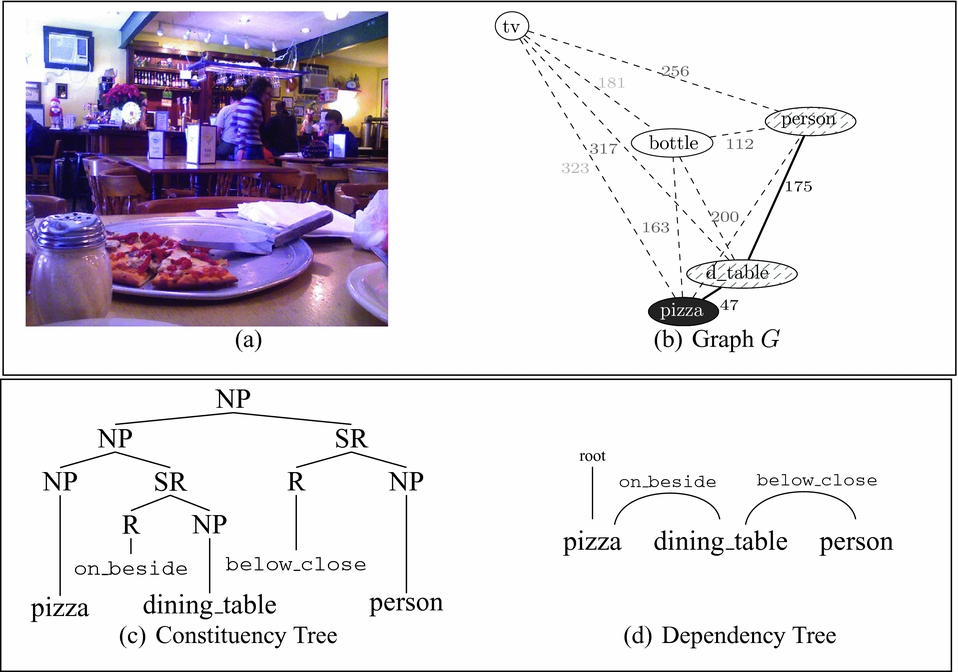
Figure 2 illustrates the construction process. The five objects identified in image (a) constitute nodes in the graph (b); graph edges denote spatial proximity; as mentioned earlier edge weights correspond to the Euclidean distance between their objects’ centers. Filled nodes in the graph represent the MST which can be straightforwardly converted to a dependency tree as follows: we first select the root node according to a criterion such as the prediction score of the object detector, or the top-ranked object as determined by a content selection model (see Section 4.2). This node then determines the direction of all edges which we label with their respective visual relations. For example, to construct the tree in Figure 2(d), we first link the object pizza which has been deemed the central object (subfigure (b)) to the root. We next insert the node dining_table as a dependent of pizza, use the definitions in Table 1 to compute their relation and link the nodes with a corresponding edge (on_beside). dining_table is in turn linked to person in the MST, and we insert the node and the corresponding edge applying the same procedure as before.
Illustration of tree creation process. Given a graph G with nodes denoting the objects in an image and edge weights corresponding to their Euclidean distance, we compute a minimum spanning tree for a subgraph G′⊆G (filled nodes and plain edges in (b)) and use it to build a constituency (c) and dependency (d) tree, starting from an individual node in the spanning tree (black node in (b)).

We also construct constituency trees based on the MST. We use grammar G c (defined in Section 3.2) and build a tree with a deterministic bottom–up parse. As the leftmost node of the tree, we select n o from the edge 〈n o, n i〉 with the least weight in the MST (e.g., NP(pizza) in 〈NP(pizza), NP(dining_table)〉 in Figure 2). This node is again selected according to some criterion, as explained in the dependency tree creation. We use the definitions in Table 1 to compute the spatial relation between the nodes n o and n i, and call rules 3 and 4 of grammar G c (in the example in Figure 2, this results in NP(pizza), R(on_beside), NP(dining_table)). Rule 2 of G c can then be applied, which reduces the corresponding relation and n i to a spatial relation phrase (e.g., SR(R(on_beside), NP(dining_table))). Next, rule 1 from G c reduces SR and the NP which dominates node n o to an NP (e.g., NP(NP(pizza), SR(R(on_beside), NP(dining_table)))). Since no other rules apply, the creation proceeds with the next edge 〈n j, n k〉 of the MST which has the least weight and is connected to the already processed nodes (e.g., 〈dining_table, person〉, with n j = =n i). It calls rules 3 and 4 (e.g., R(below_close), NP(person)), and rule 2 (e.g., SR(R(below_close), NP(person))). Again, rule 1 is called to reduce the NP, which dominates node n j, and the SR to an NP (e.g., the tree in Figure 2). Tree creation continues until all edges have been processed.
In sum, we use the MST to guide our tree creation procedures. The MST is derived on the basis of the Euclidean distance between the objects’ centers, and as a result, a tree’s adjacency relations between objects reflect closeness in the visual modality—objects that are in a direct head-dependent relationship in a tree appear relatively close to each other in the image.
4 Image description generation
We will now illustrate how the proposed tree-based representations can be used to generate image descriptions. The task has recently received significant attention due to the creation of large datasets containing images and associated descriptions (Chen et al. Reference Chen, Fang, Lin, Vedantam, Gupta, Dollár and Zitnick2015) and new learning techniques based on multimodal recurrent neural networks (Vinyals et al. Reference Vinyals, Toshev, Bengio and Erhan2015; Xu et al. Reference Xu, Ba, Kiros, Cho, Courville, Salakhudinov, Zemel, Bengio, Blei and Bach2015). A typical generation model is trained on a parallel corpus of image-description pairs. Since in our case, images are represented by visual trees, we can repurpose SMT machinery for this task. Specifically, we train a syntax-based tree-to-text SMT system where the source language is rendered as a tree (see Section 3) and corresponds to the visual modality. The target language is the textual modality, i.e., natural language verbalizations of the objects or entities depicted in the image and their interactions.
To describe a new image i, we first perform content selection, i.e., we determine the relevant objects  $\mathcal {O}(i)$ from the overall set of detected objects. We then convert $\mathcal {O}(i)$ to visual representations, as explained in the previous section, and use the SMT model to decode the visual content of i to natural language. In the following, we describe our image description generation model in more detail.
4.1 Parallel corpus creation
The training of an SMT model requires a parallel corpus which consists of pairs of descriptions and visual trees, where each object or entity in the tree is mentioned in the description, and each situation or event can be grounded in the image. Such grounding is absent from most existing datasets (but see Krishna et al. 2016; Plummer et al. 2015, for exceptions) and must be somehow inferred. We detail below how we obtain this information on the Microsoft COCO Captions dataset (Chen et al. Reference Chen, Fang, Lin, Vedantam, Gupta, Dollár and Zitnick2015) which we use in our experiments (see Section 6 for details), but our approach is general and can be applied to any corpus of images and descriptions.
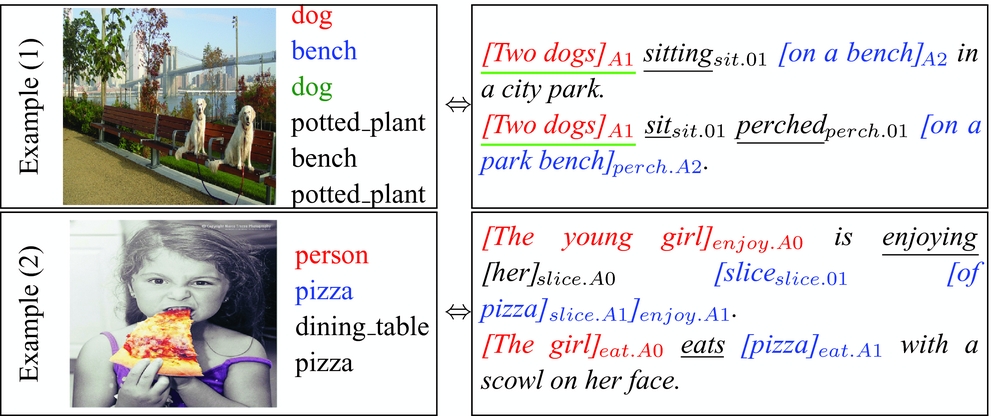
We preprocess the descriptions with a semantic role labeler and align the identified semantic arguments with the objects detected in the image. Specifically, we parse the descriptions with PathLSTM, a state-of-the-art SRL system which is based on dependency path embeddings (Roth and Lapata Reference Roth and Lapata2016). We extract all predicates (e.g., eat) along with their arguments (e.g., constituents the girl and pizza bearing labels A0 and A1 in Figure 3, Example (2)) and modifiers.
Example of predicate-argument structures grounded in the images by finding alignments (colored) between the detected objects (left) and the arguments (right). (A0 labels denote agents, while A1 labels denote patients or themes (Palmer, Gildea and Kingsbury Reference Palmer, Gildea and Kingsbury2005).)

Let A denote a PAS extracted from the description of image i containing objects $\mathcal {O}(i)$ (e.g., person in Figure 3, Example (2)). To ground A in image i, we find an alignment α which links each argument a ∈ A (with n = |A|) to its referring object(s),  $s \in \mathcal {O}(i)$. Function (1) below scores the alignment between object s of class l(s) and argument a:
 \begin{equation}
\operatorname{score_{al}}(s,a) = \operatorname{e}(l(s)|a) \operatorname{d}(s)
\end{equation}
where d(s) is the class detection score of s, and e(l(s)|a) the probability of class l(s) being aligned to argument a. If there is a direct string match between the object class (or its category, aka hypernym) and the argument, we set the probability e to 1. Otherwise, we estimate e from object–noun alignments which we obtain by running giza++ (Och and Ney Reference Och and Ney2003) on a corpus containing pairs of object class labels detected in an image and all nouns found in its corresponding description.
Let σ denote a permutation on a subset of $\mathcal {O}(i)$, and |a| the minimum number of a’s referents (e.g., |a| = 2 for two dogs, men). An alignment α is obtained by the permutation on the object–argument pairings (σ(s 1), a 1), . . ., (σ(s m + n), a n),  $m=\sum ^n_{j=1} (|a_j|-1)$, which maximizes the sum of the individual alignment scores:
 \begin{equation}
\begin{split} \alpha ^*=& \max _{\sigma } \frac{1}{n}\sum _{j=1}^{n}\sum _{k=0}^{|a_j|-1}\frac{1}{|a_j|} \operatorname{score_{al}}(\sigma (s_{j+k}),a_{j}) \end{split}
\end{equation}
Overall, we keep those alignments which link each argument of a PAS and have a score greater than a threshold β (tuned experimentally on validation data). We leave the linking of modifiers optional. Figure 3 shows two examples of images, their descriptions annotated with PASs, and the established alignments.
Grounded PASs are paired with simplified image descriptions. We combine the surface strings of the predicate and the aligned arguments and remove any ungrounded components of the arguments, including adjectives or noun adjuncts. For instance, in Figure 3, for Example 2, we create the sentence the girl is enjoying her pizza for the predicate enjoying and its arguments A0 and A1, and in Example (1) we build the descriptions two dogs sit and two dogs perched on a bench. We furthermore create descriptions for the content captured by multiple grounded PASs, such as in Figure 3 (Example 1) for which we obtain the description two dogs sit perched on a bench. Finally, by applying simple rules based on the dependency parses and the PoS-tags of the captions, we create additional descriptions with alternative referring expressions for quantity groups and for noun phrases with coordinating conjunctions. For example, in the description a group of people are gathered around a table, we replace the subject a group of people by its semantic head, i.e., people, which results in the alternative people are gathered around a table. And we split the caption a table that has some food and a drink into two alternatives: a table that has some food and a table that has a drink. As a result, it is possible to obtain multiple descriptions for every original caption of an image. Note that in the parallel corpus each visual tree which corresponds to an individual caption is built such that it only contains the objects mentioned in the caption. In other words, the semantic content of each caption is licensed by the tree and vice versa. And since we construct the corpus on the basis of PASs, this information corresponds to the verbalization of the objects’ interactions or relationships.
4.2 SMT model
Surface realization: SMT formulates the problem of translating from a source to a target language as finding the translation t that maximizes the conditional probability:
 \begin{equation}
t^{*} = {arg\,max}_t p(t|s)
\end{equation}
where p(t|s) is approximated by a conditional log-linear model. Syntax-based SMT (Huang Reference Huang2006) defines p(t|s) in terms of the probabilities of individual derivations d ∈ D(s, t) in a synchronous grammar. The objective function is typically
 \begin{equation}
d^* = {arg\,max}_d \left(\sum _{k=1}^K \lambda _k h_k(d)\right)
\end{equation}
where h k denote feature functions which define different models, such as a language model, a translation table and a word penalty model. The constants λk are tuned during training and used to scale the different models. In our experiments, we used the tree-to-string SMT framework implemented in Moses (Koehn et al. Reference Koehn, Hoang, Birch, Callison-Burch, Federico, Bertoldi, Cowan, Shen, Moran, Zens, Dyer, Bojar, Constantin and Herbst2007) to train our models.
Content selection: At test time, we must decide what to talk about, i.e., which objects to focus on. We use logistic regression with l 2-regularization and one hidden layer to predict whether a detected object s is likely to be relevant for the scene, while taking into account other detected objects. This way we do not impose any restrictions on the number of relevant objects, and allow tree-based representations of arbitrary size. The regression model is trained on positive and negative instances obtained from the parallel corpus described in the previous section.
We create a positive training example for each object which was aligned to an argument in the SRL-parsed image descriptions. As negative examples, we select objects with classes different from those of the aligned objects. We represent objects as vectors using a mixture of unary and binary features. The former include the detection score D t of any object t, and the relative size S s of target object s in relation to the average relative object size of its class:
 \begin{equation}
S_{s_i} = \frac{\text{area}(s_i)}{\text{area}(i)} \left\bad. \left[\frac{1}{|O(l_{s_i})|}\sum _{t_j \in O(l_{s_i})} \frac{\text{area}(t_j)}{\text{area}(j)} \right]\right.
\end{equation}
where area(s i) is the area of object s i in image i. S s is higher if object s (rendered by its bounding box) is larger than we would expect for its object class l s, which we estimate from all instances O(l s) of class l s in our training data (see Section 6.1 for details). Intuitively, S s is a means to express the salience of an object in a specific scene. Binary features include the relative distance D s, t between objects s and t, and their normalized co-occurrence frequency F s, t. We estimate D s, t as the relative Euclidean distance between the centers of s and t (in relation to the length of image i’s diagonal). F s, t is estimated from the object occurrences in the parallel training. We furthermore include the spatial features used for the determination of the spatial relation between two objects, i.e., the relative area of s’s bounding box (unary), the intersection-over-union of s and t, and the normalized angle between s and t.
5 Query-by-example image retrieval
In query-by-example image retrieval (also called content-based image retrieval), images are retrieved from a collection so that they are maximally similar to some query image. The similarity of images, however, is ambiguous and depends on the user intent and the purpose of the query. A large body of work has focused on images of city landmarks (e.g., Oxford or Paris (Philbin et al. Reference Philbin, Chum, Isard, Sivic and Zisserman2007, Philbin et al. Reference Philbin, Chum, Isard, Sivic and Zisserman2008)) or of holiday scenes, such as water effects (Jégou, Douze and Schmid Reference Jégou, Douze and Schmid2008). Since our goal, in contrast, is to capture the semantic content of visual scenes with respect to object interactions, we follow previous work along this line (Elliott, Lavrenko and Keller Reference Elliott, Lavrenko and Keller2014) and define image similarity in terms of the actions (e.g., hit) or states (e.g., sit) they depict. Specifically, the task is to, given a query image showing an action or state, find all images which depict the corresponding predicate (Elliott et al. Reference Elliott, Lavrenko and Keller2014).
More formally, let  $\mathcal {I}$ denote an image collection. For every query image q i, we produce a ranking of all images in $\mathcal {I}$ in the order of their similarity to q i. We estimate the similarity of structured visual representations using tree kernels. The latter have been applied to several NLP tasks ranging from syntactic parsing (Collins and Duffy Reference Collins and Duffy2001), to predicate–argument classification (Moschitti Reference Moschitti2006b), and relation extraction (Culotta and Sorensen Reference Culotta and Sorensen2004). Tree kernels have proven a practical alternative to feature-based methods since they do not require the conversion of trees and their substructures into feature vectors. Instead, they allow implicit exploration of the entire feature space of substructures and compute the similarity between two trees in terms of the number of common tree fragments (Collins and Duffy Reference Collins and Duffy2001).
We compute the similarity of two trees T 1 and T 2 via K, a tree kernel which measures the number of common fragments between T 1 and T 2, with a decay factor of λ (see Moschitti Reference Moschitti2006a for details). We further apply normalization to obtain a score between 0 and 1:
 \begin{equation}
K^{\prime }(T_1, T_2) = \frac{K(T_1, T_2)}{\sqrt{K(T_1,T_1) \times K(T_2,T_2)}}
\end{equation}
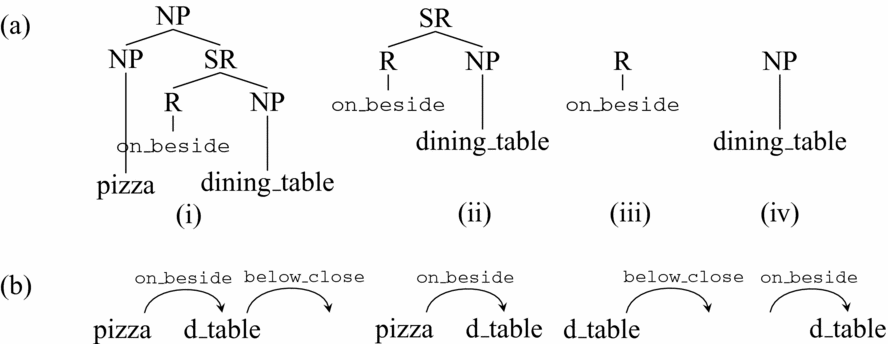
We use a subtree (ST) kernel to measure the similarity of two images represented by visual constituency trees. An ST is a tree fragment in the constituency tree which may consist of any tree node and its descendants including the leaves (Vishwanathan and Smola Reference Vishwanathan and Smola2002).Footnote 2 Figure 4(a) shows four (out of eight) STs of the constituency tree in Figure 2. For the sake of simplicity, we exemplify the similarity estimation with ST kernels by means of the two first STs T (i) and T (ii) in Figure 4(a). The common STs are T (ii) to T (iv), hence K(T (i), T (ii)) = 3 (with λ = 1). Applying Equation (6) gives K′(T (i), T (ii)) = 0.77, since K(T (ii), T (ii)) = 5 and K(T (i), T (i)) = 3.
Subtrees (a) and partial trees (b) of the visual constituency and dependency trees, respectively, shown in Figure 1.

For visual dependency trees, we follow Moschitti (Reference Moschitti2006a) and use partial tree (PT) kernels. A PT is any substructure of a tree—in our case, PTs also contain nodes referring to spatial relations. Examples of PTs are shown in Figure 4(b). The similarity of trees with PT kernels is estimated in the same fashion as illustrated for ST kernels.
6 Experiments
We present experiments on image description generation and image retrieval. In both cases, we address the question of whether the tree structured representations introduced in this paper are beneficial for capturing the semantic content of images. We first describe the datasets used for our experiments, preprocessing tools, and comparison systems. We then present our results on both tasks, and conclude this section with an error analysis.
6.1 Experimental setup
Datasets: For both tasks, we used the publicly available Microsoft COCO Captions datasetFootnote 3 (Chen et al. Reference Chen, Fang, Lin, Vedantam, Gupta, Dollár and Zitnick2015) which contains more than 200,000 images (80 K training, 40 K validation, and 80 K testing images). All training and validation images are annotated with multiple object instances from eighty object classes (e.g., horse, airplane, banana), their categories (e.g., Animal, Vehicle, Food), and five captions, inter alia. The captions were collected via Amazon’s Mechanical Turk by asking annotators to describe the important parts of an image. We used the COCO training set in order to create a parallel corpus as described in Section 4.1 for training the SMT-based description generation models and the content selection model. In total, our training data contains approximately 50 K instances. The mean depth of the trees is 3.5 (std = 0.99; constituency) and 3.3 (std = 0.85; dependency). (For technical reasons, we represent edge labels by separate nodes, i.e., a dependency tree with two objects has depth 3.) On average, the training descriptions verbalize the interactions between two and three objects.
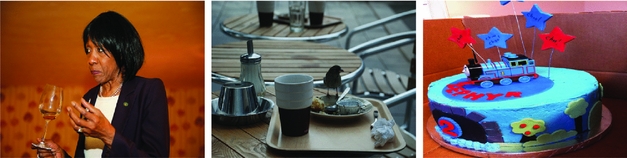
The reference descriptions for the COCO test data are not publicly available, and the performance of a model on the test data can be benchmarked by uploading its generated captions to the COCO test server. Note, however, that only automatic evaluation metrics, such as BLEU (Papineni et al. Reference Papineni, Roukos, Ward and Zhu2002), are used, which compare reference and system captions automatically on the basis of, e.g., n-gram agreement. Since we want to evaluate the models against human judgments in addition to reporting results using automatic measures, we created a test set of reference captions for N = 208 images from the COCO 2015 test set. In view of our interest in the verbalization of the relation between objects, images were sampled so that they contained highly frequent (seventy per cent of all test instances), moderately frequent (fifteen per cent), and infrequent object pairs (fifteen per cent; see Figure 5 for examples). Following the Amazon’s Mechanical Turk experimental design described in Chen et al. (Reference Chen, Fang, Lin, Vedantam, Gupta, Dollár and Zitnick2015), we elicited five reference descriptions for every sampled image.
Examples of images with frequent (left), moderately frequent (middle), and infrequent (right) object pairs from the COCO 2015 test set.

There exist many datasets created on top of the COCO images for tasks such as visual question answering (Antol et al. Reference Antol, Agrawal, Lu, Mitchell, Batra, Lawrence Zitnick and Parikh2015) or referring expressions interpretation (Yu et al. Reference Yu, Poirson, Yang, Berg and Berg2016). As far as content-based image retrieval is concerned, to the best of our knowledge, there is no corresponding extension of COCO. Elliott et al.’s (Reference Elliott, Lavrenko and Keller2014) work on predicate-centered content-based image retrieval, in turn, was limited to only ten actions. As we explain along with the discussion of our results, we therefore created a dataset from COCO by extracting the predicates from the image descriptions.
Preprocessing: We used Girshick’s (Reference Girshick2015) fast region-based convolutional neural network to detect objects in images. The system takes as input the whole image and region proposals and classifies and refines the proposals. Specifically, for each proposal, it outputs a softmax probability distribution over K + 1 object classes as well as refined bounding box positions for every class. We used the publicly available pretrained ImageNet (Russakovsky et al. Reference Russakovsky, Deng, Su, Krause, Satheesh, Ma, Huang, Karpathy, Khosla, Bernstein, Berg and Fei-Fei2015) model CaffeNetFootnote 4 and fine-tuned it on the eighty object classes of the COCO object detection challenge using fast region-based convolutional neural network. Region proposals were extracted with selective search (Uijlings et al. Reference Uijlings, van de Sande, Gevers and Smeulders2013). We filtered overlapping boxes with a symmetric intersection-over-union of more than fifty per cent. Finally, we extracted the top fifteen detected locations from the images and filtered overlapping boxes rendering the same object class with a 0.3 intersection-over-union threshold.
6.2 Comparison models
Bag-of-objects: This baseline makes use of detected objects only, and does not exploit any structural information. The visual representation of an image is simply a bag of the top-N predicted objects. To evaluate this model on the image retrieval task, we create a flat tree by linking each object to a root node. For the image description task, we train an SMT model on a parallel corpus of bag-of-objectsFootnote 5 and COCO descriptions.
Tuples: Our second comparison model is the approach put forward in Ortiz et al. (Reference Ortiz, Wolff and Lapata2015) who represent visual scenes via tuples (see the example in Figure 1). Content selection in their model is implemented as an integer linear program which selects description-worthy pairs of objects using features such as their relative distance D s, t and their normalized co-occurrence frequency F s, t (see Section 4). To generate descriptions with this model, we adapt the pipeline described in Section 4.2, to the tuple-based framework. We create parallel data of visual tuples and descriptions from our cross-modal corpus of object–argument alignments and use it to train a phrase-based SMT model. We then run the integer linear program on each test image to obtain relevant object pairs whose interactions we wish to describe, convert them to visual tuples, and use the SMT model to transfer them to their verbalizations. For the image retrieval task, we transfer the tuples to trees in which two objects are direct children of their spatial relation. Tree kernel methods are then used to measure image similarity.
Templates: In our description generation experiments, we further compared against the template-based model of Elliot and deVries (Reference Elliott and de Vries2015) which generates a description for an image by filling in the template ‘DT o s is V DT o t’. The slot DT takes a determiner (a or an), o s and o t are filled with the class labels of the parent and child object nodes in the corresponding visual tree representation (e.g., os = dog and ot = frisbee). Slot V is filled with the verb v that maximizes the conditional probability: v* = arg maxp(v|head, child, sr), where sr is the spatial relation between the objects o s and o t (e.g., p(catch|dog, frisbee, very_close), p(eat|person, pizza, surrounds_above)). We used the parallel corpus described in Section 4.1 to derive these probability estimates. In cases where we cannot find a verb to fill slot V, we default to the spatial relation sr (e.g., surrounds or is near).
NIC: Finally, we compare our approach to description generation against the Neural Image Caption (NIC) model of Vinyals et al. (Reference Vinyals, Toshev, Bengio and Erhan2015).Footnote 6 We selected NIC as an example of Recurrent Neural Network-based approaches. It was also trained on COCO and performs reasonbaly well even against a nearest-neighbor (NN) baseline (Vinyals et al. Reference Vinyals, Toshev, Bengio and Erhan2015). The latter has proven very competitive on COCO due to the images being similar and as result giving rise to similar linguistic descriptions (Devlin et al. Reference Devlin, Gupta, Girshick, Mitchell and Zitnick2015). In Vinyal et al.’s approach, a convolution neural network (CNN) encodes an image into a compact representation, which is then fed to a long short-term memory decoder to generate a sentence. The long short-term memory is trained to maximize the likelihood of the correct description given the image.
VGG: For our image retrieval experiments, we employ a NN approach (Devlin et al. Reference Devlin, Gupta, Girshick, Mitchell and Zitnick2015) which finds the k NNs using cosine similarity and represents images with a 4,096-dimensional vector. The latter is extracted from the image activations from the penultimate layer of a pretrained CNN model (VGG-16, Simonyan & Zisserman (Reference Simonyan and Zisserman2014).
6.3 Parameter settings
All parameters, including the choice of spatial relations, the features for the content selection models, and the parameters for grounding PASs, were tuned on the COCO validation data. All SMT models were trained on the corresponding parallel corpus obtained from COCO. Six-gram SMT language models were trained on both Flickr30K descriptions (Young et al. Reference Young, Lai, Hodosh and Hockenmaier2014) and COCO descriptions with modified Kneser–Ney smoothing using KenLM (Heafield et al. Reference Heafield, Pouzyrevsky, Clark and Koehn2013).
6.4 Results
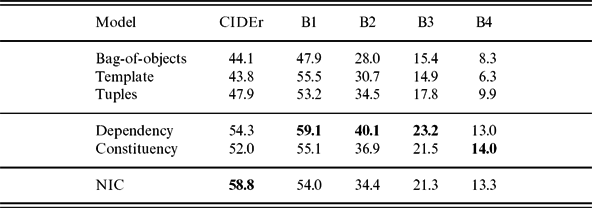
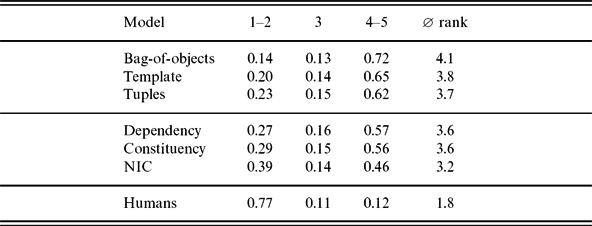
Image description generation: We measured the quality of the generated descriptions against reference captions using BLEU (Papineni et al. Reference Papineni, Roukos, Ward and Zhu2002) and CIDEr, a consensus-based metric developed specifically for image description evaluation (Vedantam, Zitnick and Parikh Reference Vedantam, Zitnick and Parikh2015).Footnote 7 We further evaluated system output against human judgments which we elicited for our COCO test fraction using Amazon’s Mechanical Turk. Participants were presented with an image (nine per task) and seven descriptions (two by our models, four by the comparison models, and one randomly selected reference description). They were asked to rank the descriptions from best to worst (1–5, ties were allowed) in order of informativeness and grammaticality. Participants were instructed to give low ranks (ranks 1 or 2) to descriptions which were grammatical and faithfully described the content of an image, and to penalize descriptions which focused on unimportant aspects. For every image, we collected ten ratings. Table 2 summarizes the results of the automatic evaluation. Overall, we observe that template, the only system that does not apply SMT methods, performs worst. Tuples, which exploits visual relationships, is more effective than bag-of-objects, which is based on object labels only. And the tree-based models, dependency and constituency, outperform all other symbol-based models. This indicates that structured representations exploiting visual relationships between objects are beneficial for verbalizing their interactions. NIC performs best according to the CIDEr metric. Although it does not explicitly encode spatial relationships, it benefits from its high-dimensional feature representations for visual and language content (i.e., CNN-based feature vectors for images and objects occurring in them, and text embeddings). The results of the human evaluation study follow a similar pattern in Table 3. Dependency and constituency are more often judged best or second-best (i.e., ranks 1 or 2) than the other symbol-based models (twenty-seven per cent and twenty-nine per cent of all generated descriptions, respectively), while NIC seems to have a lead. In most cases (seventy-two per cent of time) the output of bag-of-objects is judged second-worst or worst (i.e., ranks 4 or 5). None of the models, however, comes close to the human upper bound, where seventy-seven per cent of the sentences are judged best or second-best (last row in Table 3). Pairwise differences between all systems are statistically significant (using post-hoc Tukey tests; p < 0.01), except for constituency and dependency.
Model comparison on 208 COCO 2015 test images using automatic measures (B is a shorthand for BLEU)

All models except templates and NIC are SMT-based generation models, bag-of-objects and NIC do not use visual relations. Most effective model shown in bold.
Rankings given to systems by human subjects on 208 COCO 2015 test images

Rankings are shown as proportions of the total number of ratings per model (columns 2–4) and grouped into top (ranks 1–2), middle (rank 3), and bottom (ranks 4–5). The numbers do not sum to one as ties are allowed. The last column gives the mean rank computed across all annotators and images (lower is better).
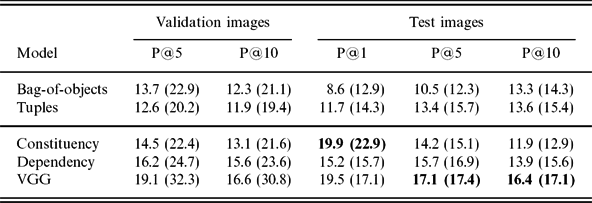
Image retrieval: We evaluated model performance using precision at rank k (P@k), the proportion of images among the top k which are annotated with the same predicate as the query image q i. We used the COCO 2014 validation dataset as our image collection $\mathcal {I}$, and extracted the verbal predicates which occurred in at least two descriptions per image, and were mentioned in at least five images. This resulted in sixty-one verb types associated with 868 images in total. Table 4 gives results on the COCO validation set $\mathcal {I}$, with each image of $\mathcal {I}$ as query, and on the test set (208 images). For the test set, we report P@1 in addition to P@5 and P@10. The two tree-based representations, dependency and constituency, are the overall most effective symbol-based models, they yield the highest precision (see Table 4). Interestingly, bag-of-objects performs better than tuples on the validation set, but worse than all other models on the test set. Furthermore, in terms of micro-averaged precision, bag-of-objects is comparable to constituency on the validation set. Recall that the test set is less homogeneous than the validation set, it was sampled so as to contain images depicting both common and uncommon object co-occurrences. This suggests that object labels are predictive of verbal predicates when they denote interactions between common objects (e.g., person cutscake) or typical actions of objects (e.g., airplanes fly), while structural representations based on visual relationships are more effective in encoding interactions between rarer objects. The comparison to the state-of-the-art image representations (VGG) corroborates this. As we would expect due to the nature of the dataset, VGG outperforms the symbol-based models in all settings except on the test set when considering only the top-ranked image (P@1, Table 4).
Macro-averaged precision on 868 COCO validation/208 COCO test images and sixty-one verb types

Numbers in parentheses are micro-average. Most effective model shown in bold.
6.5 Error analysis
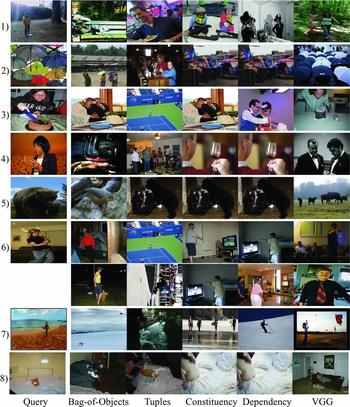
Image retrieval: We manually inspected the output of various image retrieval systems on the COCO test data. Figure 8 presents examples of typical errors we found. It shows eight query images (first column) and the one-best image retrieved for each system (columns 2 to 5; for Query 6 we show the two best images). Our analysis reveals that models which use symbolic image representations (i.e., the eighty COCO object class names; all models except for VGG) are susceptible to errors made by the object detectors (e.g., Queries 3 and 6 for Tuples, Query 7). Similarly, objects which are unknown to the detectors result either in detection errors or cannot be captured by the representations at all (e.g., the tree in Query 1). The effect of object detection is most pronounced in the bag-of-objects system which treats all objects equally, lacking any structural information, e.g., based on the spatial relations. For instance, representations for Query 5, which shows two bears walking beside each other, were built on the basis of the objects bear, bear, cell_phone, and bird, causing bag-of-objects to retrieve an image of a bird as its NN. Note that the image retrieved by VGG for Query 5 is visually similar, but does not depict bears either. Recall that VGG represents images by their CNN-based feature vectors, and does not directly rely on discrete object detections. Query 2 illustrates another source of typical errors for the structural approaches: They struggle with images which do not explicitly depict object (inter)actions. VGG is better at retrieving answers which are visually similar to the query, i.e., which depict visually similar objects and background scenes. But it has difficulty finding images which capture the same semantic content as object interactions depicted in the query. For example, Query 3 shows a person and a cake, which all models (except Tuples) get right. In VGG’s answer image, however, the person is not cutting the cake. For Query 5, VGG’s answer shows formally dressed people, but neither of them is holding a glass.
We also observe that for the given dataset (a collection $\mathcal {I}$ of 868 images; see Section 5), our relatively few spatial relations may be too fine-grained. For example, Query 1 was represented as a person being above_veryclose to a frisbee. $\mathcal {I}$, however, only contains an image of a person being above_close to a frisbee.
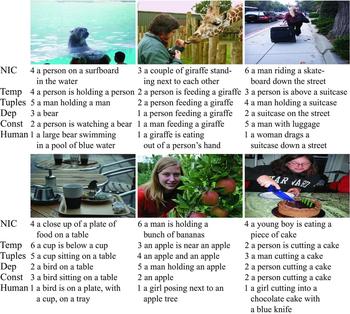
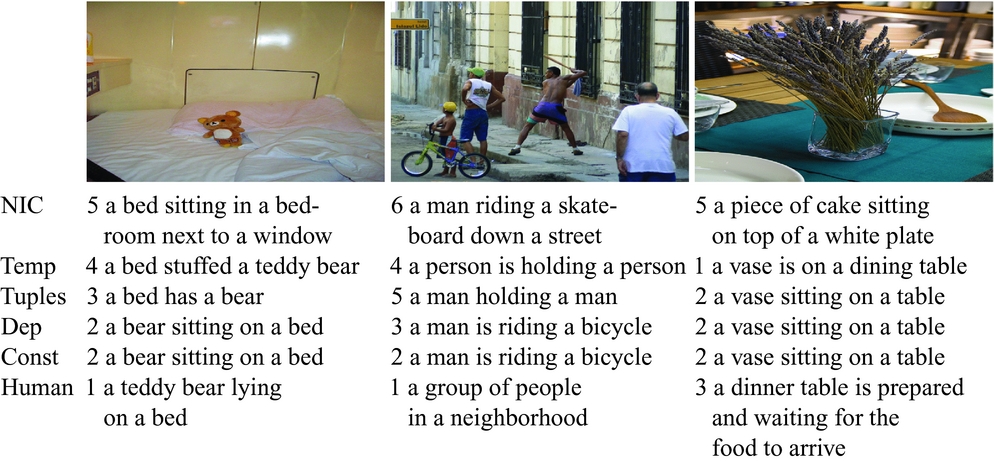
Description generation: Figures 6 and 7 provide examples of the systems’ output on the description generation task. As observed with the retrieval task, since all systems (except for NIC) use symbolic representations, they are affected by errors of the object detectors and propagated to the generated descriptions. Furthermore, since we focus on objects and their interactions and do not recognize attributes or scenes, descriptions produced by our models often contain less detail compared to human authored ones. For example, they do not mention parts of objects or attributes (see Figure 6 first image). Perhaps, unsurprisingly, SMT-based models tend to generate more fluent and natural descriptions than template (see Figure 6 first row, right-most column; Figure 7 first image). Constituency tends to be better than dependency in handling uncommon object co-occurrences for which it more often produces grammatical descriptions (see first image in Figure 6 left-most column), or verbalizes only parts of the representation.
Examples of system output. Numbers denote the relative rank given by AMT participants.

Examples of system output. Numbers denote the relative rank given by AMT participants.

As far as NIC is concerned, we observed that thirty-three per cent of the descriptions it generated are duplicates, i.e., they are identical with captions produced for other images. The proportion of duplicates is considerably less for other models, i.e., between nineteen per cent (tuples) and thirteen per cent (templates). An explanation for NIC’s high proportion of duplicates may be that it has a generation mechanism similar to retrieval-based captioning systems—it reproduces the captions from the training images which are visually very similar to the target image. We give an example for Query image 4 (which shows a woman holding a wine glass) in Figure 8. Recall that NIC receives the same input as the VGG retrieval model. For Query 4, NIC generated the description a couple of men standing next to each other, which turns out to be an accurate description of the image which was retrieved by VGG.
Query image (first column) and one-best image retrieved from the test data. The second column shows the output of the bag-of-objects baseline, the third column shows the output of the tuples baseline, and so own. For Query 6, we show the two best retrieved images.

7 Conclusions
In this paper, we focused on the problem of representing the semantics of images. We advocated the use of tree-based representations explicitly encoding the objects detected in images and their spatial relations. We proposed a deterministic procedure for constructing constituent and dependency tree representations and have shown how these can be used to develop models for image description generation and image-based retrieval. Experimental results demonstrate that tree-based representations are beneficial compared to structure-agnostic, symbol-based models. Constituency- and dependency-based models perform comparably. On balance, the former type of representation might be preferred as it is compositional and able to handle rare objects better. Compared to models whose immediate inputs are feature representations extracted from a CNN, our symbol-based models are not empirically stronger but are able to better capture the semantic content of image scenes in terms of participant interactions. An interesting avenue for future work would be to augment our tree-based framework with distributed object representations, or feed NN models with explicit structural information. We would also like to induce structural representations for images while training a model to perform a specific task such as visual question answering (Antol et al. Reference Antol, Agrawal, Lu, Mitchell, Batra, Lawrence Zitnick and Parikh2015) or image-based story generation (Huang et al. Reference Huang, Ferraro, Mostafazadeh, Misra, Agrawal, Devlin, Girshick, He, Kohli, Batra, Zitnick, Parikh, Vanderwende, Galley and Mitchell2016), and experiment with additional semantic representations such as logical forms (Deng et al. n.d.).