




No CrossRef data available.
Article contents
State-dependent executive deficits among psychopathic offenders
Published online by Cambridge University Press: 04 May 2005
Abstract
Three hypotheses for cognitive deficits among psychopaths were tested: Response modulation, left hemisphere activation, and an interaction between the 2. Twenty-six psychopathic and 32 nonpsychopathic criminal offenders identified with the Hare Psychopathy Checklist–Revised were randomly assigned to left- and right-hemisphere activation groups. An auditory processing task was administered, such that the ability to classify nonverbal auditory signals and the ability to manage subgoals were assessed under left- and right-hemisphere activation conditions. The results showed that psychopaths' information processing in general, including response modulation, was deleteriously affected by left-hemisphere activation, supporting 2 of the 3 hypotheses tested. These results offer an explanation for inconsistent findings of executive deficits among psychopaths. (JINS, 2005, 11, 311–321.)
Keywords
Information
- Type
- Research Article
- Information
- Journal of the International Neuropsychological Society , Volume 11 , Issue 3 , May 2005 , pp. 311 - 321
- Copyright
- © 2005 The International Neuropsychological Society
INTRODUCTION
Psychopathy is a disorder characterized by a pervasive pattern of impulsive and antisocial behaviors, failure to follow a life plan, and failure to adopt appropriate adult roles in occupational and social/interpersonal domains (Cleckley, 1976). These maladaptive behaviors have been hypothesized to be due to psychophysiological abnormalities, such as autonomic under-reactivity (e.g., Arnett et al., 1993), as well as deficits in neurocognitive functions (e.g., LaPierre et al., 1995). This paper examines two hypotheses proposed by prior researchers in efforts to identify brain-based underpinnings of psychopaths' maladaptive behaviors: (1) deficits associated with a dysfunction in the executive system, and (2) deficits associated with left-hemisphere activation.
Deficits Associated With a Dysfunction in the Executive System
A number of studies using traditional neuropsychological instruments have suggested that psychopaths might be characterized by deficits in executive abilities (e.g., Hiatt et al., 2004). Additionally, studies that rely on experimental paradigms have also shown psychopathic offenders to perform more poorly than nonpsychopathic offenders on a variety of tasks that require behavioral control or management of competing contingencies (Newman & Kosson, 1986; Newman & Schmitt, 1998). Arguably the most prominent conceptualization of these executive difficulties is referred to as the response modulation hypothesis (Newman et al., 1990; Patterson & Newman, 1993).
The response modulation (RM) hypothesis
According to the RM hypothesis, psychopaths seem to attend and respond normally to those stimuli (or stimulus dimensions) that are directly related to the primary goal of the task, while failing to respond normally to subgoals, or secondary stimulus dimensions (Wallace et al., 1999). As a real life example, a psychopath may focus on the primary goal of driving to a particular location in a fast and efficient manner, while failing to attend to the secondary goal of observing the speed limit. Such deficits, however, appear to emerge only under certain reward/punishment contingencies (e.g., Newman & Kosson, 1986; Newman et al., 1990). In other words, a psychopath may fail to respond to the punishment of a speeding fine, but only when a concrete reward for fast driving is offered.
Problems with the RM hypothesis
In reviewing the literature on cognitive functioning in psychopaths, Kosson and Harpur (1997) concluded that psychopaths' cognitive deficits in general (and perhaps RM deficits in particular) appear to be highly situation-specific. In particular, in several studies, psychopaths have performed as well as nonpsychopaths on a number of executive and divided attention/working memory tasks (e.g., Hare, 1984; Hart et al., 1990) except when conditions placed differential demands on left-hemisphere-specific processing resources (Howland & Newman, 1993; Kosson, 1996, 1998). This contingency on situational demands, along with additional experimental evidence (outlined below), has served as the impetus for the formulation of the left hemisphere activation hypothesis.
Deficits Associated With Left Hemisphere Activation (LHA)
According to the LHA hypothesis (Kosson, 1998), psychopaths' deficits in cognitive processing are state-specific, occurring only under conditions that selectively and differentially activate left hemisphere resources. It should be noted that this hypothesis does not imply a specific deficit in cognitive abilities associated with left-hemisphere processing. In fact, psychopathic inmates perform as well as nonpsychopathic inmates on some left-hemisphere tasks (Hare & Jutai, 1988). Rather, the LHA hypothesis predicts that information processing in general (i.e., not specifically that subserved by the left hemisphere) is disrupted among psychopaths when left hemisphere resources are substantially and differentially activated by processing demands (Kosson, 1998). It should also be noted that differential activation of the left hemisphere may result from processing demands that are relatively incidental to a given task, such as responding differentially with the right hand (Kosson, 1996), or attending disproportionately to the right visual field (Hare & Jutai, 1988).
To date, three studies (Kosson, 1998; Kosson et al., 2003; Llanes & Kosson, in press) have provided direct corroboration of the LHA hypothesis by making a priori predictions that information processing would be disrupted among psychopaths under LHA conditions (invoked by presenting relatively more “left-hemisphere” than “right-hemisphere” targets).
Problems with the LHA hypothesis
The LHA hypothesis is rather nonspecific regarding the exact nature of predicted deficits. In fact, investigations of the LHA hypothesis have yielded a somewhat different pattern of results, with some showing a bilateral impairment (Kosson, 1998), and others showing a unilateral impairment (Kosson et al., 2003; Llanes & Kosson, in press). Although these findings may reflect the poorer discriminating power of some task components, it is also possible that other situational factors interact with LHA. Further evidence for such an interaction is provided by Bernstein and colleagues (2000).
Hypothesis of an Interaction Between Executive Dysfunction and Left Hemisphere Activation
Recently, Bernstein et al. (2000) provided evidence that RM deficits among psychopaths may be specific to LHA conditions, and, conversely, that LHA conditions may lead to deficient RM. In their study, psychopaths performed more poorly than nonpsychopaths only on those task components that targeted RM under LHA. In other words, this study demonstrated a Left Hemisphere Activation × Response Modulation (LHA × RM) interaction, suggesting that neither the LHA nor RM alone may be sufficient to account for some behavioral deficits exhibited by psychopaths. Such an interaction could also explain why LHA appears to result in a variety of deficit patterns: Impairment may occur on those trials requiring the greatest executive control.
Problems with the LHA × RM hypothesis
First, Bernstein et al.'s (2000) study used a design that was not fully parallel to that used in Kosson's previous studies, permitting alternative explanations for performance.1
Bernstein et al.'s (2000) comparison between LVF and RVF stimuli differs from those in prior studies designed to test the LHA hypothesis. In several prior studies, task demands were manipulated so that LHA conditions presented more targets to the left than to the right hemisphere. In contrast, Bernstein et al. (2000) presented an equal frequency of targets in the RVF and LVF, and compared performance on RVF versus LVF stimuli. Such a design, however, was referred to as “equal activation” and employed as a control condition by Kosson (1998; Llanes & Kosson, in press). The equal frequency of words in the RVF and LVF appears likely to lead to equal activation of left hemisphere and right hemisphere resources, unless bilateral visual presentation of words itself produces asymmetric activation.
The Current Study
The purpose of the present study was to test simultaneously the three hypotheses outlined above (RM, LHA, and LHA × RM), with the goal of determining which of these hypotheses best characterize cognitive deficits among psychopaths. To that end, we selected an auditory processing task in which we could manipulate (1) the need to suspend a primary task to attend to a subgoal (i.e., RM), and (b) the degree to which demands were placed on the left versus right hemisphere (i.e., LHA). The task was loosely based on paradigms used in Kosson (1996, 1998): Participants were asked to classify target tone sequences based on the overall contour, while also avoiding responses to distractors (which were grossly different from targets in their overall pitch). Because availability of rewards/punishments seems to be an important ingredient in eliciting RM deficits in psychopaths (e.g., Newman & Kosson, 1986; Newman et al., 1990), participants earned money for fast and accurate performance and lost earnings for inaccurate responses.
The RM hypothesis
In order to test the RM hypothesis, participants were faced with the competing demands of responding to targets as fast and accurately as possible while at the same time avoiding responding to distractors. Because participants were rewarded (1–3 cents per response) for fast and accurate classification of tone sequences, this portion of the task represented the primary goal. In other words, if aiming to earn money, participants needed to attend to this goal above others. On the other hand, correctly avoiding distractors was not associated with rewards, and as such represented a secondary goal. It should be noted that although participants were punished (lost 1 cent) both for incorrect classifications and for responding to distractors, these punishments were equal for both the primary and the secondary goals, and as such did not affect the salience of one goal over the other. Given these contingencies, this task required participants to suspend their primary goal (i.e., classifying tone sequences based on overall contour) in order to briefly shift attention to the subgoal (i.e., detecting the overall pitch so as to differentiate between targets and distractors). Participants who were deficient at RM could be expected to erroneously respond to distractors as though they were targets. Thus, the RM hypothesis predicts that psychopaths should make more commission errors than nonpsychopaths. These errors should occur irrespective of the hemispheric activation (HA) manipulation, which is described in more detail below.
The LHA hypothesis
In order to test the LHA hypothesis, the frequency of demands on the left versus right hemisphere was manipulated. Participants in the LHA condition received 67% of the targets in the right ear (and 67% of the distractors in the left ear). Because participants responded with hands that were ipsilateral to the ear that received the tones, the LHA condition participants were required not only to classify tone sequences played in their right ear twice as frequently as tone sequences played in their left ear, but also to respond roughly twice as often with their right hand as with their left hand. The opposite was true for the right hemisphere activation (RHA) participants. The asymmetries in both perceptual and motor demands were expected to contribute to differential hemispheric activation in the two conditions (e.g., Rizzolatti & Craighero, 1998; Robertson & North, 1993). If psychopaths are characterized by deficits that are specific to LHA conditions, they should perform more slowly and make more commission and classification errors than nonpsychopaths under LHA conditions, but perform equally well as nonpsychopaths under RHA conditions.
The LHA × RM hypothesis
If psychopaths are characterized by deficits in RM that are specific to LHA conditions, then they should exhibit a pattern of performance suggestive of RM (i.e., commission errors), but this pattern should be observed only for participants in the LHA condition, with no differences between groups in the RHA condition. Moreover, if psychopaths are characterized only by LHA × RM deficits, they should exhibit only commission errors, not other deficits, under LHA conditions.
Methods
Research Participants
Participants were 58 male inmates recruited from the Lake County Jail in Waukegan, Illinois. The selection of participants consisted of a two-step process. First, male inmates were invited to participate in a diagnostic interview if they met the following criteria: 18 to 39 years old, convicted of a felony, able to understand and speak English, free of psychotropic medication or any medication with known neurocognitive side-effects, and free of bizarre, unusual, overtly psychotic, or dangerous behaviors as perceived by jail personnel. Following this initial screening, inmates providing written consent participated in an extensive semi-structured interview (assessing psychopathy and substance abuse) and completed self-report questionnaires (assessing handedness, intellectual functioning, and anxiety). These procedures yielded 101 potential participants. In the second step, participants were included in the study if they (1) had a Psychopathy Checklist–Revised (PCL–R) total score of 30 or above, in which case they were classified as psychopathic (P), or a PCL–R score of 21 or below, in which case they were classified as nonpsychopathic (NP)2
A variety of different PCL–R cutoffs have been used to ensure that nonpsychopathic inmates are distinct from psychopathic inmates on the dispositions measured by the PCL–R. Although some studies have included as nonpsychopaths individuals with scores as high as 24 (e.g., Williamson et al., 1991), the majority of psychopathy studies conducted in correctional institutions have used cut-offs of 20 (e.g., Hare, 1991) to 22 (e.g., Newman et al., 1997). In the current study, a cut-off of 21 was employed so as to optimize the sample size in each randomly assigned group.
This two-step selection process resulted in 26 P (15 White and 11 African American) and 32 NP (21 White and 11 African American) participants. These participants were randomly assigned to one of two experimental conditions, with 12 P and 19 NP in the LHA condition and 14 P and 13 NP in the RHA condition. In order to ensure that experimenters remained blind to psychopathy classification, random assignment to experimental conditions was accomplished by alternating between LHA and RHA administration across all participants. This procedure resulted in uneven cell sizes for P and NP participants. Participant characteristics are summarized in Table 1. Ethnicity, HA condition, and psychopathy, alone or jointly, were unrelated to age or FSIQ estimate (all Fs < 1.8). WAS scores were unrelated to ethnicity and psychopathy (Fs < 3.1), but exhibited, due to a random sampling error, a relationship with HA condition, F(1,43) = 9.24, p = .004.
Demographic characteristics of the sample

Instruments
Psychopathy Checklist–Revised (PCL–R; Hare, 1991)
The PCL–R is the instrument of choice for assessing psychopathy (Hare, 1991). The PCL–R is a 20-item rating scale shown to have excellent validity and reliability. Items address prominent characteristics of psychopathy, such as callousness, sexual promiscuity, irresponsibility, and criminal versatility. The PCL–R was completed based on a combination of information obtained from available records and from a detailed interview with inmates addressing childhood, relationships with family and friends, and occupational, educational, sexual, and criminal histories.
Shipley Institute of Living Scale–Revised (SILS; Zachary, 1986)
The SILS was used to estimate Full Scale IQ. This measure consists of 40 recognition vocabulary items and 20 verbal analytical reasoning items and contains well-validated normative tables for converting composite scores into Wechsler Adult Intelligence Scale–Revised (WAIS–R) Full Scale IQ estimates.
Handedness Questionnaire (Chapman & Chapman, 1987)
This questionnaire consists of 13 questions about which hand the individual typically uses during a variety of fine and gross motor activities and correlates highly with behavioral measures of handedness.
Welsh Anxiety Scale (WAS; Welsh, 1956)
The WAS is a self-report measure of general trait anxiety widely used in psychopathy studies (Newman et al., 1997; Schmitt & Newman, 1999).
Task
The dichotic listening task (DLT) employed in this study was similar to the auditory task described in detail by Kosson (1996). A computer program written for this study and administered via an IBM compatible computer controlled stimulus presentation and response acquisition. On each trial, two tone sequences were presented simultaneously via headphones, one in each ear. Some of the tone sequences were relatively low in overall pitch (frequencies ranging from 140 Hz to 351 Hz) and were designated targets, whereas other tone sequences were substantially higher in their overall pitch (frequencies ranging from 740 Hz to 1160 Hz) and were designated distractors. Both targets and distractors consisted of sequences of four pure tones that were either constant in pitch, monotonically ascending in pitch, or a mixture of constant and ascending sequences (e.g., two tones of equal pitch followed by two tones of progressively higher pitch). Each tone lasted 500 ms, with 50 ms of quiet between successive tones. Pitch increments were 70 Hz for ascending and mixed tones. Response latencies were measured from the beginning of the sequence to allow registration of early responses. Each sequence lasted 2150 ms. Participants were given up to 7000 ms to classify tones, followed by a response-stimulus interval of 3000 ms. In order to avoid startle responses at the onset of each tone sequence, sequences began with a 50 ms ramp-up period, and amplitude was set at a comfortable listening level (approximately 70 dB) and kept constant for all participants. Participants were asked to ignore distractors and to classify targets as either constant, ascending, or mixed by pressing keys on the keyboard labeled to indicate the three stimulus categories. Participants earned 3, 2, and 1 cents for each correct response faster than 3000 ms, 5000 ms, and 7000 ms, respectively, and lost one cent for each incorrect response. Feedback regarding earnings was provided on the computer screen after each trial. Cutoffs were based on piloting and were designed so that the majority of participants earned the maximum reward on fewer than approximately 1/3 of their responses.
Each participant completed 50 trials, which consisted of 49 targets and 51 distractors. However, the relative distribution of targets and distractors presented to the two ears differed for the two HA conditions. In the LHA condition, 66% of the tone sequences (33 sequences) played in the right ear consisted of targets, whereas only 32% of tone sequences (16 sequences) played in the left ear consisted of targets. These percentages were reversed for the RHA condition. There were 10 trials containing only distractors (i.e., no target was presented in either ear), and nine trials containing only targets (i.e., each ear received a target). For the remainder of the trials, one ear received a target and one ear received a distractor. Participants were informed that zero, one, or two target sequences could be presented on each trial, and were asked to classify right-ear targets with the right hand and left-ear targets with the left hand. Thus, participants in the LHA condition used their right hand approximately twice as often as their left hand, and those in the RHA condition used their left hand approximately twice as often as their right hand.
Procedures
Eligible inmates who participated in screening and interview procedures (described in “Research Participants”) were re-contacted on a separate day by an examiner blind to their psychopathy ratings and invited to participate in behavioral testing. Interested inmates provided additional informed consent in writing and were administered the DLT individually in a small program room at the jail. The testing session lasted approximately 90 min and included other behavioral tasks unrelated to the present study. Breaks were provided both during and after each behavioral task. The current task was preceded by single-ear practice trials. Only participants who classified at least 40% of these practice trials correctly (i.e., significantly above chance) were included in the study. Response latency for correct classifications, number of classification errors and number of commission errors were recorded. Classification errors referred to incorrect responses to the target presented to each ear, such as classifying an ascending sequence as a flat sequence. Commission errors referred to any responses to distractors.
RESULTS
Preliminary Analyses
Effects of ethnicity
Preliminary analyses of variance (ANOVAs) were conducted to address whether ethnicity should be considered in analyses of error data or response latency. Psychopathy group and ethnicity were between-subjects factors. Because no Psychopathy × Ethnicity interactions were obtained (both Fs < 1), subsequent analyses collapsed across ethnicity.
Effects of anxiety
Because prior research on response modulation suggests that anxiety may be an important moderator variable, the WAS was administered with the expectation of considering anxiety as a possible covariate. Unfortunately, as a consequence of random assignment to conditions, both P and NP participants assigned to the RHA condition reported more anxiety symptoms than participants assigned to the LHA condition [t(49) = 3.30, p = .002]. Although analysis of covariance (ANCOVA) is generally not recommended when the groups differ on the covariate (Miller & Chapman, 2001), such analysis can still provide some, albeit limited, information about the effects of the covariate. Further examination of the data demonstrated that the ANCOVA assumption of parallel regression surfaces was met for response latency and commission errors, but not for classification accuracy. Considering all these issues, we chose first to conduct comparisons that did not consider the effect of anxiety, and next to follow up with ANCOVAs where appropriate (i.e., for response latency and commission errors).
Hemispheric differences in tonal processing
Because prior research has suggested that P inmates may be characterized by abnormal hemispheric specialization (for a review, see Hare, 1998), and because individual differences in asymmetry could confound an examination of left hemisphere activation effects, we first analyzed the data collapsing across all target stimuli (i.e., across all manipulations) played into the left ear versus the right ear. Two-way mixed model ANOVAs, using ear (left vs. right) as a within-subjects factor and group (P vs. NP) as a between-subjects factor yielded no evidence of Group × Ear interactions for response latency or for error data (both Fs < 1.2), indicating that psychopaths' performance on this task was not characterized by unusual lateralization.
Tests of design assumptions
Only NP participants were included in tests of design assumptions, so as to avoid confounding possible deficient processing among psychopaths with the effectiveness of the experimental manipulation. It was expected that RHA would facilitate the normal right-hemisphere (i.e., left ear) advantage for tonal processing, whereas LHA would diminish this advantage. As a result, it was expected that the RHA group would perform better than the LHA group on left-ear targets (see the dotted line in Figure 1). This expectation was confirmed with an independent t test that revealed better accuracy for left-ear targets in the RHA group than in the LHA group [t(29.6) = 2.22, p = .034, d = .79]. As an additional check, we also conducted paired t tests between left- and right-ear stimuli, separately for LHA and RHA groups. We expected a better performance for the left-ear stimuli in the RHA group and for the right-ear stimuli in the LHA group. Although the effect sizes yielded by these analyses were small (d = .24 for right-ear advantage in the LHA condition and d = .31 for left-ear advantage in the RHA condition) and nonsignificant, their direction was consistent with expectations (see Figure 1).

Mean response accuracy (percent correct) for left- and right-ear targets under left- and right-hemisphere activation for nonpsychopaths only.
Principal Analyses
Because commission errors were grossly non-normally distributed, evident by visual inspection of the data as well as the skewness coefficient (sk = 1.01, p < .01), we first conducted a log10 transformation, which resulted in a normal distribution. The transformed variable is referred to as the commission error transform (CE-Tr).
In order to evaluate the RM, LHA, and LHA × RM hypotheses concurrently, three sets of planned comparisons were conducted: (1) the RM hypothesis was tested by comparing P and NP participants on CE-Tr, conducted for the entire sample, (2) the LHA × RM hypothesis was tested by comparing P and NP participants on CE-Tr, conducted separately for the LHA and RHA conditions, and (3) the LHAhypothesis was tested by comparing P versus NP participants on overall classification accuracy and response latency, conducted separately for the LHA and RHA conditions.
Commission errors (CE-Tr)
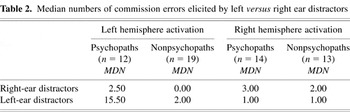
Consistent with the LHA × RM hypothesis, only P participants in the LHA condition were characterized by a high number of commission errors [t(28.7) = 2.26, p = .032, d = .84], with no difference between the groups under RHA condition (t < 1). When LHA and RHA conditions were combined, P and NP again did not differ on the CE-Tr variable [t(56) = 1.44, p = .155, d = .38]. In order to examine possible effects of anxiety, we repeated these analyses with an analysis of covariance (ANCOVA), using CE-Tr as the dependent variable, psychopathy group as the independent variable, and anxiety score (WAS) as the covariate. These analyses yielded similar results: There was no differences between P and NP participants in the RHA condition (F < 1), or when conditions were combined [F(1,48) = 1.88, p = .177, d = .39], and there was a trend for more commission errors among P participants under LHA conditions [F(1,27) = 3.13, p = .088, d = .68]. The contribution of anxiety to this model was not statistically significant [F(1,27) = 1.39, p = .249]. Means of logarithmically transformed data can be found in Figure 2a. Because the transformed data do not allow the reader to appreciate the actual frequency of commission errors in each group, and because the use of means is not appropriate with highly skewed data, we present the median numbers of raw commission errors in Figure 2b. Median numbers of commission errors by ear of distractor presentation can be found in Table 2.

(a) Mean of logarithmically transformed commission errors per group. (b) Median number of commission errors per group.
Median numbers of commission errors elicited by left versus right ear distractors

Classification response latency and accuracy
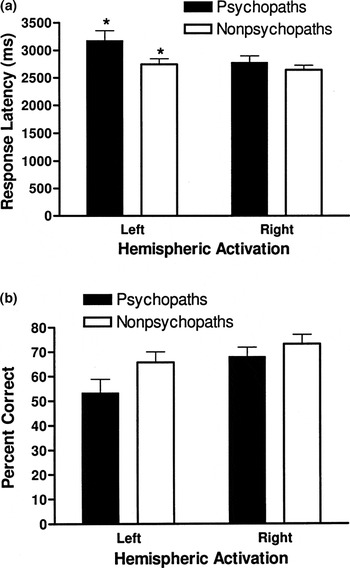
Planned comparisons (P vs. NP, separately under LHA and RHA) showed that, consistent with the LHA hypothesis, P participants in the LHA condition performed more slowly than NP participants [t(29) = 2.63, p = .013, d = .98], with no differences between P and NP participants under RHA conditions (t < 1). Although examining possible effects of anxiety using ANCOVA decreased this effect [F(1,27) = 2.83, p = .104, d = .64] and demonstrated a significant contribution of anxiety to the model [F(1,27) = 9.48, p = .005], the overall pattern of findings again held, as there was no difference between the groups in the RHA condition (F < 1).
Finally, planned comparisons failed to yield reliable classification accuracy differences between P and NP participants under LHA conditions [t(29) = 1.67, p = .105], or under RHA conditions [t(25) = 1.56, p = .131], with virtually identical medium effect sizes under each condition (both ds = .62), demonstrating no effect of hemispheric activation on performance accuracy. See Figures 3a and 3b for mean response latencies and accuracies.

(a) Mean response latencies and standard errors of the mean. * denotes statistically significant differences between groups. (b) Mean response accuracies (percent correct) and standard errors of the mean.
Follow-up Analyses
Because response latency and accuracy analyses yielded different patterns of results, we computed Pearson correlations between response latency and accuracy to examine the possibility of speed–accuracy trade-offs. As Table 3 shows, there was no evidence of any speed–accuracy trade-off, either overall or when examining P and NP participants separately. The negative correlations indicate that participants who performed more accurately generally also performed faster.
Correlation coefficents between percent correct, response latency (RL), and commission errors (CE-Tr)

Additionally, we examined whether excessive over-responding to distractors made the task more difficult for some participants. In particular, participants who made more commission errors obviously responded, on some trials, to two stimuli instead of one, which could have slowed down their performance and could have caused them to make less accurate classifications. In order to determine whether over-responding to distractors may have contributed to slower or less accurate performance, we computed Pearson product correlations between CE-Tr, response latency and accuracy data. These correlations (see Table 3) show that participants who tended to over-respond to distractors also made more classification errors, suggesting that those participants who make one type of error also make other types of errors. Table 3 also reveals a correlation between response latency and over-responding to distractors (particularly for P participants), suggesting the possibility of a mild slowing which could be due to inappropriate responding to a greater number of stimuli.
Finally, because over-responding to distractors may have weakened the HA manipulation for those participants who were usually attending to sequences in both ears, we removed all participants who made 26 or more commission errors (i.e., those who responded to at least half of the 51 distractors presented). This led to a removal of 13 participants, four each per group except for the RHA NP group, which lost 1 participant. We re-examined the effect of HA on CE-Tr with this smaller sample. The results were again consistent with the LHA × RM hypothesis, with psychopaths exhibiting deficits in the LHA condition [t(21) = 2.33, p = .030, d = 1.02], but not in the RHA condition, (t < 1). The fact that CE-Tr results were unchanged by the removal of these participants suggest that our results were not compromised by over-responding to distractors.
DISCUSSION
The present study examined three hypotheses regarding neurocognitive dysfunction among criminal psychopaths: the left hemisphere activation hypothesis (LHA), the response modulation (RM) hypothesis, and the interaction between LHA and RM. The results are largely consistent with the LHA hypothesis, in that P participants in the LHA group had longer response latencies and made more commission errors than NP participants. In contrast, a reliable RM main effect for P participants was not found. However, differences between P and NP participants in overall classification accuracy were not evident, suggesting that LHA-related effects are not pervasive. Similar nonpervasive LHA-related deficits among P participants were found in prior studies (Kosson 1996; Kosson et al., 2003; Llanes & Kosson, in press) and may partly reflect the differential discriminating power of different task components, especially where sample sizes are relatively small.
Although the present results contribute to a growing body of evidence that psychopathy may be characterized, among others, by deficits that become apparent only when the left hemisphere is differentially activated, current results do not specify the mechanism that undergirds this relationship. We offer one hypothetical explanation that is consistent with some clinical features of psychopathy and might warrant further investigation.
This explanation is based on the theoretical view that differential activation of the two cerebral hemispheres may lead to a relative interhemispheric inhibition of the hemisphere that is somewhat less activated (Shevtsova & Reggia, 1999; Sil'kis & Bogdanova, 1998). If psychopaths are characterized by an abnormally strong tendency to inhibit the right hemisphere when the left hemisphere becomes differentially activated, then they may experience phasic deficits in right-hemisphere processing. Because right hemisphere processing includes attention to discrepancies, insight regarding own behavior, awareness of autonomic responses, and recognition of affect in others (Lezak, 1995, pp. 66–68), deficits in these abilities would be consistent with some core features of psychopathy. In fact, such anomalies have been reported in psychopathic offenders and in related samples (e.g., Blair et al., 2001; Kosson et al., 2002). However, this interpretation would require that a more generalized impairment in right-hemisphere processing be observed during LHA, including a deficit in visual–spatial abilities. Although this hypothesis has thus far not been directly tested, the present results provide a tentative support. In particular, as can be seen in Table 2, psychopaths' difficulties with identifying distractors during the LHA condition were particularly prominent for left-ear (right-hemisphere) stimuli, consistent with a decrease in right-hemisphere processing during LHA.
Alternatively, the follow-up analyses in this study suggested that slower responding under LHA conditions may have been secondary to a decrease in RM ability, which led to over-responding to distractors and thus made the task more difficult. This possible interaction between executive functioning and hemispheric activation may help explain why prior research on executive deficits among psychopaths has been somewhat equivocal (e.g., Morgan & Lilienfeld, 2000). For example, prior research has demonstrated that RM deficits among psychopaths are more likely to occur under specific reward conditions (Newman & Kosson, 1986). Similarly, although psychopaths have been shown to perform normally on the Wisconsin Card Sorting Test (Hare, 1984), Howland and Newman (1993) found that psychopaths' performance on this task became impaired when feedback after each trial was supplemented with concrete rewards and punishments. Given that past research (e.g., Thut et al., 1997; Zalla et al., 2000) has shown that presentation of rewarding stimuli is associated with a greater left than right hemisphere activation, these findings are consistent with the present results and with the LHA × RM hypothesis. Additionally, these findings also have implications for an important clinical feature of psychopathy, i.e., the dramatic variability in the conduct (Cleckley, 1976, p. 341). In particular, the clinical relevance lies in the premise that LHA occurs in real-life appetitive/approach situations (e.g., Sutton & Davidson, 2000), and it is during these situations that psychopaths may exhibit cognitive and judgment deficits that they do not exhibit otherwise.
The current study yielded no evidence of Psychopathy × Ethnicity interactions, consistent with other evidence that LHA deficits occur in both White and in African American psychopathic offenders (Kosson, 1998; Llanes & Kosson, in press; Lopez et al., 2004). However, it is noteworthy that in some prior studies only White psychopaths displayed RM deficits (e.g., Kosson, 1998; Newman & Schmitt, 1998). Given these inconsistent findings, additional examination of the generalizability of RM deficits in African American psychopaths is warranted.
Limitations of the Present Study
One weakness of the present study is the relatively small sample size of the groups. Data collection with psychopathic populations is typically a protracted process due to the need to invest much time and resources into identifying psychopathic participants, and many studies that use this population are characterized by sample sizes comparable to those used in our study (e.g., Dinn & Harris, 2000; Howard et al., 1997; Newman & Schmitt, 1998).
Additionally, the present study did not allow sufficient examination of possible effects of anxiety as random sampling resulted in an uneven distribution of anxiety scores between the two manipulation conditions. Using anxiety as a covariate slightly decreased the effect of LHA on RM while not demonstrating a reliable main effect of anxiety, suggesting that anxiety in fact did not play a major role in the LHA × RM results. Anxiety did contribute significantly to variation in response latency and led to a somewhat more substantial decrease in the LHA effect, although it did not alter the pattern of results; psychopathy still yielded a moderate effect (d = .68) in the LHA condition but not in the RHA condition. Given that the groups differed on the covariate, a decrease in the effect cannot be unequivocally interpreted. Thus, it remains possible that some of the group differences reported here reflect effects of anxiety, and the possible impact of anxiety on executive function in psychopaths should be re-examined in future research.
In addition to limitations related to the characteristics of the sample, the present design does not allow clear determination of whether the observed RM deficits are a result of impulsive responding to distractors, or a failure to shift between the two dimensions of the stimuli (i.e., the overall pitch and the contour). However, given that the stimuli in this study were rather complex and required relatively in-depth processing prior to response, indiscriminate impulsive responding appears relatively unlikely.
Additionally, because of the complexity of the present design, participants who overresponded to distractors may have exhibited slower responding due to additional, albeit self-imposed, processing demands (i.e., when distractors were treated as targets, some single target trials de facto became dual target trials). In order to address this issue, we re-examined commission errors after participants who over-responded to more than one-half of the distractors were removed. The results revealed that LHA × RM still held. However, the complexity of the present design still precludes us from determining whether LHA directly led to an increase in response latency, or whether this result was mediated by overresponding to distractors due to an LHA × RM interaction. Although the correlation between commission errors and response latency was relatively small (Table 3), it is possible that LHA × RM may have been responsible for slower speed. As a result, a less complex design that would avoid this potential complication would be warranted for future replication of the study.
Finally, we cannot be certain that P participants exhibited the same levels of motivation as NP participants. However, given that differences between P and NP groups were only present under LHA conditions, that participants were paid based on their performance, and that current results replicate prior findings of LHA deficits under conditions in which participants were paid, poor motivation was not a likely factor in the present results.
CONCLUSIONS
The present study provides additional evidence for state-dependent deficits in dual-task performance in P participants. Current findings corroborate the deleterious effects of LHA on information processing among P participants, relative to that of NP participants. It is unclear from the present study whether some deficits observed under LHA are due to a more global disruption of information processing, or whether they are secondary to a more specific disruption of executive abilities, which in turn affect performance on a variety of task components.
ACKNOWLEDGMENTS
The research and preparation of this article were supported in part by Grants MH49111 and MH57714 from the National Institute of Mental Health to David S. Kosson. The study was approved by IRB. We thank Charles de Filippo, Patrick Firman, and the staff of the Lake County Jail in Waukegan, Illinois for their consistent cooperation and support during the conduct of this research. We also thank Nick Doninger for assistance in coding some of the data and Carolyn Abramowitz, Maria Banderas, Katherine Aires-Byrnes, Seoni Llanes, Andrew Mayer, and Sarah Miller for interviewing the inmates and administering the experimental task.
References
REFERENCES
Arnett, P.A.,
Howland, E.W.,
Smith, S.S., &
Newman, J.P.
(1993).
Autonomic responsivity during passive avoidance in incarcerated
psychopaths.
Personality and Individual Differences,
14,
173–184.Google Scholar
Bernstein, A.,
Newman, J.P.,
Wallace, J.F., &
Luh, K.E.
(2000).
Left-hemisphere activation and deficient response modulation in
psychopaths.
Psychological Science,
11,
414–418.Google Scholar
Blair, R.J.R.,
Colledge, E.,
Murray, L., &
Mitchell, D.G.V.
(2001).
A selective impairment in the processing of sad and fearful
expressions in children with psychopathic tendencies.
Journal of Abnormal Child Psychology,
29,
491–498.Google Scholar
Chapman, L.J. &
Chapman, J.P.
(1987).
The measurement of handedness.
Brain and Cognition,
6,
175–183.Google Scholar
Cleckley, H.
(1976).
The mask of sanity (5th edition).
St. Louis, MO:
Mosby.
Dinn, W.M. &
Harris, C.L.
(2000).
Neurocognitive function in antisocial personality disorder.
Psychiatry Research,
97,
173–190.Google Scholar
Hare, R.D.
(1984).
Performance of psychopaths on cognitive tasks related to frontal
lobe functions.
Journal of Abnormal Psychology,
93,
133–140.Google Scholar
Hare, R.D.
(1998).
Psychopathy, affect, and behavior. In
D.J. Cooke,
A.E. Forth, &
R.D. Hare (Eds.),
Psychopathy: Theory, research and implications for society
(pp.
105–137).
Boston:
Kluwer Academic.
Hare, R.D.
(1991).
The Hare Psychopathy Checklist–Revised.
North Tonawanda, NY:
Multi-Health Systems.
Hare, R.D. &
Jutai, J.W.
(1988).
Psychopathy and cerebral asymmetry in semantic processing.
Personality and Individual Differences,
9,
329–337.Google Scholar
Hart, S.D.,
Forth, A.E., &
Hare, R.D.
(1990).
Performance of criminal psychopaths on selected neuropsychological
tests.
Journal of Abnormal Psychology,
99,
374–379.Google Scholar
Hiatt, K.D.,
Schmitt, W.A., &
Newman, J.P.
(2004).
Stroop Tasks reveal abnormal selective attention among psychopathic
offenders.
Neuropsychology,
18,
50–59.Google Scholar
Howard, R.,
Payamal, L.T.,
Neo, L.N.
(1997).
Response modulation deficits in psychopaths: A failure to confirm
and a reconsideration of the Patterson-Newman model.
Personality & Individual Differences,
22,
707–717.Google Scholar
Howland, E.W. &
Newman, J.P.
(1993).
The effect of incentives on Wisconsin Card Sorting Task performance
in psychopaths.
Unpublished manuscript. Madison, WI:
University of Wisconsin.
Kosson, D.S.
(1996).
Psychopathy and dual-task performance under focusing
conditions.
Journal of Abnormal Psychology,
105,
391–400.Google Scholar
Kosson, D.S.
(1998).
Divided visual attention in psychopathic and nonpsychopathic
offenders.
Personality and Individual Differences,
24,
373–391.Google Scholar
Kosson, D.S. &
Harpur, T.J.
(1997).
Attentional skills of psychopaths: Current evidence and
developmental implications.
In
J.A. Burack &
J.T. Enns (Eds.),
Attention, development, and psychopathology (pp.
379–402).
New York:
Guilford Press.
Kosson, D.S.,
Miller, S.K.,
Byrnes, K.A.,
Leveroni, C., &
Mayer, A.
(2003).
Testing neuropsychological hypotheses for cognitive deficits in
psychopathic criminals: A study of global–local processing.
Manuscript submitted for publication.
Kosson, D.S.,
Suchy, Y.,
Mayer, A.R., &
Libby, J.
(2002).
Facial affect recognition in criminal psychopaths.
Emotion,
2,
398–411.Google Scholar
LaPierre, D.,
Braun, C.M.J., &
Hodgins, S.
(1995).
Ventral frontal deficits in psychopathy: Neuropsychological test
findings.
Neuropsychologia,
33,
139–151.Google Scholar
Lezak, M.
(1995).
Neuropsychological assessment
(3rd ed.).
New York:
Oxford University Press.
Llanes, S.L. &
Kosson, D.S.
(in press).
Divided visual attention and left hemisphere activation among
psychopathic and nonpsychopathic offenders.
Journal of Psychopathology and Behavioral Assessment.
Lopez, M.,
Kosson, D.S.,
Weissman, D.T., &
Banich, M.T.
(2004).
Interhemispheric integration in psychopaths.
Manuscript submitted for publication.
Miller, G.M. &
Chapman, J.P.
(2001).
Misunderstanding analysis of covariance.
Journal of Abnormal Psychology,
110,
40–48.Google Scholar
Morgan, A.B. &
Lilienfeld, S.O.
(2000).
A meta-analytic review of the relation between antisocial behavior
and neuropsychological measures of executive function.
Clinical Psychology Review,
20,
113–156.Google Scholar
Newman, J.P. &
Kosson, D.S.
(1986).
Passive avoidance learning in psychopathic and nonpsychopathic
offenders.
Journal of Abnormal Psychology,
95,
252–256.Google Scholar
Newman, J.P.,
Patterson, C.M.,
Howland, E.W., &
Nichols, S.L.
(1990).
Passive avoidance in psychopaths: The effects of reward.
Personality and Individual Differences,
11,
1101–1114.Google Scholar
Newman, J.P. &
Schmitt, W.A.
(1998).
Passive avoidance in psychopathic offenders: A replication and
extension.
Journal of Abnormal Psychology,
107,
527–532.Google Scholar
Newman, J.P.,
Schmitt, W.A., &
Voss, W.D.
(1997).
The impact of motivationally neutral cues on psychopathic
individuals: Assessing the generality of the response modulation
hypothesis.
Journal of Abnormal Psychology,
106,
563–575.Google Scholar
Patterson, M.C. &
Newman, J.P.
(1993).
Reflectivity and learning from aversive events: Toward a
psychological mechanism for the syndromes of disinhibition.
Psychological Review,
100,
716–736.Google Scholar
Rizzolatti, G. &
Craighero, L.
(1998).
Spatial attention: Mechanisms and theories. In
M. Sabourin,
F. Craik, &
M. Robert (Eds.),
Advances in psychological science, Vol. 2: Biological and cognitive
aspects (pp.
171–198).
Hove, UK:
Psychology Press/Erlbaum.
Robertson, I.H. &
North, N.
(1993).
Active and passive activation of left limbs: Influence on visual and
sensory neglect.
Neuropsychologia,
31,
293–300.Google Scholar
Schmitt, W.A. &
Newman, J.P.
(1999).
Are all psychopathic individuals low-anxious?
Journal of Abnormal Psychology,
108,
353–358.Google Scholar
Shevtsova, N. &
Reggia, J.
(1999).
Lateralization in a bihemispheric neural model of letter
identification.
Neurocomputing: An International Journal,
26,
875–880.Google Scholar
Sil'kis, I.G. &
Bogdanova, O.G.
(1998).
Background gamma-oscillations in neuronal networks with
interhemisphere connections.
Neuroscience and Behavioral Physiology,
28,
645–659.Google Scholar
Sutton, S.K. &
Davidson, R.J.
(2000).
Prefrontal brain electrical asymmetry predicts the evaluation of
affective stimuli.
Neuropsychologia,
38,
1723–1733.Google Scholar
Thut, G.,
Schultz, W.,
Roelcke, U.,
Nienhusmeier, M.,
Missimer, J.,
Maguire, R.P., &
Leenders, K.L.
(1997).
Monetary reward activates human prefrontal cortex.
Neuroreport,
8,
1225–1228.Google Scholar
Wallace, J.F.,
Vitale, J.E., &
Newman, J.P.
(1999).
Response modulation deficits: Implications for the diagnosis and
treatment of psychopathy.
Journal of Cognitive Psychotherapy,
13,
55–70.Google Scholar
Welsh, G.
(1956).
Factor dimensions A and R. In
G.S. Welsh &
W.G. Dahlstrom (Eds.),
Basic readings on the MMPI in psychology and medicine (pp.
264–281).
Minneapolis, MN:
University of Minnesota Press.
Williamson, S.,
Harpur, T., &
Hare, R.D.
(1991).
Abnormal processing of affective words by psychopaths.
Psychophysiology,
28,
260–273.CrossRefGoogle Scholar
Yamaguchi, S.,
Yamagata, S., &
Kobayashi, S.
(2000).
Cerebral asymmetry of the “top-down” allocation of
attention to global and local features.
Journal of Neuroscience,
20,
1–5.Google Scholar
Zachary, R.A.
(1986).
Shipley Institute of Living Scale: Revised manual.
Los Angeles, CA:
Eastern Psychological Services.
Zalla, T.,
Koechlin, E.,
Pietrini, P.,
Basso, G.,
Aquino, P.,
Sirigu, A., &
Grafman, G.
(2000).
Differential amygdala response to winning and losing: A functional
magnetic resonance imaging study in humans.
European Journal of Neuroscience,
12,
1764–1770.Google Scholar

Demographic characteristics of the sample

Mean response accuracy (percent correct) for left- and right-ear targets under left- and right-hemisphere activation for nonpsychopaths only.

(a) Mean of logarithmically transformed commission errors per group. (b) Median number of commission errors per group.
Median numbers of commission errors elicited by left versus right ear distractors
(a) Mean response latencies and standard errors of the mean. * denotes statistically significant differences between groups. (b) Mean response accuracies (percent correct) and standard errors of the mean.

Correlation coefficents between percent correct, response latency (RL), and commission errors (CE-Tr)
 You have
Access
- 15
- Cited by