Introduction
The evaluation of morphological variation within a group of organisms, both at discrete points and across intervals of time, is a fundamental objective of evolutionary biology (e.g., Foote Reference Foote1997; Brusatte et al. Reference Brusatte, Benton, Ruta and Lloyd2008a; Benson et al. Reference Benson, Hunt, Carrano and Campione2018; Budd and Mann Reference Budd and Mann2018). Methods for accurately quantifying morphological variation have long been sought as a means to identify macroevolutionary patterns within the history of life along with the mechanisms that underpin them (Briggs et al. Reference Briggs, Fortey and Wills1992; Foote Reference Foote1992, Reference Foote1994, Reference Foote1997; Wills Reference Wills1998; Lloyd Reference Lloyd2016; Adams et al. Reference Adams, Collyer and Kaliontzopoulou2019). The last three decades have seen the development of statistical approaches to evaluate morphological variation that have been instrumental in the identification of patterns of organismal variation at widely varying taxonomic and temporal scales (e.g., Briggs et al. Reference Briggs, Fortey and Wills1992; Wills et al. Reference Wills, Briggs and Fortey1994; Hughes et al. Reference Hughes, Gerber and Wills2013; Bazzi et al. Reference Bazzi, Kear, Blom, Ahlberg and Campione2018). In particular, empirical methods have emerged that can effectively describe and visualize the range and distribution of morphological variation (i.e., morphospace), utilizing diverse data sources that capture morphology in different ways, such as traditional linear morphometrics, geometric morphometrics, and discrete characters (Wills Reference Wills, Adrain, Edgecombe and Lieberman2001; Lloyd Reference Lloyd2016; Adams et al. Reference Adams, Collyer and Kaliontzopoulou2019).
The flexibility of morphospace reconstruction methods with respect to the sources of data that can be used and implemented by modern software packages has seen their acceptance and broad uptake among palaeobiologists (e.g., Foote Reference Foote1994; Wills Reference Wills1998; Brusatte et al. Reference Brusatte, Benton, Ruta and Lloyd2008b; Campione and Evans Reference Campione and Evans2011) but is equally applicable and gaining traction among all neontological comparative morphologists (e.g., Chartier et al. Reference Chartier, Löfstrand, von Balthazar, Gerber, Jabbour, Sauquet and Schönenberger2017). The increasing amount of available computational power and the development of more efficient heuristics required for phylogenetic analyses (e.g., Goloboff et al. Reference Goloboff, Farris and Nixon2008) have encouraged the development of large morphological data matrices encompassing both extant and extinct taxa (e.g., O'Leary et al. Reference O'Leary, Bloch, Flynn, Gaudin, Giallombardo, Giannini, Goldberg, Kraatz, Luo, Meng, Ni, Novacek, Perini, Randall, Rougier, Sargis, Silcox, Simmons, Spaulding, Velazco, Weksler, Wible and Cirranello2013; Chartier et al. Reference Chartier, Löfstrand, von Balthazar, Gerber, Jabbour, Sauquet and Schönenberger2017; Cau Reference Cau2018). Cladistic matrices, therefore, offer a wealth of accessible morphological data for a range of taxa and are regularly co-opted for the purposes of both morphospace and disparity dynamics (e.g., Wills et al. Reference Wills, Briggs and Fortey1994; Brusatte et al. Reference Brusatte, Benton, Ruta and Lloyd2008a).
Cladistic matrices have a distinct advantage over morphometric data in that they can incorporate a broad taxonomic and morphological scope and are able to account for the appearance of evolutionary novelties, attributes important in the validation and formulation of macroevolutionary hypotheses (Wills et al. Reference Wills, Briggs and Fortey1994; Gerber Reference Gerber2019). However, to synthesize the variation in a cladistic matrix, it is ordinated, generally via a principal coordinates analysis (PCoA), based on a dissimilarity or distance matrix (often generalized Euclidean distances; Wills Reference Wills, Adrain, Edgecombe and Lieberman2001; but see Lloyd Reference Lloyd2016), which describes pairwise character-state differences between taxa. The resultant canonical axes have previously been interpreted as reliable proxies of general body-plan morphology and form the foundation upon which evolutionary history is interpreted (e.g., Wills et al. Reference Wills, Briggs and Fortey1994; Brusatte et al. Reference Brusatte, Benton, Ruta and Lloyd2008a, Reference Brusatte, Lloyd, Wang and Norell2014; Lee et al. Reference Lee, Cau, Naish and Dyke2014; Cau Reference Cau2018). Unlike correlation- or contingent-based ordination methods, such as principal component and correspondence analyses (PCA and CA, respectively), that decompose a cross-tabulated matrix of the variables (q × q matrix), PCoA relies on a predetermined dissimilarity matrix of the observations (n × n matrix). This means that there is no direct association between the ordinated axes of variation and the variables (characters) used to generate them (Legendre and Legendre Reference Legendre and Legendre1998). In other words, whether a given PCo axis or collection of axes represents body plan is assumed, rather than interpreted.
Interpretation of the PCo axes is further complicated by the very low proportion of the variation in discrete-character morphospaces represented by the first few axes (Gerber Reference Gerber2019), restricting the ability to generalize observed patterns in those axes to the whole group in question (however, see Wright [Reference Wright2017] for a counterexample in crinoids). Intrinsic biases are introduced in the construction of discrete character–taxon matrices, which may lead to contradictory macroevolutionary hypotheses between independent analyses of similar taxonomic scope (Benson Reference Benson2018). Recent studies comparing disparity proxies utilizing both character-based and morphometric descriptors demonstrate that they converge on a common signal (Foth et al. Reference Foth, Brusatte and Butler2012; Hetherington et al. Reference Hetherington, Sherratt, Ruta, Wilkinson, Deline and Donoghue2015). However, unexplained variation between cladistic and functional dissimilarities (mean r 2; Anderson and Friedman Reference Anderson and Friedman2012) indicates that a great deal of functional variation cannot be explained by characters in a cladistic matrix and that unaudited function/ecological interpretations of cladistic-based ordinations should be avoided. In addition, the subjectivity inherent in the construction of discrete character–taxon matrices can lead to contradictory macroevolutionary hypotheses between independent analyses of the same taxonomic scope (such as between Brusatte et al. [Reference Brusatte, Lloyd, Wang and Norell2014] and Lee et al. [Reference Lee, Cau, Naish and Dyke2014], reviewed in Benson [Reference Benson2018]). Finally, whether factors extrinsic to the character–taxon matrix influence the perceived morphospace remains to be determined.
It is well established that the ordination of linear measurements using PCA yields a first principal component strongly related to the size of each observation (Jolicoeur Reference Jolicoeur1963; Zelditch et al. Reference Zelditch, Swiderski, Sheets and Fink2004). The lack of consideration of body size in analyses utilizing discrete-character morphospaces implies that previous studies assumed its negligible influence, likely because no mechanism analogous to that of linear measurements and PCA suggested the presence of such a confounding effect within discrete-character data. However, no study to date attempts to test the assumed independence between body size and discrete-character morphological proxies. Determining which aspects of morphological variation are extracted by specific PCoA axes is difficult, as the link with the original variables is lost once they are ordinated. Recent work evaluated the presence or absence of bias between morphological regions or “modules” as defined by characters of a cladistic dataset (Nordén et al. Reference Nordén, Stubbs, Prieto-Márquez and Benton2018), but so far no study has examined whether properties of cladistic matrices extrinsic to the character codings themselves (such as body size) has an influence on the resulting ordination.
Here, we use multiple discrete character–taxon matrices of dinosaurs as a case study to test the correlation between ordinated proxies of morphology and the estimated body mass of each constituent dinosaur taxon. In addition, we explore the effects of the removal of body size on recently described macroevolutionary patterns across the origin of Aves, hypothesized on the basis of a discrete-character morphospace (Cau Reference Cau2018). Cau (Reference Cau2018) used an ordinated cladistic matrix to interpret the modes and relative rates at which the direct ancestor of modern birds acquired “bird-like” morphologies. The first two PCo axes were plotted against the ages of the hypothetical ancestors as determined by the Bayesian analysis of the original character–taxon matrix (Cau Reference Cau2018: Fig. 8a,b). Rapid shifts in the ancestral PCo values for both axes were used to delimit three phases of morphological evolution along the avian stem lineage (denoted as “Pan-avian phases I–III”; hereafter simply phases I–III), each of which were discussed at length and formed the basis of a conceptual model for the evolutionary construction of the avian body plan. The period of positive change in the first ancestral PCo axis corresponds almost exactly with the decrease in the hypothesized ancestral body mass of theropods leading up to and continuing into the direct ancestors of modern birds (Turner et al. Reference Turner, Pol, Clarke, Erickson and Norell2007; Benson et al. Reference Benson, Campione, Carrano, Mannion, Sullivan, Upchurch and Evans2014; Lee et al. Reference Lee, Cau, Naish and Dyke2014). Although Cau (Reference Cau2018) identified body size as a significant factor, no attempt was made to address potential confounding effects it may have on the morphological proxies (i.e., PCo axes).
Data and Methods
Morphospace reconstruction from cladistic matrices follows a procedure whereby a distance, or dissimilarity, matrix is calculated based on a pairwise comparison of each taxon given their character-state combinations. In morphospace and disparity analyses, the most commonly used dissimilarity metrics are the generalized Euclidean distance (Wills Reference Wills1998) and the Gower coefficient (Gower Reference Gower1971), although Lloyd (Reference Lloyd2016) recently described a new metric based on the latter, the maximum observable rescaled distance (MORD). An ordination method, typically PCoA, is applied to the dissimilarity matrix to reduce the dimensions down to a set of canonical axes that describe progressively smaller proportions of the variation within the matrix. Typically, only the first two or three ordinated axes are used in morphospace studies, either plotted against each other for visualization of morphospace occupation or used directly as a proxy for morphology (e.g., Brusatte et al. Reference Brusatte, Lloyd, Wang and Norell2014; Cau Reference Cau2018).
Our analyses use dinosaurs as a case study, because they are commonly used to test/formulate macroevolutionary hypotheses from character–taxon matrices (e.g., Brusatte et al. Reference Brusatte, Benton, Ruta and Lloyd2008a,Reference Brusatte, Benton, Ruta and Lloydb, Reference Brusatte, Butler, Prieto-Márquez and Norell2012, Reference Brusatte, Lloyd, Wang and Norell2014; Strickson et al. Reference Strickson, Prieto-Márquez, Benton and Stubbs2016; Cau Reference Cau2018; Nordén et al. Reference Nordén, Stubbs, Prieto-Márquez and Benton2018; Stubbs et al. Reference Stubbs, Benton, Elsler and Prieto-Márquez2019). In our exploration of the effects of body size on ordinated morphological proxies in dinosaurs, we conducted analyses at two conceptual levels. First, exploratory analyses were used to assess the strength of the relationship between body size and morphospace using both the axis of greatest variation (i.e., PCo1) and the entire datasets, either via the dissimilarity matrices or all principal coordinates. Comparisons with PCo1 are important, as this axis generally forms the basis for specific morphological interpretations, despite its often low proportion of explained variation. However, given the low proportion of variation explained, a more comprehensive analysis considering all axes of variation or the dissimilarity matrix will provide a more general sense of the relationship between body size and character–taxon data. This is particularly relevant, as disparity analyses based on phylogenetic data utilize a number of axes (e.g., corresponding to 90% of the variation; Brusatte et al. Reference Brusatte, Butler, Prieto-Márquez and Norell2012). Second, a subsequent analysis was used to adjust PCo1 to accommodate for body mass and test the influence of size on resultant macroevolutionary patterns. Here we use a recent study on the evolution of the hypothetical avian stem lineage (hereafter, ASL; Cau Reference Cau2018) as a case study.
All analyses were performed and visualized using the R programming language (R Core Team 2019), using functions from the packages ade4 1.7-13 (Dray and Dufour Reference Dray and Dufour2007), ape 5.2 (Paradis and Schliep Reference Paradis and Schliep2019), Claddis 0.3.3 (Lloyd Reference Lloyd2016), geomorph 3.1.0 (Adams et al. Reference Adams, Collyer and Kaliontzopoulou2019), MASS 7.3-51.1 (Venables and Ripley Reference Venables and Ripley2002), nlme 3.1-137 (Pinheiro et al. Reference Pinheiro, Bates, DebRoy and Sarkar2018), paleotree 3.1.3 (Bapst Reference Bapst2012), phylobase 0.8.6 (R Hackathon Reference Hackathon2019), phytools 0.6 (Revell Reference Revell2012), and phangorn 2.5.3 (Schliep Reference Schliep2011). All packages are available on the CRAN. The R code used in this study is included as Supplementary Information.
We obtained a set of nine recently published discrete character–taxon matrices covering almost all major dinosaur clades. Of these, seven were used by Brusatte et al. (Reference Brusatte, Butler, Prieto-Márquez and Norell2012) to investigate dinosaur disparity during the Campanian–Maastrichtian, including matrices for tyrannosauroids (Brusatte et al. Reference Brusatte, Norell, Carr, Erickson, Hutchinson, Balanoff, Bever, Choiniere, Makovicky and Xu2010), dromaeosaurids (Csiki et al. Reference Csiki, Vremir, Brusatte and Norell2010), titanosauriforms (Curry Rogers Reference Curry Rogers, Rogers and Wilson2005), pachycephalosaurians (Longrich et al. Reference Longrich, Sankey and Tanke2010), hadrosaurids (Prieto-Márquez Reference Prieto-Márquez2010), ceratopsids (Sampson et al. Reference Sampson, Loewen, Farke, Roberts, Forster, Smith and Titus2010), and ankylosaurians (Thompson et al. Reference Thompson, Parish, Maidment and Barrett2012). In addition, we analyzed matrices covering Coelurosauria (Brusatte et al. Reference Brusatte, Lloyd, Wang and Norell2014) and Theropoda (Cau Reference Cau2018). Size data were based on body-mass estimates published in Benson et al. (Reference Benson, Hunt, Carrano and Campione2018), generated from limb circumferencial estimation models (Campione and Evans Reference Campione and Evans2012; Campione et al. Reference Campione, Evans, Brown and Carrano2014), with the exception of pachycephalosaurs, for which frontoparietal length (Evans et al. Reference Evans, Brown, Ryan and Tsogtbaatar2011) was used as a size proxy to maximize sampling.
Each matrix was read from separate Nexus files using Claddis, which was also used to calculate the dissimilarity matrix. For all matrices, the MORD metric was used, which is the highest-fidelity dissimilarity metric for character–taxon matrices with moderate to high proportions of missing data (Lloyd Reference Lloyd2016). A PCoA was then performed on the MORD matrices using the pcoa function in ape. The strength of the relationship between PCo1 and body mass for each matrix was calculated using a robust implementation of linear regression in MASS. A robust linear model was chosen to mitigate the effects of outlier taxa from each phylogenetic matrix, most notably the associated outgroup(s). Phylogenetic correlation of PCo1 with body mass was also assessed using both phylogenetic correlation, using the corphylo function in ape, and a multivariate phylogenetic generalized least-squares (pGLS) model using the procD.pgls function in geomorph. For both methods, the phylogeny of each dataset was time-scaled using the “equal” method from the timePaleoPhy function in paleotree. Correlations between body mass and each of the remaining PCo axes were also calculated for all matrices. Relationships between the entire dataset and body size were assessed through the inclusion of all PCo axes in a pGLS model. Additionally, we performed a Mantel test using mantel.rtest in ade4, which correlated the pairwise Euclidean differences in body mass between each taxon with the MORD matrix of the cladistic dataset. This tests whether a relationship exists between the relative differences in body mass between taxa and their differences in morphology, as calculated by the MORD metric of the cladistic dataset. We also produced bivariate plots of the distance matrices to assess the linearity of any correlation in light of concerns regarding the indiscriminate use of Mantel tests (Guillot and Rousset Reference Guillot and Rousset2013).
To explore the effects of adjusting size-related axes, we apply a residual/covariate approach to the PCo1 derived from the Cau (Reference Cau2018) matrix using the methodology outlined in the previous section. The character states for the hypothetical ancestors of the Cau (Reference Cau2018) matrix were calculated using the MPR Fitch parsimony function in phangorn, using only those taxa with body-mass estimates (from Benson et al. Reference Benson, Hunt, Carrano and Campione2018). The resulting matrix of reconstructed ancestors was then restricted to those directly ancestral to crown birds as represented by Meleagris gallopavo. The same procedure of dissimilarity matrix calculation followed by ordination described earlier was repeated on the ancestral state matrix. Admittedly, this methodological sequence, whereby ancestral states are estimated before ordination (pre-OASE [ordinated ancestral-state estimation]) artificially elevates levels of phylogenetic signal that can overprint the desired morphological pattern (for full details, see Lloyd Reference Lloyd2018). However, to maximize the comparability of our results with those obtained by Cau (Reference Cau2018), we retain the pre-OASE approach herein. The estimated body mass of each taxon in the character–taxon matrix was log transformed and used to reconstruct the ancestral body mass of each hypothetical taxon along the ASL using phytools. To mitigate the effects of serial correlation between the reconstructed ancestral body masses and character states, an artifact of using ancestor–descendant relations, the relationship between body mass and PCo1 was assessed using a generalized least-squares (GLS) model in nlme with the ages of each hypothetical ancestor incorporated within a autocorrelation structure of order 1 (AR(1)). Support for this model was evaluated based on the significance of its scaling coefficient and its corrected Akaike information criterion (AICc) relative to an intercept-only model (i.e., PCo1~1). The PCo1 and body-mass values for each hypothetical ancestral taxon along the ASL were plotted against their associated temporal values, broadly following Cau (Reference Cau2018), and size adjustment was carried out through use of the GLS residuals projected onto the same temporal scale.
Results
Correlation between Morphology and Body Mass
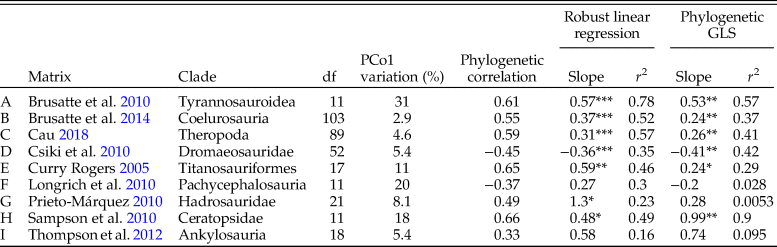
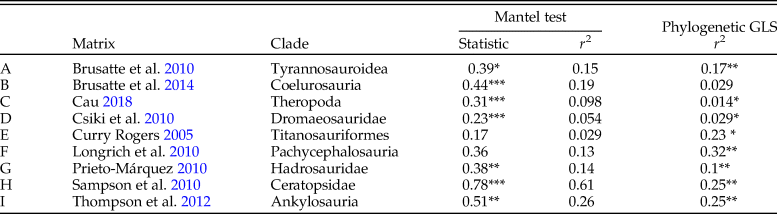
The first principal coordinate axis comprises 2.9–31% of the total variation from the complete set of ordinated axes (Table 1). The absolute values of the phylogenetically corrected Pearson correlation between body mass and PCo1 ranged from 0.33 to 0.66, averaging approximately 0.52. The robust linear regression between body mass and PCo1 recovered statistically significant correlations (at p = −0.05) for seven of the nine matrices (Table 1, Fig. 1). Of those seven matrices, body mass accounted for between 23% and 78% of the variation in PCo1 (Table 1). The pGLS model between body mass and PCo1 was significant for six of the nine matrices; of those, body mass accounts for 29–90% of the variation in PCo1 (Table 1). Under both models, the average correlation coefficient for all matrices with significant correlations was approximately 49%. Four out of the six matrices that had mutually significant relationships between body mass and PCo1 under the robust linear and pGLS models had a lower correlation coefficient under pGLS (Table 1); Dromaeosauridae and Ceratopsia were the exceptions.
Scatter plots of principal axis of variation (PCo1) against log body mass (kg) for nine discrete character–taxon matrices of dinosaurs. Unfilled circles represent outgroup taxa. Lines represent robust linear regressions. A, Tyrannosauroidea (Brusatte et al. Reference Brusatte, Norell, Carr, Erickson, Hutchinson, Balanoff, Bever, Choiniere, Makovicky and Xu2010); B, Coelurosauria (Brusatte et al. Reference Brusatte, Lloyd, Wang and Norell2014); C, Theropoda (Cau Reference Cau2018); D, Dromaeosauridae (Csiki et al. Reference Csiki, Vremir, Brusatte and Norell2010); E, Titanosauriformes (Curry Rogers Reference Curry Rogers, Rogers and Wilson2005); F, Pachycephalosauria (Longrich et al. Reference Longrich, Sankey and Tanke2010); G, Hadrosauridae (Prieto-Márquez Reference Prieto-Márquez2010); H, Ceratopsidae (Sampson et al. Reference Sampson, Loewen, Farke, Roberts, Forster, Smith and Titus2010); and I, Ankylosauria (Thompson et al. Reference Thompson, Parish, Maidment and Barrett2012). Silhouettes downloaded from Phylopic (https://phylopic.org) and courtesy of Scott Hartman, Emily Willoughby, Caleb Brown, Travis Tischler, Andrew Farke, and FunkMonk.

Results of the robust linear model and phylogenetic correlation for principal ordinated axis of variation (PCo1) of nine discrete character–taxon matrices of dinosaurs. Asterisks beside slope values denote statistical significance: no symbol ≥ 0.05; * = 0.01–0.05; ** = 0.01–0.001; *** ≤ 0.001.

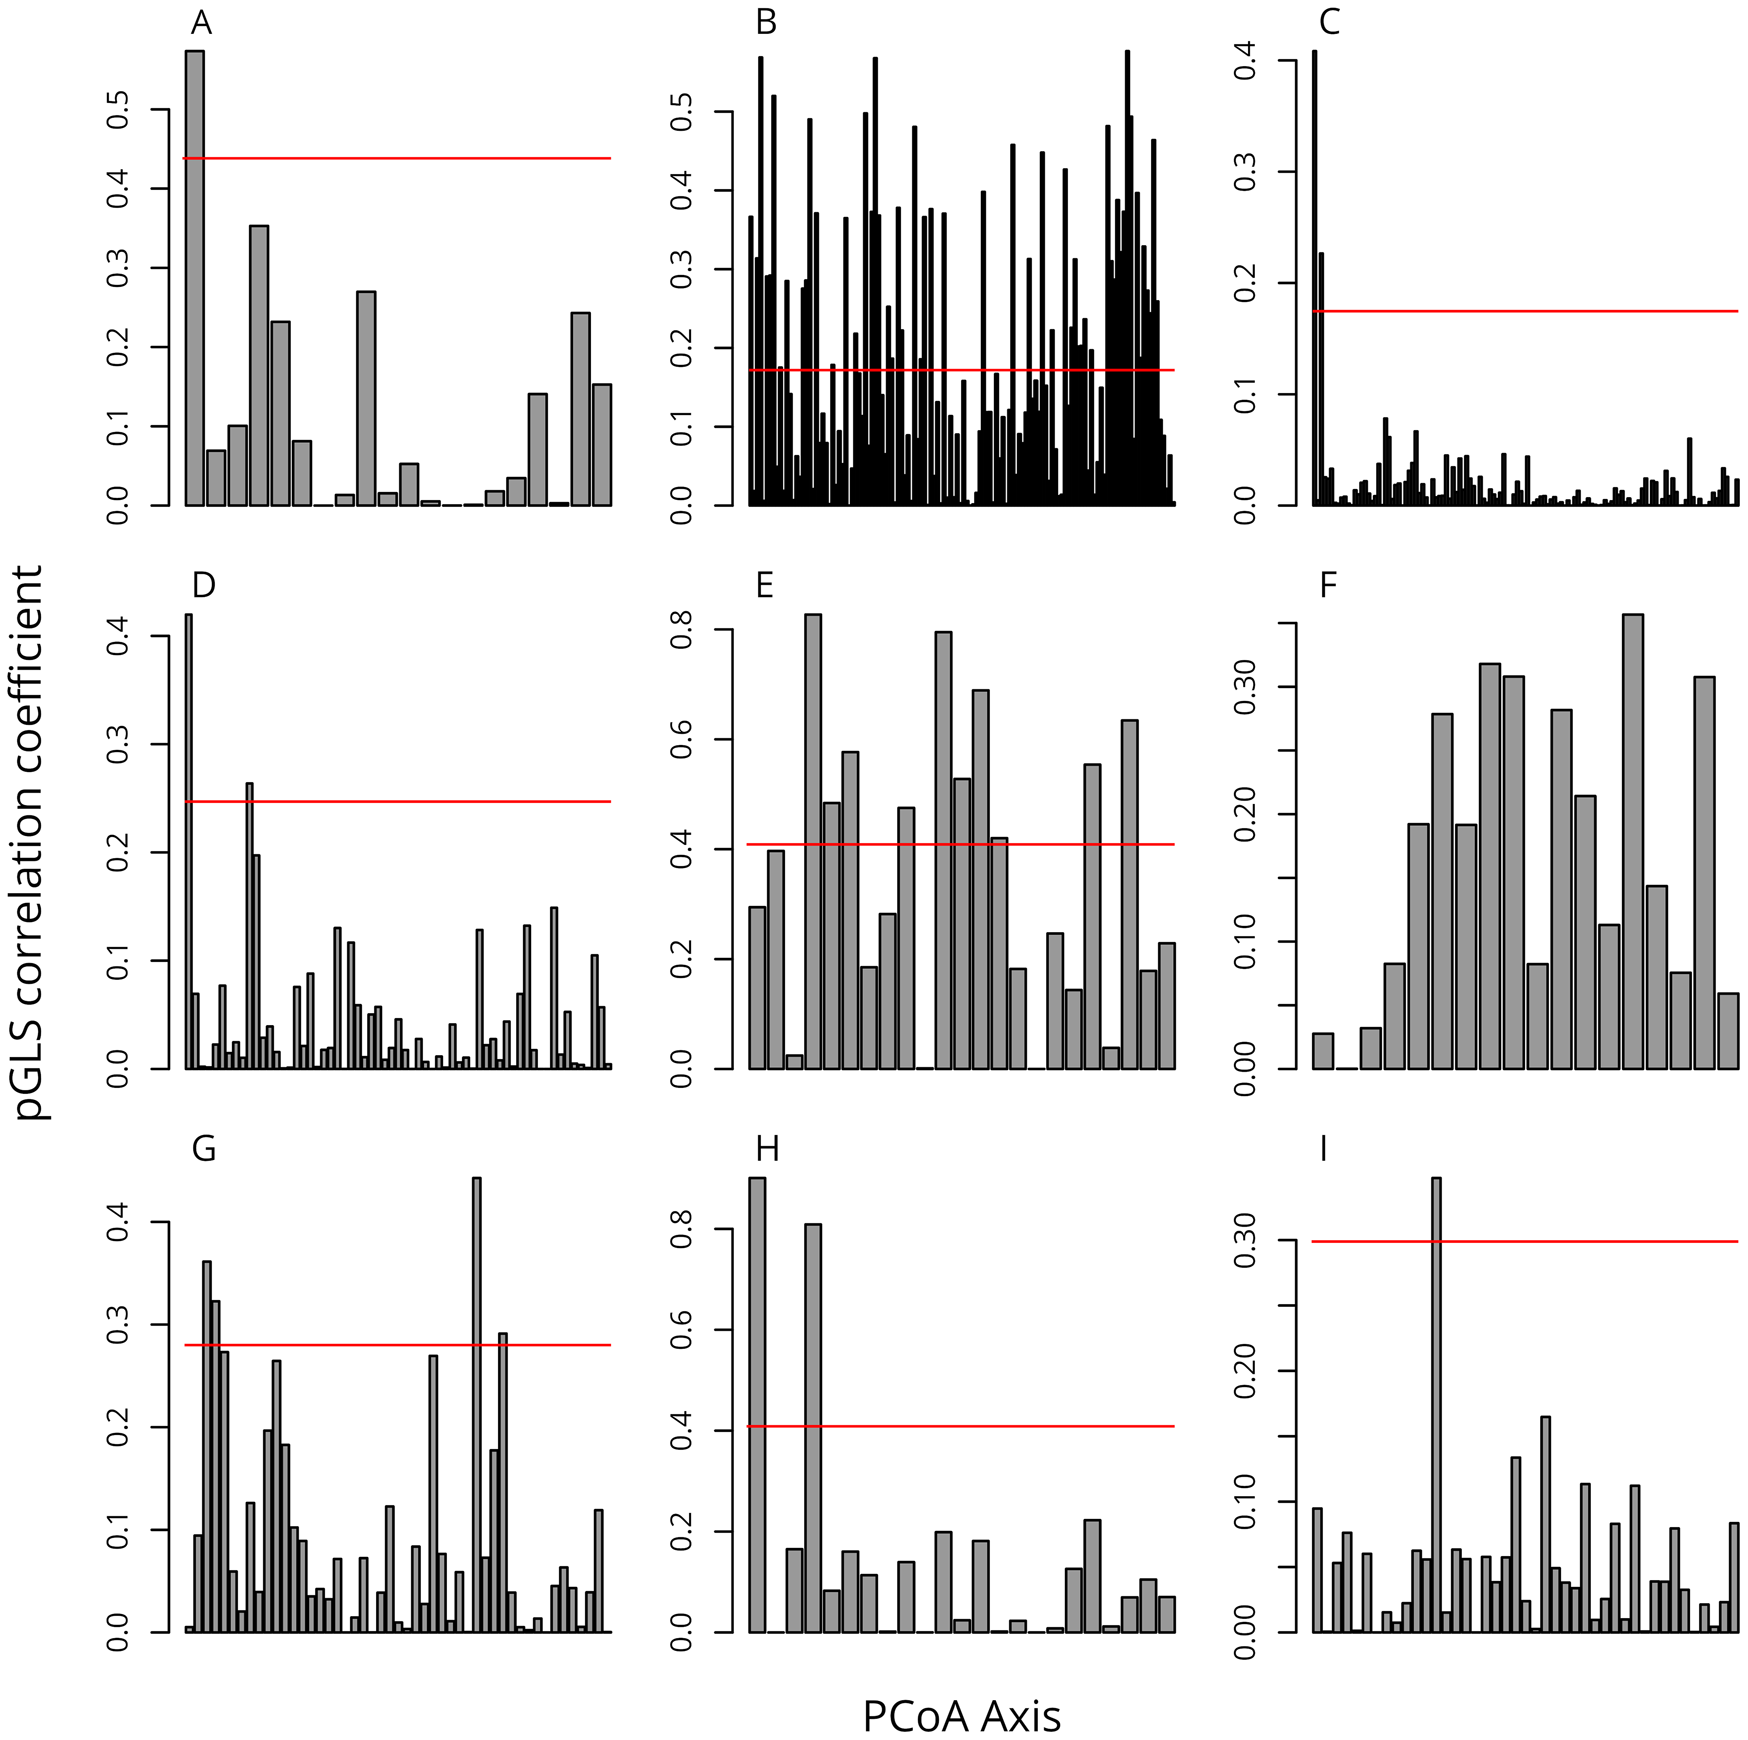
Further exploration of the pGLS correlation coefficients for the remaining axes reveals that PCo1 is not always the axis most strongly related to body size (Fig. 2). Eight out of the nine matrices had at least one axis with a correlation coefficient greater than the two-tailed 95% confidence interval; Pachycephalosauria was the single exception. The correlation coefficient of the first PCo axis in the Tyrannosauroidea, Theropoda, Dromaeosauridae, and Ceratopsidae matrices was greater than that of any of the other subsequent axes, and in the Hadrosauridae matrix the value of the first axis was among the lowest of all axes (Fig. 2).
Bar plots of the correlation coefficients of body mass against each principal coordinate axis for the nine discrete character–taxon matrices of dinosaurs from Fig. 1. The horizontal line represents the two-tailed 95% confidence interval. PCoA, principal coordinates analysis; pGLS, phylogenetic least-squares.

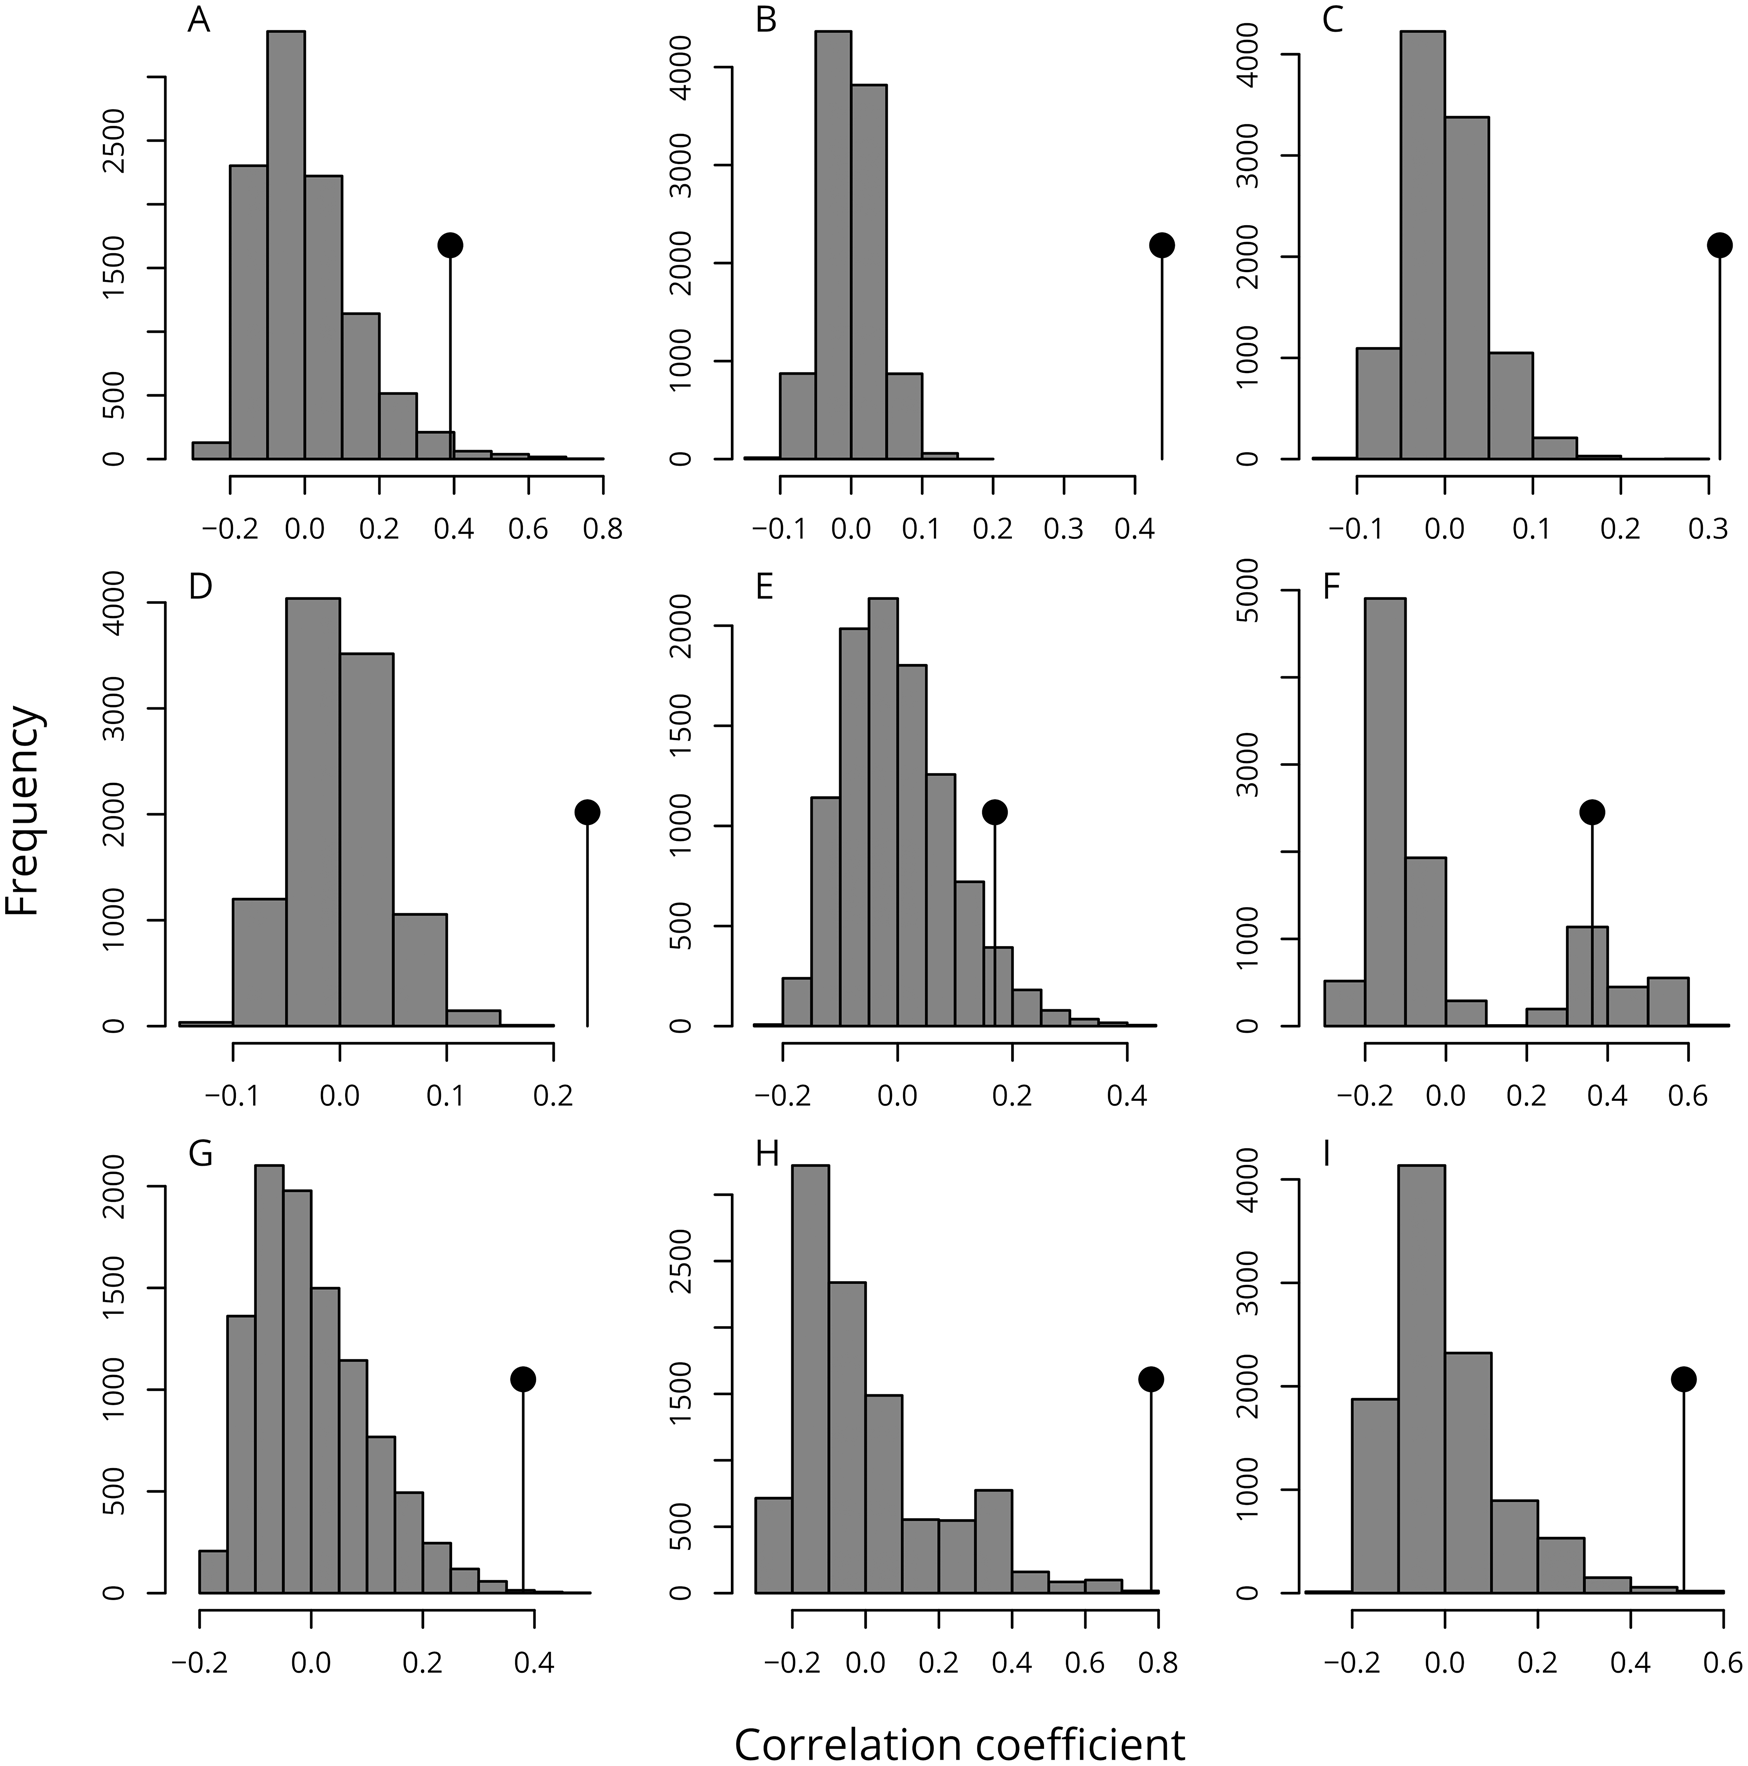
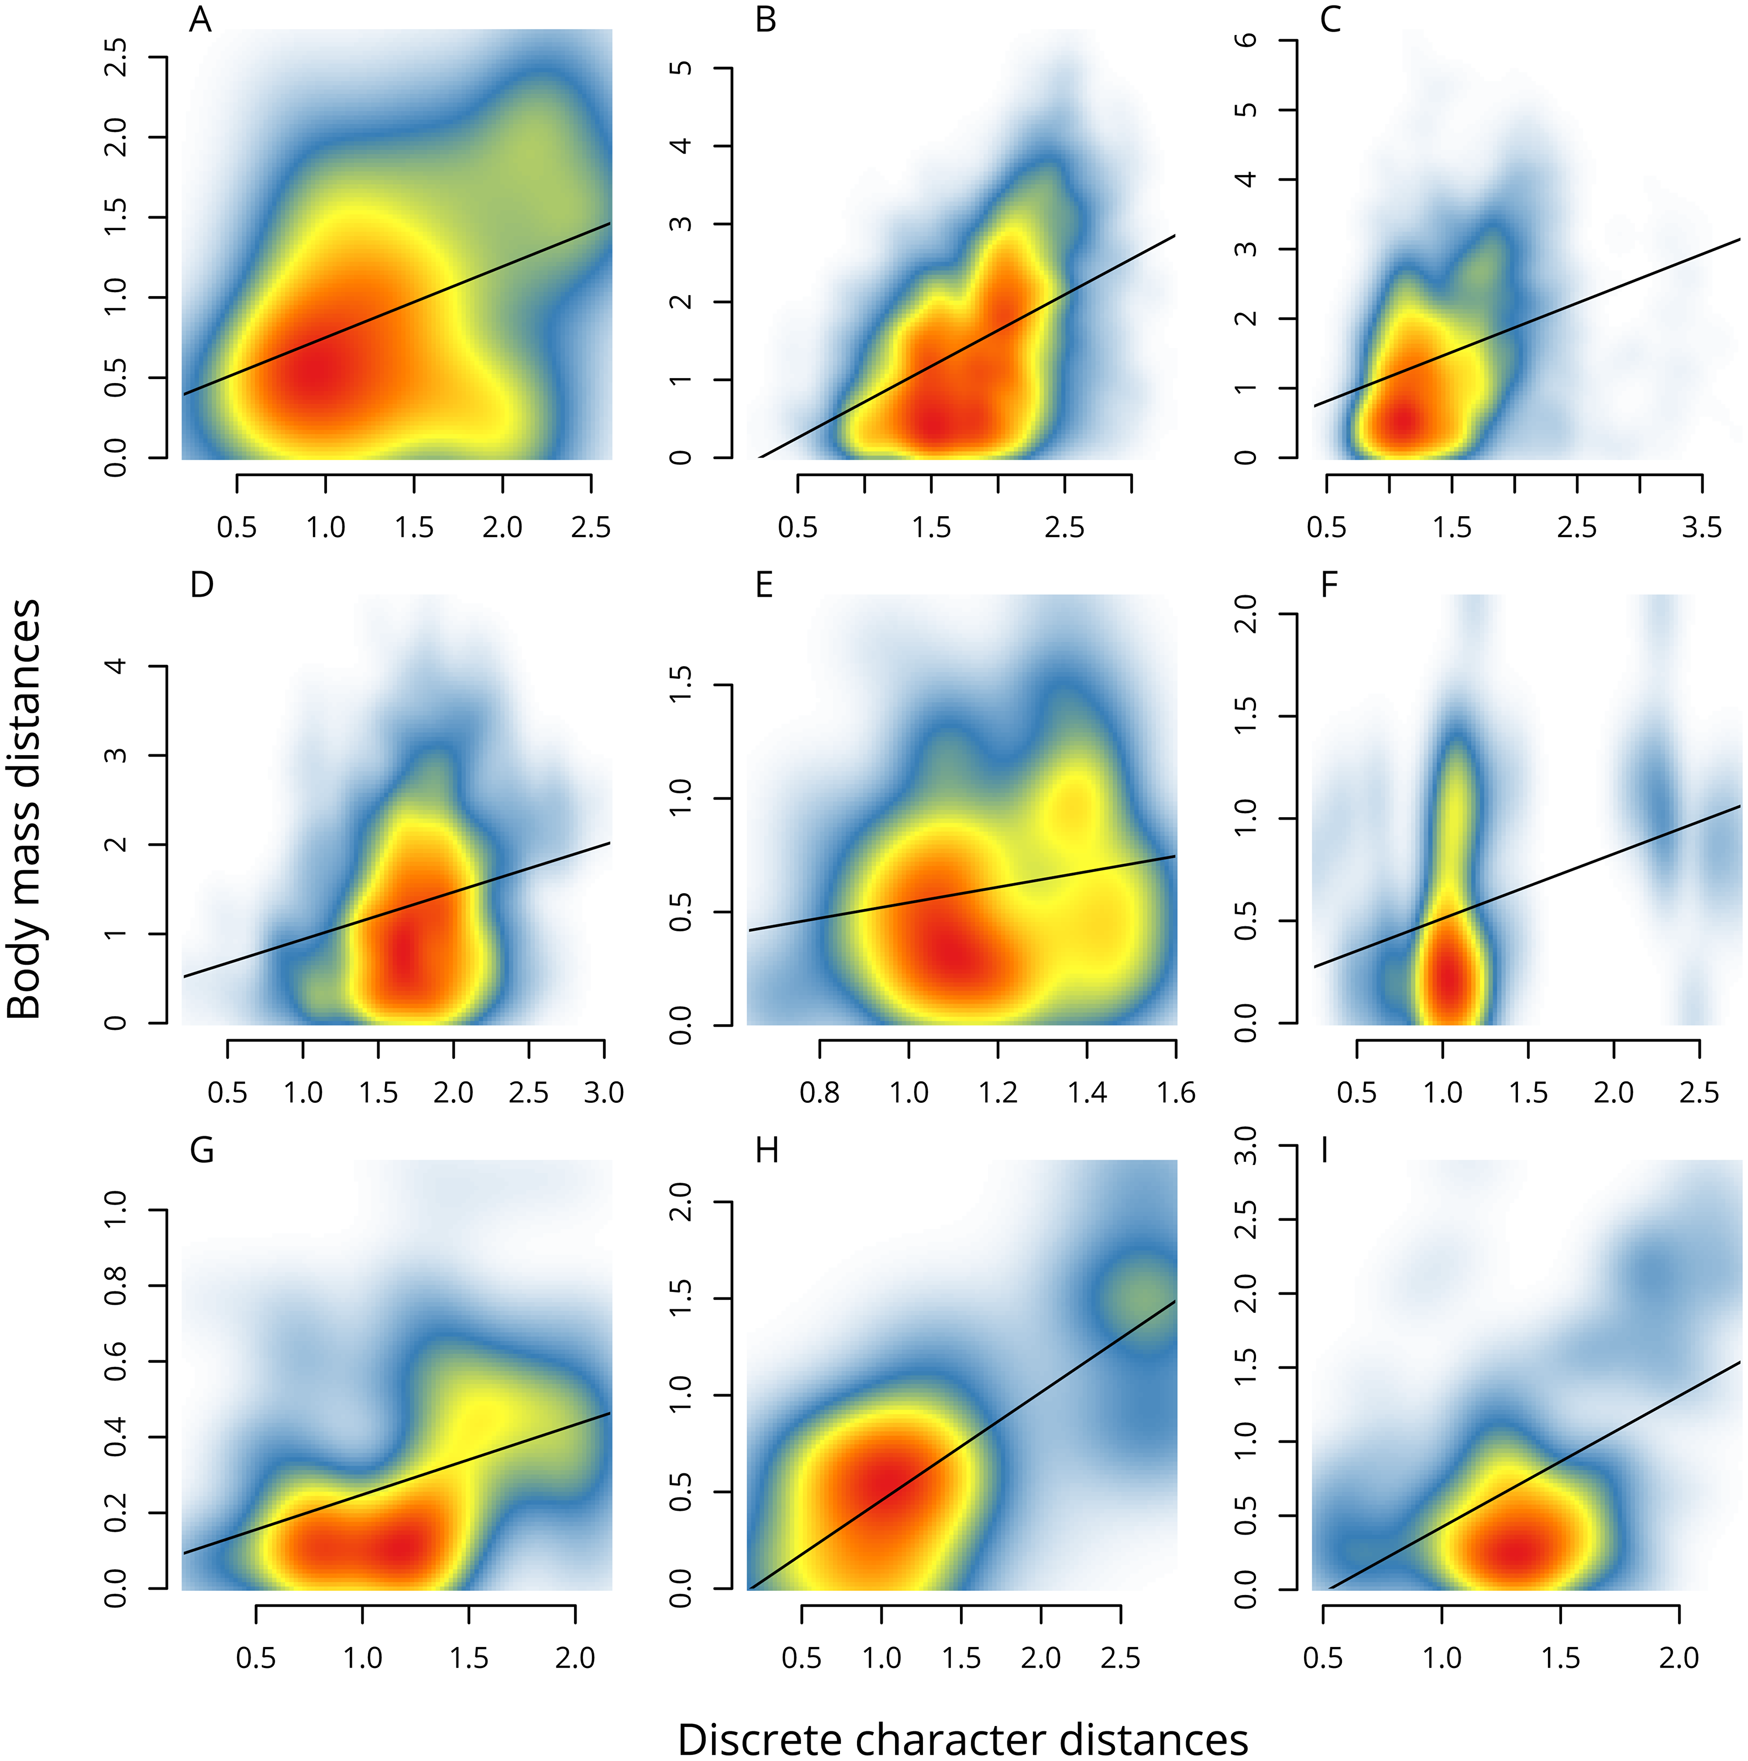
Mantel tests between discrete-character MORD and body-mass Euclidean distance matrices revealed a significant correlation between seven of the nine matrices (Table 2); Titanosauriformes and Pachycephalosauria were the two exceptions. Of those seven, body mass accounted for between 0.054% and 61% of the variation in the discrete-character MORD matrix, and the observed correlation coefficient falls either within the distal tail or outside a distribution of randomly generated correlation coefficients via permutations of the distance matrices (Fig. 3). There is no evidence for a nonlinear response between the distance matrices among the seven aforementioned matrices when the values are visualized in bivariate plots, although heteroscedasticity can be observed (Fig. 4). The pGLS including all PCo axes found a significant correlation with body mass in eight of the nine matrices; Coelurosauria was the single exception. Of these, body mass accounted for between 0.014% and 32% of the variation in the complete set of PCo axes (Table 2).
Histograms of the correlations of the permuted body-mass and discrete-character distance matrices for the nine discrete character–taxon matrices of dinosaurs from Fig. 1, with the observed matrix correlation indicated by the black circle markers.

Kernel density plots of the discrete-character distance matrices plotted against body mass for the nine discrete character–taxon dinosaur matrices from Fig. 1. The black lines represents the linear regression lines.

Results of the Mantel tests and multivariate phylogenetic least-squares (pGLS) for the dissimilarity matrix and complete principal coordinates (PCo) axes, respectively, of nine discrete character–taxon matrices of dinosaurs. Asterisks beside slope values denote statistical significance: no symbol ≥ 0.05; * = 0.01–0.05; ** = 0.01–0.001; *** ≤ 0.001.

Size Adjustment along the ASL
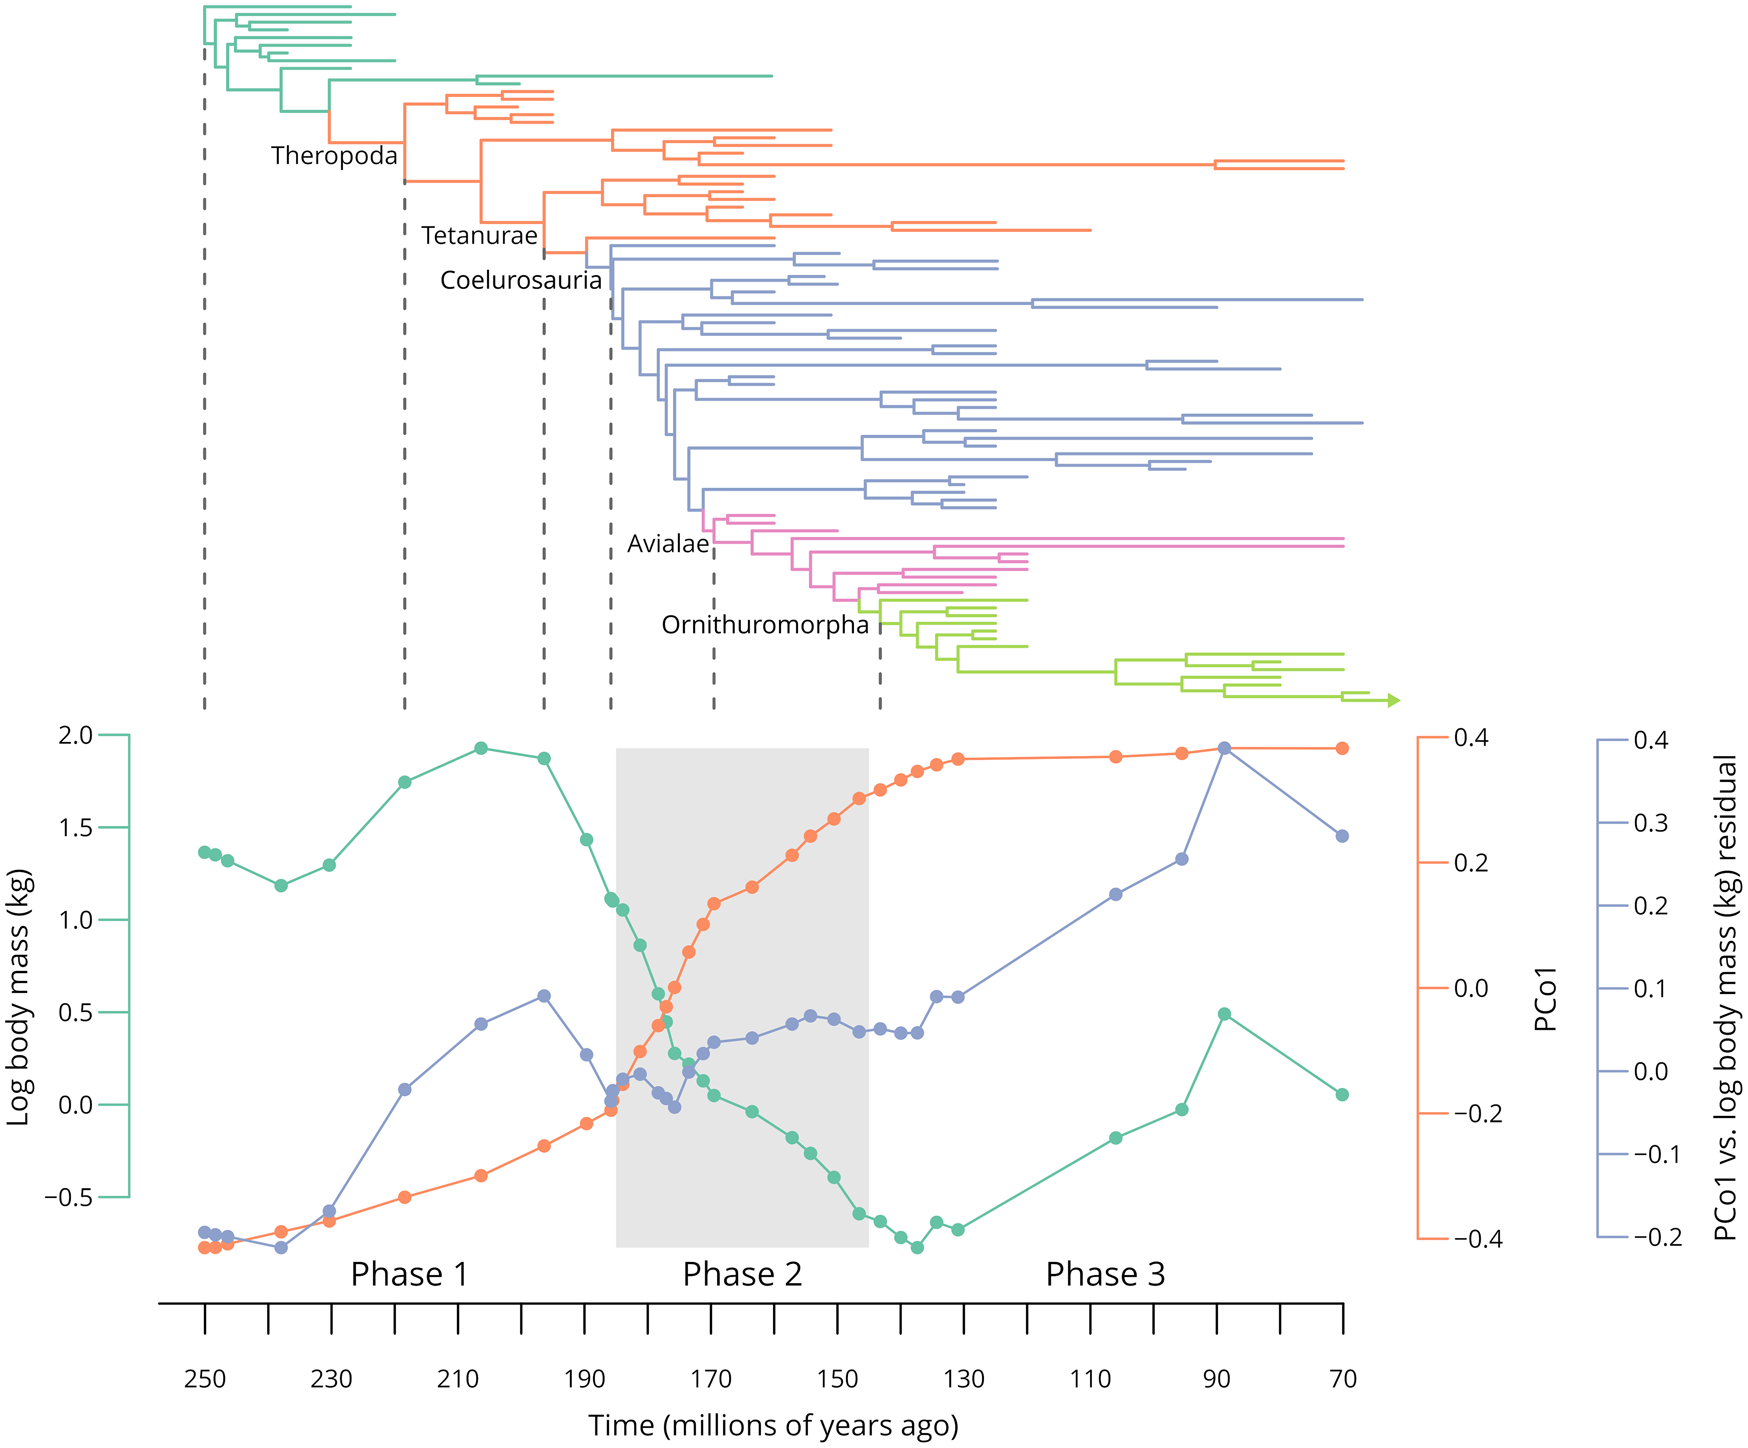
The reconstructed body-mass curve along the ASL (Fig. 5, green line) displays the well-established pattern of body miniaturization in theropods leading toward crown birds (Turner et al. Reference Turner, Pol, Clarke, Erickson and Norell2007; Benson et al. Reference Benson, Campione, Carrano, Mannion, Sullivan, Upchurch and Evans2014, Reference Benson, Hunt, Carrano and Campione2018; Lee et al. Reference Lee, Cau, Naish and Dyke2014). Body-mass reduction begins at the tetanuran node and reaches its lowest point just after Ornithuromorpha, at the node defining a clade that includes Hongshanornis longicresta and more crownward taxa. Following this node, there is a general increase in body mass. These patterns of size reduction differ slightly from those found by Lee et al. (Reference Lee, Cau, Naish and Dyke2014), in which theropods experienced a continual decrease in mass from a large ancestor.
Time-calibrated Bayesian tree of Cau (Reference Cau2018) with labels indicating key clades (top) plotted with the reanalysis of the ancestral avian morphospace (bottom). The line graph plots body mass, first principal coordinate axis (PCo1), and the residual of PCo1 vs. body mass for each hypothetical taxon on the avian stem lineage over time. The period of time described as “phase II” of Cau's (Reference Cau2018) tripartite division of the avian stem lineage is denoted by the area in gray. PCo1, first principal coordinate axis.

The first principal coordinate axis derived from the ordination of the ancestral state character matrix along the ASL resembles the most salient features illustrated by Cau (Reference Cau2018: Fig. 8b), including the recognition of three major phases of character accumulation (see “Discussion”). The only major differences include: a slight increase in the ancestral reconstructed value at the nodes immediately before the rapid shift in basal Coelurosauria (Fig. 5, orange line); and a more rapid onset of the shift along PCo1. Similar to that described by Cau (Reference Cau2018), our analysis recovers a marked shift at the least inclusive clade that contains Compsognathidae and more crownward taxa, and stabilization of the shift occurs gradually, after the node representing the ancestor of Gansus yumenensis and more crownward taxa.
Our temporal patterns reveal a strong inverse relationship between body size and PCo1 (Fig. 5, Table 3) at a very high level of significance using Pearson's correlation (df = 31, r = −0.905, p ≤ 0.0001; Fig. 5). The GLS model with an AR(1) temporally calibrated correlation structure with body mass as a covariate received much stronger statistical support (AICPCo1~size = −86.7) than the intercept-only model (AICPCo1~1 = −64.3). When the residuals of the GLS model are plotted against node age, the rapid shift in value between basal Coelurosauria and basal Ornithuromorpha (corresponding to “phase II” of Cau [2018]) is effectively removed. Size-adjusted PCo1 values during phase II depict a much more gradual accretion of characters along the ASL (Fig. 5, blue line). Overall, our patterns suggest that character accumulation along the entire ASL was largely additive, with a potential minor shift toward positive PCo1 values in basal theropods (during phase I) but otherwise gradual accretion across putative phases II and III.
Results of generalized least-squares analyses for hypothetical avian stem lineage taxa of the Cau (Reference Cau2018) matrix. The normal model uses ancestral body mass as the outcome variable of ancestral first principal coordinate axis (PCo1) values, whereas the null model uses a constant covariate of one. Both analyses accommodate for serial correlation along time series using an autoregressive function (AR(1)) containing the ages of each hypothetical ancestor. AICc, corrected Akaike information criterion.

Discussion
Extrinsic Factors in Morphological Cladistic Datasets
The availability of large-scale cladistic datasets for a variety of tetrapod clades has seen a recent explosion in the reconstruction of discrete character–based morphospaces and disparity curves in dinosaurs (Brusatte et al. Reference Brusatte, Benton, Ruta and Lloyd2008a, Reference Brusatte, Butler, Prieto-Márquez and Norell2012, Reference Brusatte, Lloyd, Wang and Norell2014; Romano Reference Romano2017; Cau Reference Cau2018; Nordén et al. Reference Nordén, Stubbs, Prieto-Márquez and Benton2018; Stubbs et al. Reference Stubbs, Benton, Elsler and Prieto-Márquez2019), pterosaurs (Butler et al. Reference Butler, Brusatte, Andres and Benson2011; Prentice et al. Reference Prentice, Ruta and Benton2011; Foth et al. Reference Foth, Brusatte and Butler2012), crocodyliforms (Young et al. Reference Young, Brusatte, Ruta and Andrade2010; Stubbs et al. Reference Stubbs, Pierce, Rayfield and Anderson2013), ichthyosaurs (Thorne et al. Reference Thorne, Ruta and Benton2011), procolophonids (Cisneros and Ruta Reference Cisneros and Ruta2010), therapsids (Ruta et al. Reference Ruta, Angielczyk, Fröbisch and Benton2013), eutherian mammals (Halliday and Goswami Reference Halliday and Goswami2016), and early tetrapods (Ruta and Wills Reference Ruta and Wills2016). Although these studies are largely palaeobiological in nature, the approach can be extended to any morphology-based character–taxon matrix (e.g., Ericales flowers; Chartier et al. Reference Chartier, Löfstrand, von Balthazar, Gerber, Jabbour, Sauquet and Schönenberger2017). The co-option of discrete character–taxon matrices, intended to infer the phylogenetic history of a given group, for the purpose of evaluating patterns of morphological variation assumes that the epistemology of cladistic data is applicable to morphospace reconstruction (for a discussion specific to dinosaurs, see Benson Reference Benson2018). Among the issues identified are the subjective nature of character constructions, overall and per-taxon proportions of missing data, the treatment of inapplicable characters, the exclusion of autapomorphic characters in cladistic matrices constructed for analysis by maximum parsimony, and the coding practices employed in their construction (Smith et al. Reference Smith, Rosario, Eiting and Dumont2014; Hetherington et al. Reference Hetherington, Sherratt, Ruta, Wilkinson, Deline and Donoghue2015; Hopkins and Gerber Reference Hopkins, Gerber, Nuno de la Rosa and Müller2017; Benson Reference Benson2018; Gerber Reference Gerber2019).
The results presented here introduce an additional complication to the blind interpretation of those morphospace patterns derived from the ordination of discrete morphological characters: extrinsic factors seemingly unrelated to the character codings (such as body size) can nonetheless influence ordinated proxies of morphology. We demonstrate that a majority of dinosaur clades display a previously unrecognized statistically significant correlation between the first ordinated axis of variation and body mass (Fig. 1, Table 1). The usage of ordination to characterize the morphology of hypothetical ancestral taxa—and the downstream interpretation of macroevolutionary dynamics (e.g., Cau Reference Cau2018)—is equally susceptible to the effects of extrinsic factors, such as body size (Fig. 5). The strength of the body-mass correlation and the extent to which it influences the set of principal coordinate axes can vary considerably and may not be of concern in certain cases. However, the majority of the matrices tested here had at least one axis with a correlation coefficient higher than that expected by chance (Fig. 2) and, typically, it is PCo1, which, along with PCo2, often forms the basis upon which general morphological patterns are interpreted. Importantly, significant correlations among subsequent PCo axes and for the complete set of PCo axes (Table 2, Fig. 2) imply that the effects of body size cannot be counteracted by simply selecting the next axis in the series, a common approach used for continuous linear-measurement data.
Finally, body-mass correlations extend down to the level of the discrete character–taxon matrix, represented as a computed distance matrix (such as through MORD). The results of the Mantel tests are broadly congruent with those carried out on the PCo ordination (Figs. 2, 3, Tables 1, 2), indicating that Mantel tests can be used to identify potential relationships between life-history traits and morphological distance matrices. In summary, the consequences cascading from this relationship are strong enough to call into question macroevolutionary hypotheses derived from analysis of ordinated discrete-character data (see “Implications for Macroevolutionary Studies”). Relationships of a similar or weaker magnitude between cladistic and functional disparity have previously been described among early gnathostomes (Anderson and Friedman Reference Anderson and Friedman2012), indicating another potential source of variation that cannot be accounted for by discrete morphological characters. Correlations between size and the principal axis of variation are well established when using linear measurements within the context of a PCA (Jolicoeur Reference Jolicoeur1963) but, to our knowledge, such relationships have not been identified when using morphological categories within the context of a PCoA.
The correlation between the morphological proxy (PCo1) and body mass appears to be independent of the coding strategy employed during the construction of the original cladistic matrix (i.e., contingent or multistate coding; Hawkins et al. Reference Hawkins, Hughes and Scotland1997). Both methods vary in their treatment of complex transformational series. Multistate characters define all variations of a trait within a single series, including a state to represent the absence of the trait. Contingent coding defines characters within a hierarchy, wherein a primary character typically denotes the presence or absence of a feature, with secondary characters describing variations within the feature, where present. For taxa in which the primary feature is absent, all secondary characters are coded as inapplicable (Brazeau Reference Brazeau2011). In such cases, a greater number of characters are needed to describe the presence and form of traits than would be required for an equivalent multistate character. Given that previously used dissimilarity metrics and, by extension, PCoA do not differentiate between inapplicable and missing data, contingently coded matrices will be construed as having large quantities of “missing data,” which can lead to problems in reconstructing morphospaces. Gerber (Reference Gerber2019) cautioned against the use of character–taxon matrices with large amounts of missing data in relation to morphospace reconstruction, as missing data from fossils tend to be nonrandomly distributed, thus limiting the potential overlap between taxa. In addition, taxa with missing data due to inapplicable characters will be forced into subspaces of the morphospace in which they do not belong (Gerber Reference Gerber2019). However, two of the theropod matrices that were reanalyzed here (Brusatte et al. Reference Brusatte, Lloyd, Wang and Norell2014; Cau Reference Cau2018) that overlap in a large number of coelurosaurian taxa and that use multistate or contingent coding strategies, respectively, show similar and very strong correlations between PCo1 and body mass. This implies that coding strategy may have a relatively minimal effect on the principal axis of variation, although this too may depend on how strong the relationship is with the extrinsic factor. Dissimilarity metrics designed to handle inapplicable characters have recently been proposed (Hopkins and St John Reference Hopkins and St John2018) and have an implementation in current development versions of Claddis (Lloyd Reference Lloyd2016), and their usage represents an intriguing direction for future studies investigating morphospaces based on discrete characters and for evaluating the presence of extrinsic factors, such as those described here.
Implications for Macroevolutionary Studies
Our results recovered a previously unrecognized relationship between size and PCo1 derived from the ordination of character–taxon matrices. These results suggest that the principal drivers of variation used to test/generate macroevolutionary hypotheses may have inadvertently quantified the evolution of size rather than the assumed body plan. Therefore, what effects could be expected? For instance, Cau (Reference Cau2018) described the trajectory of PCo1 through time within the context of three phases documenting the major transitions in the evolution of birds (Fig. 5, orange line). The first phase corresponds with the early dinosaur and theropod evolution, which was largely static with respect to the accumulation of avian traits. The second and most dramatic shift in morphology (sensu Cau Reference Cau2018) started among ancestral coelurosaurs, referred to as “phase II” by the author, and was marked by a rapid accumulation of paedomorphic theropod characteristics. These patterns were interpreted to couple with the most significant variation in the rates of evolution as determined by Bayesian phylogenetic analysis of the discrete character–taxon matrix (Cau Reference Cau2018) and correspond with a similar elevated-rate pattern of evolution previously reported in the maniraptoran ancestors of modern birds (Brusatte et al. Reference Brusatte, Lloyd, Wang and Norell2014). Thus, it was suggested that changes in whole-body morphology could be coupled with the high evolutionary rates within coelurosaurs and basal avialans. The third phase was a return to morphological stasis within ancestral ornithuromorphs, denoting the onset of phase III (Cau Reference Cau2018); but note that Brusatte et al. (Reference Brusatte, Lloyd, Wang and Norell2014) recovered consistently higher evolutionary rates among ornithuromorphs. However, a significant amount of variation in the ancestral PCo1 of Cau's (Reference Cau2018) matrix can be attributed to estimated ancestral body mass, even after serial correlation is accounted for (Fig. 5, Table 3). Cau (Reference Cau2018) considered sustained body miniaturization to characterize phase II, defined by the dramatic shift from negative to positive values along the uncorrected PCo1 (Fig. 5). Once the relationship with size is accounted for, we are unable to confirm the occurrence of well-defined shifts hypothesized to have taken place during this interval (i.e., related to dietary shifts, forelimb elongation, tail reduction, etc.; Cau Reference Cau2018: Fig. 9) beyond a steady accumulation of characteristics through the entire time series. Therefore, we conclude that there is little support for a three-phase evolutionary process along the ASL and that ordination methods, such as those described by Cau (Reference Cau2018) and replicated here, should be scrutinized for potential extrinsic confounding factors, such as body size.
It is possible that the association between PCo1 (or all PCo axes) and size is part of a broader macroevolutionary “common cause,” whereby morphology and body size undergo simultaneous directional change, such as trends toward larger sizes (i.e., Cope's rule; Kingsolver and Pfennig Reference Kingsolver and Pfennig2004) or miniaturization (see Turner et al. Reference Turner, Pol, Clarke, Erickson and Norell2007). However, detailed modeling of body-size evolution among dinosaurs rejected both active and diffuse trends in favor of a constrained adaptive landscape model (Benson et al. Reference Benson, Hunt, Carrano and Campione2018). This indicates that a widespread directional trend within dinosaurian clades is not sufficient to explain our observed correlations. Our analyses suggest that a coupling between morphology and body sizes is characteristic of the majority of dinosaur lineages at differing temporal scales (Table 2, Figs. 2, 3) and, while this study focuses on dinosaurs, we expect such relationships to be present in other tetrapod groups. Consequently, the pervasiveness of size-dependent morphological proxies, such as those revealed for dinosaurs in our tested datasets, suggests that body size can overwhelm evolutionary patterns of body plan, clouding our subsequent interpretations (e.g., Fig. 5). At present, the extent to which size is an intrinsic property of ordinated morphological proxies calculated from discrete character–taxon matrices remains uncertain, as do the specific characters that may be driving such an association. The results of the Mantel and pGLS tests (Table 2, Figs. 2, 3) suggest that body size is, to a varying degree, related to the entire dataset, not just PCo1, and moreover, that PCo1 need not be the axis with the strongest correlation to size. Recent methods have been developed that use the pairwise distance indices from the dissimilarity matrix to assess morphological variability (Hughes et al. Reference Hughes, Gerber and Wills2013; Close et al. Reference Close, Friedman, Lloyd and Benson2015; Lloyd Reference Lloyd2016), an approach that mitigates the issues related to deciding the number of ordinated axes that should be used. However, considering that our results indicate that body size may well represent an intrinsic property of many discrete character–taxon matrices down to the level of the dissimilarity matrix (Table 2), it is possible that body size has had an effect on analyses of disparity within dinosaurs (e.g., Brusatte et al. Reference Brusatte, Butler, Prieto-Márquez and Norell2012). Accordingly, if we are to use discrete character–taxon matrices to reveal the evolutionary transitions of major body plans and interpret the relative rate at which character “modules” are acquired, then our results strongly support the identification and possible decoupling of size-dependent morphological proxies.
Conclusions and Future Considerations
Despite the common usage of character-based ordination approaches to reconstruct morphospace and disparity, results presented here demonstrate the need for a greater understanding of the factors driving the reconstruction of morphospaces before interpreting macroevolutionary dynamics. Avenues of further exploration include: the reduction of missing data through pruning of poorly sampled characters and/or taxa; the addition of characters that represent autapomorphies for in-group taxa (Gerber Reference Gerber2019); and the use of new methods for calculating dissimilarity matrices, such as the previously mentioned metric that can account for inapplicable characters (Lloyd Reference Lloyd2016; Hopkins and St John Reference Hopkins and St John2018). The main hindrance to the implementation of methods used in this study is the general lack of body-mass estimates for extinct taxa. For example, previous studies examining the evolution of body size in crocodylomorphs (Sookias et al. Reference Sookias, Butler and Benson2012) used femoral length as a size proxy; however, femoral length provides a weak proxy for size when applied to ecologically and functionally variable taxa (Campione and Evans Reference Campione and Evans2012). Large-scale databases of mass estimates for extinct members of tetrapod groups (e.g., early amniotes, synapsids, crocodylomorphs) can be constructed using the same limb-scaling relationship previously used for dinosaurs (Campione and Evans Reference Campione and Evans2012; Benson et al. Reference Benson, Campione, Carrano, Mannion, Sullivan, Upchurch and Evans2014, Reference Benson, Hunt, Carrano and Campione2018) to determine the extent of size-dependent morphological proxies and, in turn, the ability to generate more comprehensive macroevolutionary hypotheses from explorations of morphospaces.
We recommend that future analyses investigating character-based morphospaces adopt the following general guidelines.
1. Efforts should be made to identify the characters, or groups of characters, driving the axes of variation. Although general drivers can be interpreted indirectly by examining the distribution of taxa, a more quantitative and direct approach is recommended. For instance, Carrano et al. (Reference Carrano, Janis and Sepkoski1999) used rank correlation to associate proportional data with nonmetric multidimensional scaling axes. Although, such an approach is not recommended for categorical data (i.e., phylogenetic characters), linear or binomial logistic models could be used to assess the strength and direction of the relationships between characters and associated axes.
2. The correlation between the data set (either through the dissimilarity matrix or the final ordinated axes) and body size should be explored. Given the results of this study, such correlations are expected and, although potentially a reflection of evolutionary history, may unintentionally lead to size-related interpretations of morphology.
3. The evolutionary patterns of size-dependent morphological proxies should be explored carefully. A linear null-model approach incorporating mixed effects, such as that used here, can be applied to decouple size from morphological proxies and examine size-independent proxies along with body-size evolution, separately. Interestingly, such approaches could simultaneously incorporate phylogenetic topological uncertainties (Fuentes et al. Reference Fuentes-G, Polly and Martins2020). These are particularly relevant when examining time-series analyses and can be built into models that evaluate morphology and disparity over time (Adams et al. Reference Adams, Collyer and Kaliontzopoulou2019; Fig. 5).
Acknowledgments
This study was completed as part of T.B.'s doctoral research at the University of New England. We thank A. Cau for his thought-provoking and synthetic work that instigated our investigation of body size and discrete-character morphospace. We thank P. Bell, R. Benson, and S. Poropat for providing valuable comments on an early version of this article and to two anonymous reviewers who provided thoughtful and constructive comments that improved the quality of the study. T.B. was supported by a Research Training Program scholarship administered by the Australian Government, and is currently supported by the University of New England Postdoctoral Fellowship Scheme. N.E.C. is supported by an Australian Research Council Discovery Early Career Researcher Award (project ID: DE190101423).