Introduction
The Sydney City-2-Surf (Australia) is the world’s largest fun run marathon. Run annually along a 14km course from the Hyde Park in Sydney to Bondi Beach in August, it has seen participant growth from an initial 2,000 runners in 1971 to around 80,000 people in 2016.1 The characteristics of participants has changed over that time, with recent events having a roughly equal gender split and broad participation from all age groups and ability levels. This large level of participation, and the variety in running ability and preparedness, has resulted in a significant and evolving burden of injury during the event. The New South Wales Department of Health (NSW Health; Sydney, New South Wales, Australia) and the Ambulance Service of New South Wales (NSW Ambulance; Rozelle, New South Wales, Australia) have primary responsibility for the provision of emergency services for the City-2-Surf. New South Wales Health is also assisted by volunteer first aid organizations who provide supplementary first aid services along the track. Planning for the health services on race day is a complex task due to the large number of entrants, their varying preparedness, meteorological conditions, and uncertainty and the characteristics of the course.
Previous research exploring the epidemiology of City-2-Surf casualties showed that in the period of 1978 to 1984, 144,950 runners entered the race, and of these, 1,883 (1.3%) were treated for minor musculoskeletal and dermal injuries while 275 (0.2%) were treated for medical conditions, mainly heat exhaustion and physical exhaustion.Reference Richards, Richards and Whittaker2 Since 1984, the participant cohort has grown from approximately 30,000 to approximately 80,000, and the demographics of the population have shifted from around 80% males, who were generally young, in 1984 to roughly even gender representation today with broad age participation. It is now likely that injury patterns in the City-2-Surf differ from those reported previously.
A six-year analysis of injuries occurring in the Army Ten Miler, an annual 16km race in the USA, showed that most injuries were categorized as musculoskeletal (44.0%); followed by general medical injuries (29.0%), mainly exercise associated collapse (EAC) and dehydration; and dermatological injuries (27.0%).Reference Pasquina, Griffin, Anderson-Barnes, Tsao and O’Connor3 More recently, a three-year review of injuries occurring in the Singapore Army half-marathon, a run with two separate tracks of 21km or 10km, revealed a majority of musculoskeletal conditions (37.9%), followed by dermatological injuries (29.2%), EAC (22.1%), and other medical (10.8%).Reference Tan, Tan, Kok, Lee and Lee4 Course length appears to also have an impact on injury frequency, with an analysis of a 42km marathon cohort revealing that most injuries of casualties presented at the start/finish line (65.8%), none at the 6.5km station, 4.3% at the 16km station, 13.8% at the 22km station, and 15.8% at 32km.Reference Nguyen, Milsten and Cushman5 Meteorological conditions have also been found to have an impact on injury frequency. A positive relationship between warm temperature and/or humidity and the rate of casualties during mass-gathering events has previously been noted,Reference Baird, O’Connor, Williamson, Sojka, Alibertis and Brady6 with a positive relationship between heat index and numbers of casualties found.Reference Arbon7–Reference Zeitz, Schneider, Jarrett and Zeitz10
The relationship between casualty numbers in the City-2-Surf predicted from the corrected effective temperature (an index incorporating temperature, humidity, radiation, and wind speed) was previously published.Reference Richards, Richards and Whittaker2 Due to changes in the race population, differences in the provision of first aid during the event, and recording of injuries, this model may not accurately estimate the number of casualties. Additionally, the historical model only provides estimates of overall numbers of casualties and does not address factors such as distance or course geography.
The aim of this study was to examine treatment records held by NSW Health that describe all formally treated casualties the past seven years of the City-2-Surf fun run and conduct retrospective analysis of the types, locations, and features of these casualties. The study would then examine possible relationships or linkages between the meteorological conditions on the day of the run, the geographic features of the course, and the casualties that occur.
Methods
In this study, de-identified health records were utilized to retrospectively identify the type, location, and timing of injuries during historical City-2-Surf events. This study was approved by the South Eastern Sydney Local Health District Human Research Ethics Committee (Sydney, Australia; 16/368 - LNR/16/POWH/696) and organizational approval from NSW Health, NSW Ambulance, and Fairfax Media (Sydney, Australia). Overall demographic data for the participants in the City-2-Surf for the years 2010-2016, including age and gender, were obtained directly from Fairfax Media City-2-Surf administration.
Casualty Records
Records of casualties formally treated at the City-2-Surf have historically been documented in different formats, dependent upon which branch of the health services managed the casualty on the day. Casualties treated at the NSW Health medical stations were recorded on paper Disaster Patient Record Forms, completed at the medical station by treating medical teams. For this project, an initial sample of 292 de-identified Disaster Patient Record Forms for race years 2010-2016 were obtained from NSW Health by requesting de-identified copies of all such records available from the time period. This represented all available medical records from NSW Health from City-2-Surf-related health facilities. Unblinded data abstraction was conducted by JV, with oversight from DH and LW; JV received dedicated training by DH and LW for the abstraction of relevant clinical and location data from the paper records. Data requiring clarification or adjudication were reviewed by DH and LW. The consistency of data abstraction was checked with regular review and oversight by DH and LW throughout the abstraction process.
Casualty records for NSW Ambulance patients treated away from NSW Health medical stations were obtained for the postcodes that the City-2-Surf course traverses between 7:00am and 7:00pm on the race days for the years 2000 and 2004-2016. These records were obtained by formal data request to NSW Ambulance, and were provided to the researchers as a de-identified dataset, including specified location and time variables, alongside clinical data recorded in electronic format. This provided records of every patient encounter with NSW Ambulance services in the geographic vicinity of the City-2-Surf at the approximate time of the race. A total of 635 records were obtained across two databases, 103 records in the Emergency Medical Records (EMR) database from 2012-2016 and 532 in the Primary Health Care Record (PHCR) database from years 2000, and 2004-2016.
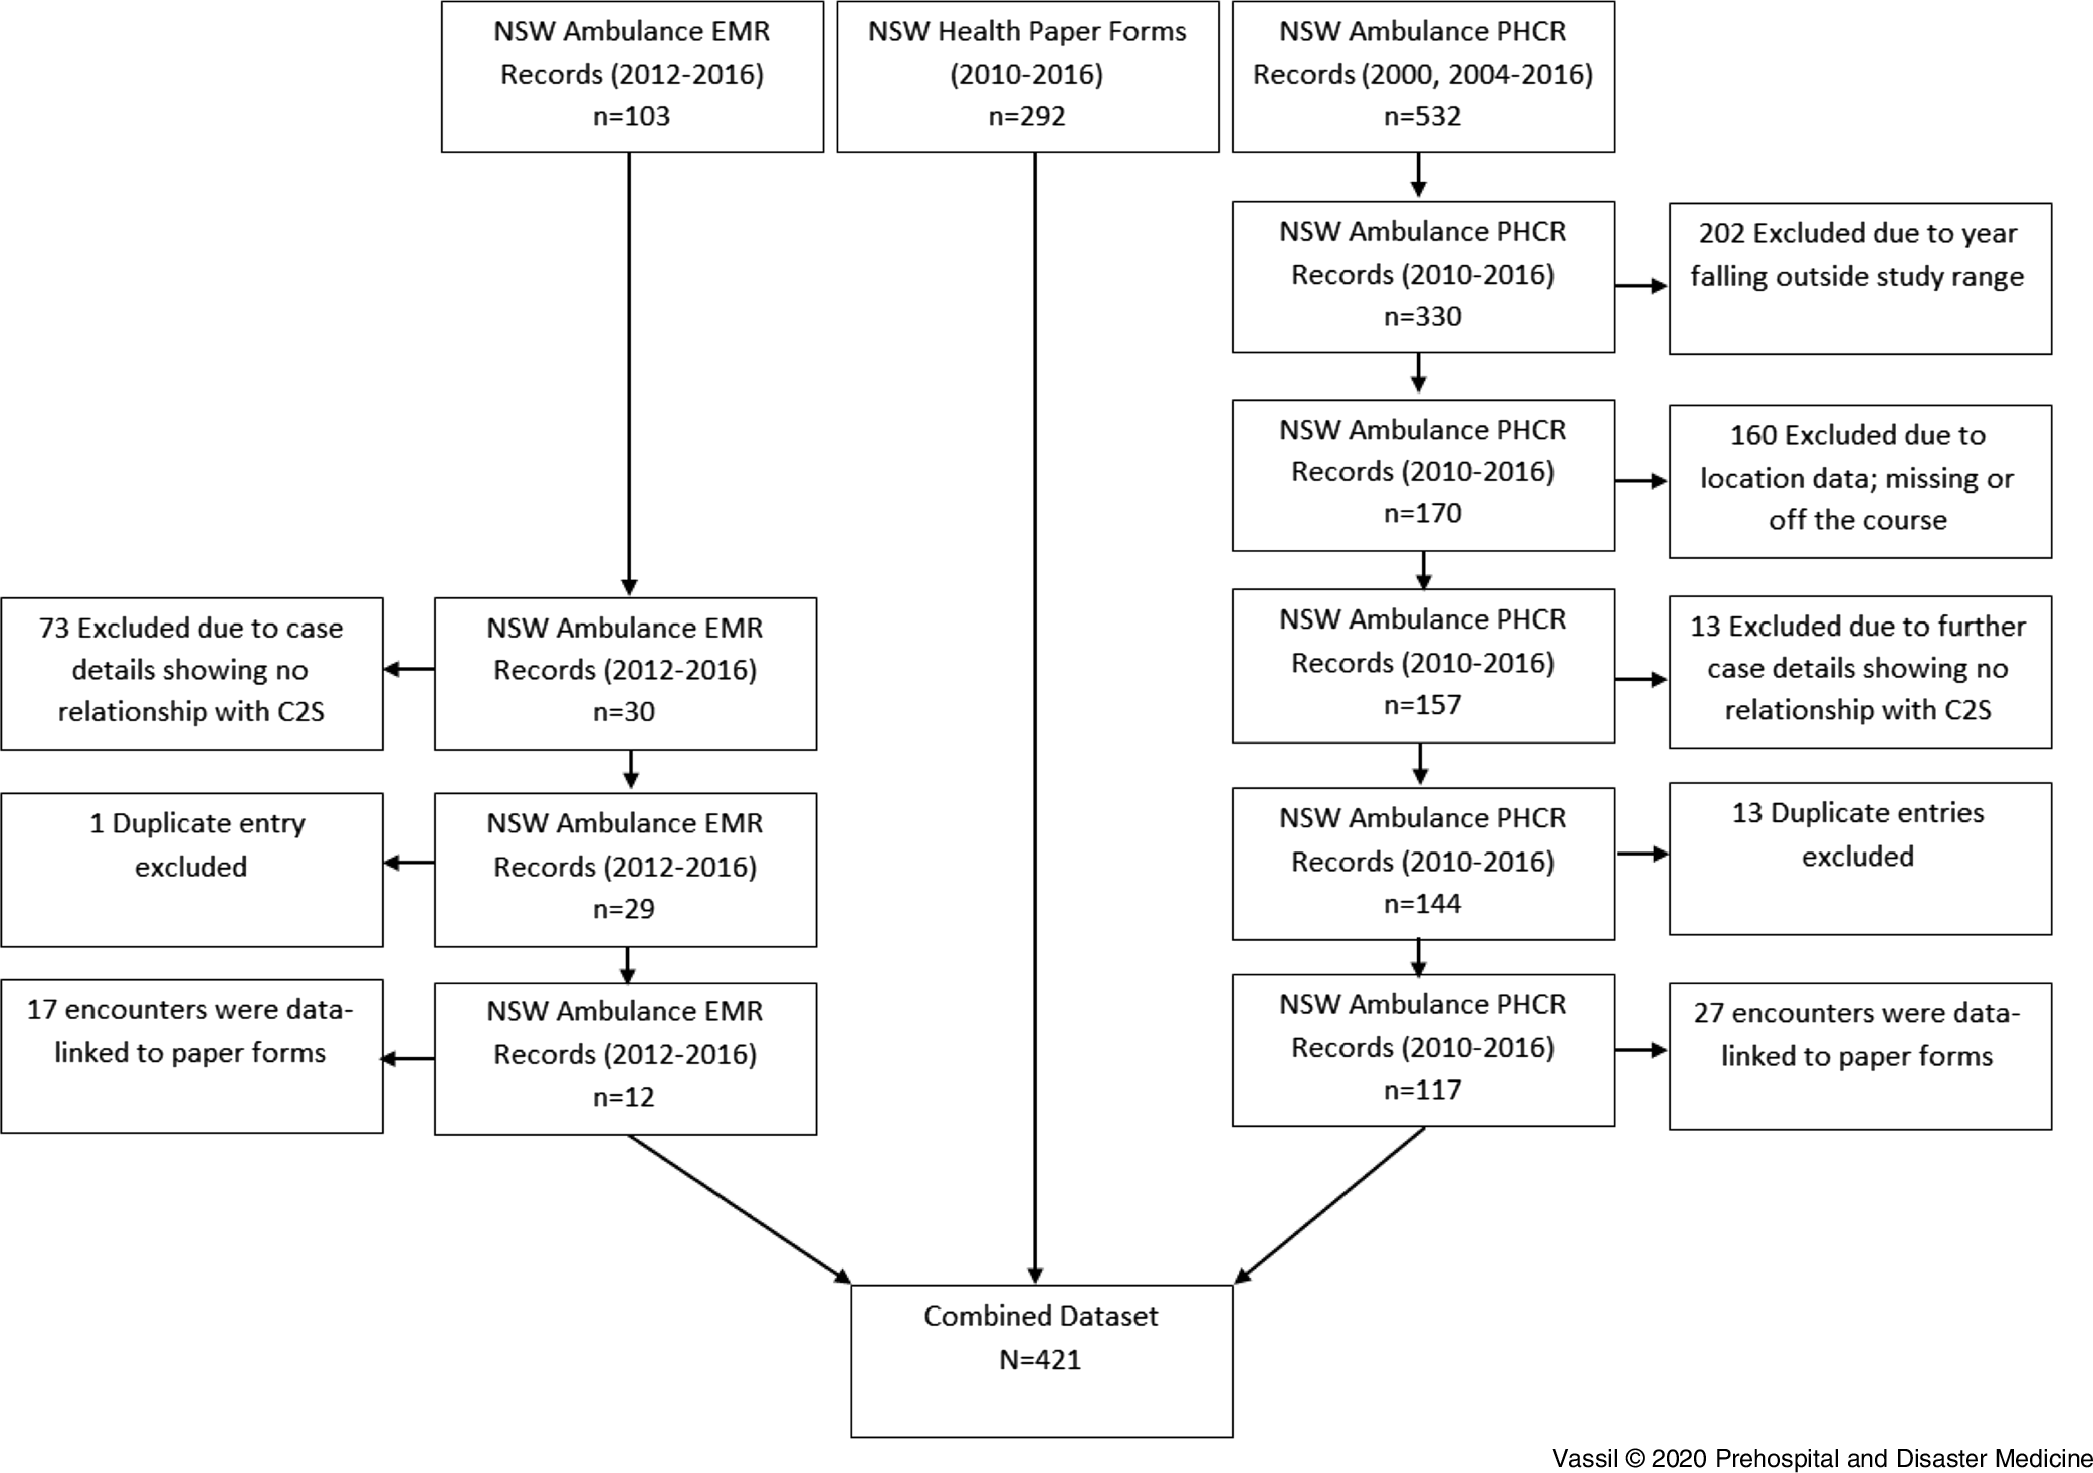
Records of casualties treated by both NSW Health and NSW Ambulance were identified and linked, where possible, within a consolidated dataset. The process of data inclusion and exclusion and final linkage is shown in Figure 1.
Data Source Inclusion and Exclusion Flowchart.

Records from the EMR database contained full-text case details. These records were screened to identify clinical cases clearly unrelated to the City-2-Surf race, firstly by JV and confirmed by case review by DH and LW. A total of 73 records were excluded due to the clinical presentation clearly having no relation to the race. Such cases included childbirth, mental health problems, drug-related problems, and other medical problems from individuals clearly not participating in the race. The exclusion of each case was confirmed by a systematic case series review by JV, DH, and LW.
Records from the PHCR database did not contain in-depth case details, and as such, were more difficult to filter. It was decided that PHCR records prior to 2010 would not be included in the study as paper forms for these years were not able to be obtained and the ambulance records alone gave an incomplete picture of the casualties occurring on the day. This resulted in 202 records being excluded. The PHCR records were then filtered by Global Positioning System (GPS) location with encounters occurring more than 100m off the course excluded. A total of 160 records were excluded in this way, while an additional 13 were excluded due to details that affirmed no relationship between the casualty and the race; for instance, casualties that occurred at nursing homes along the course. In total, 13 duplicate entries were excluded and 27 entries were linked to casualties also recorded on the paper forms. A total of 117 casualties from the PHCR database were included in the final combined dataset of 421 cases.
Each record in the combined database was then categorized into one of 11 groups: hyperthermia/heat exhaustion, musculoskeletal, physical exhaustion, cardiovascular, anaphylaxis, respiratory, gastrointestinal, medication requests, hypothermia, unknown, and other casualties.
Meteorological Data
Raw meteorological data from the date of each race was sourced from the Australian Bureau of Meteorology (Melbourne, Australia).11 Bi-hourly measurements were obtained for dry bulb temperature, wet bulb temperature, relative humidity, and dew point from the Observatory Hill station in the Sydney Central Business District, while measurements for wind speed and direction were obtained from the Fort Denison station. Both sites are within 2km of the start of the course. These data were then processed to formulate the heat indices at 30-minute intervals for the days of the run. For the purposes of this study, the apparent temperature (AT) and wet bulb global temperature (WBGT) were used.11–13 Standard formulas described by the Australian Bureau of Meteorology11 were used to calculate these heat indexes. Historical meteorological data were then assigned to casualty records at the time and location of injury. Additional meteorological calculations were calculated at 8:00am, 10:00am, and 12:00pm for aggregate data analysis.
Location and Gradient Data
Where recorded within the NSW Ambulance treatment record, GPS location coordinates were converted into a distance from the start of the race using online Google Map Services (Google; Mountain View, California USA). Roadway gradient was calculated in 100m increments from the elevation data (Fairfax Media; Figure 2).
City-2-Surf Course Elevation.

Statistical Analysis
Descriptive Analysis of the combined dataset was conducted for participant demographics and casualty demographics using SPSS version 22 (IBM Corp.; Armonk, New York USA) and Microsoft Excel 2013 (Microsoft Corp.; Redmond, Washington USA). Multivariate logistic regression analysis between meteorological conditions, geographic conditions (gradient), casualty types, and location were undertaken utilizing standard methodologies. Bivariate linear regression between the annual casualty rates/casualty mix and meteorological conditions was also performed.
Results
Participant Demographics
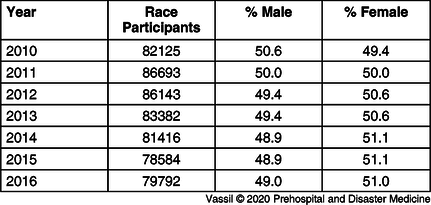
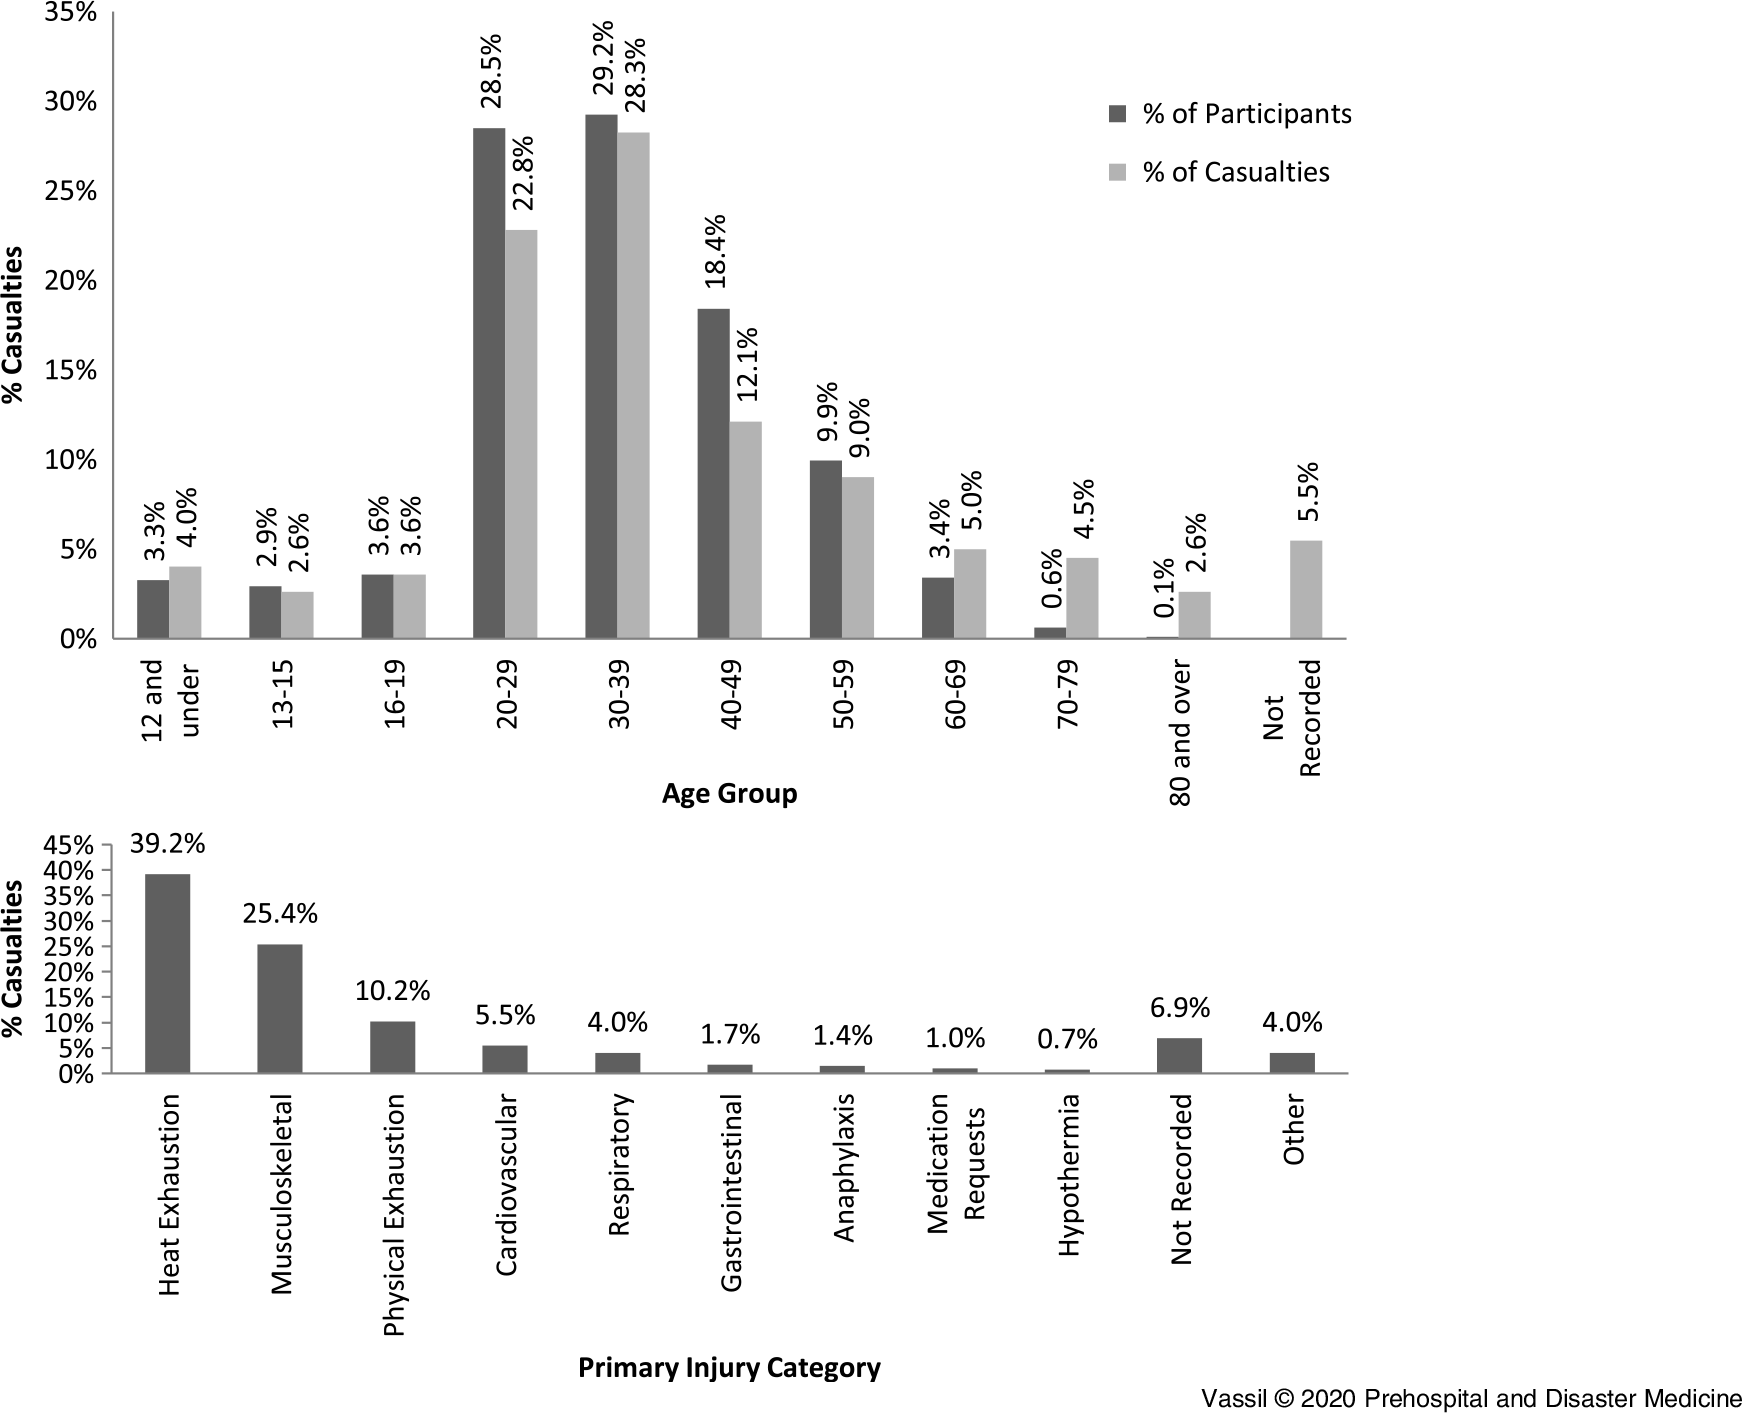
A total of 578,135 runners entered the City-2-Surf race over the years from 2010-2016. The number of participants in the race peaked at 86,693 in 2011, while the gender split remained roughly even over all the years studied. The age distribution remained relatively constant between years. The number of entrants and gender split by year is shown in Table 1, and the cumulative age distribution for all seven years is shown in Figure 3.14
City-2-Surf Participant Numbers and Gender Split by Year14

City-2-Surf Participants 2010-2016 Cumulative Age Distribution.14

Casualty Demographics
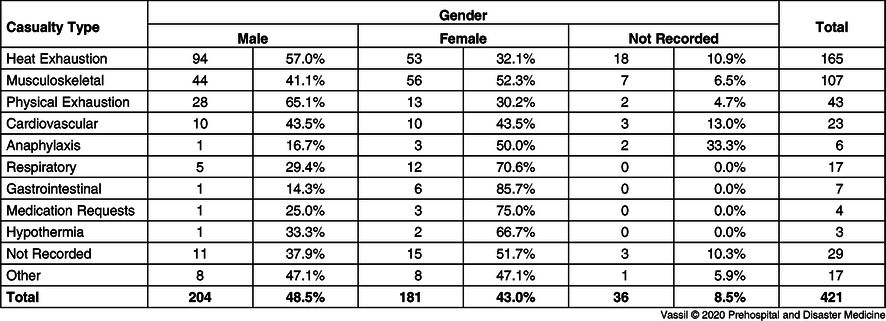
A total of 241 casualties were encountered by NSW Health and NSW Ambulance over the 2010-2016 runs. The most prevalent casualty was heat exhaustion/hyperthermia accounting for 165 of the casualties, followed by 107 musculoskeletal injuries, 43 cases of physical exhaustion, and 23 cardiovascular events. The full casualty distribution is shown in Figure 3. The mean age of the casualties was 37.6 years with a standard deviation of 17.4 years. The median age of casualties was 34 and the mode was 28 years with positive skew. Interestingly, while the majority of casualties occurred in the 20-29 and 30-39 age groups, there was relative over-representation of the youngest (<12) and older age groups (60-69, 70-79, and 80+) compared to the expected distribution based on participant age distribution (Figure 3).
Over the seven years studied, the gender split of the casualties was similar with 204, or 48.5% of casualties, having occurred in male participants and 181, or 43.0% of casualties, having occurred in females. Males presented with nearly twice as many cases of heat and physical exhaustion as females, while females presented with more than twice as many cases of respiratory problems (Table 2).
City-2-Surf Casualties 2010-2016 by Injury Category and Gender

Casualty Analysis
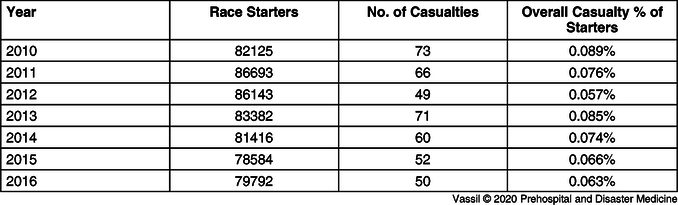
The annual number and rate of casualties varied despite relatively constant number of race starters across the years (Table 3). The highest number and rate of casualties occurred in 2010 with 73 casualties or 0.09% of starters, while the lowest casualty count and percentage was in 2012 with 49 casualties or 0.06%.
City-2-Surf Overall Casualty Rates 2010-2016

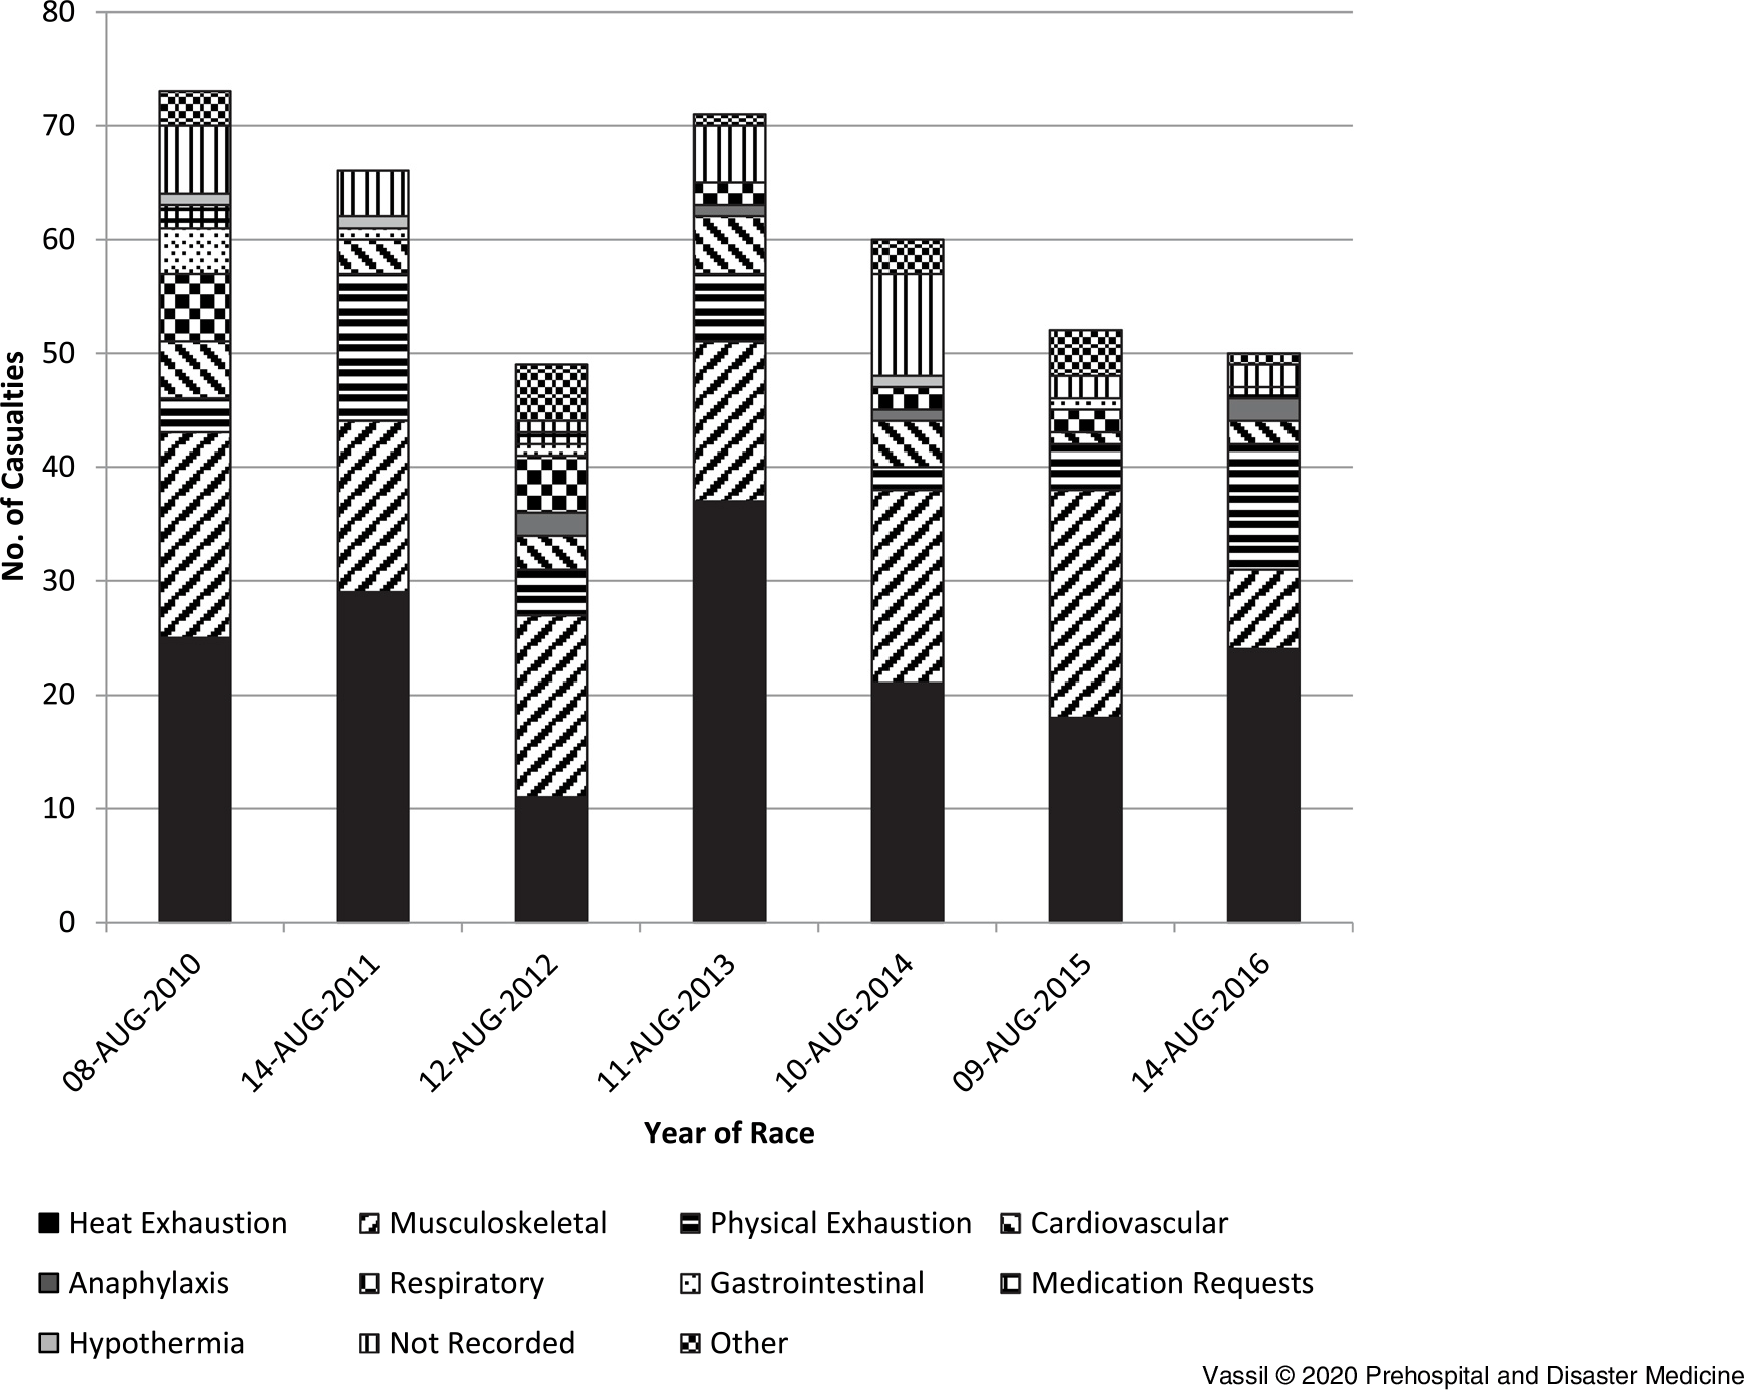
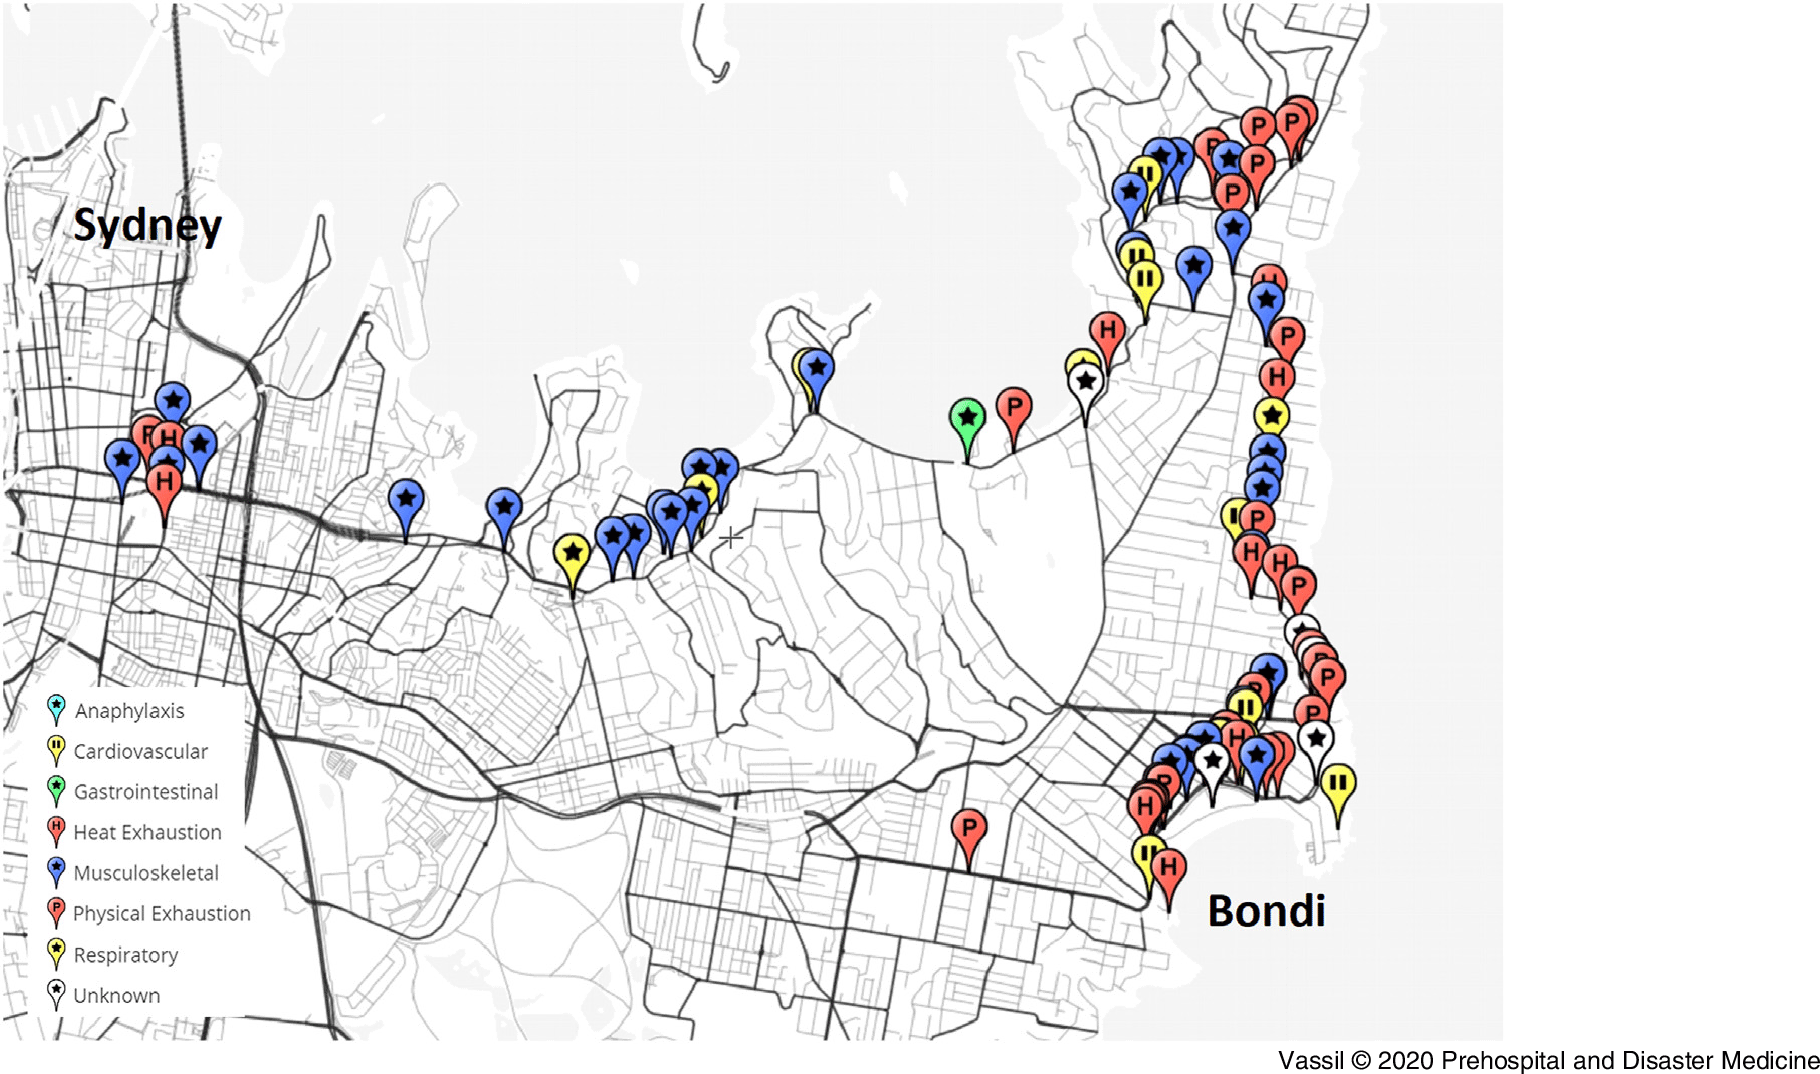
The types of casualty presentations encountered also varied between years (Figure 4). Heat exhaustion was the most prevalent casualty type overall, but fluctuated across the years. For example, in 2012, the number of heat casualties was lower than other years, and less than that of musculoskeletal casualties. The majority of casualties (88.0%) occurred between 9:00am and 1:00pm, and 62.2% of casualties presented for care at the end of the race. Differential patterns in injury presentation occurred according to distance and time. Heat exhaustion casualties were found predominantly in the second-half of the course, and the majority occurring at the end of the race (14km). A similar pattern was found for physical exhaustion. Musculoskeletal injuries presented across the entire course, with suggestions that steep negative gradients found at around 3km into the race increased musculoskeletal injury rate. Cardiovascular events appeared to cluster at 7km, or around the midpoint of the race (Figure 5), at the same location of the long steep incline known as “heartbreak hill.”
City-2-Surf Casualty Type by Year of Race.

Map of City-2-Surf Casualties with Recorded Locations 2010-2016.

The locations of casualties were plotted utilizing the GPS coordinates of the NSW Health medical facilities and the NSW Ambulance casualty records (Figure 5). Geographic clustering of different types of casualties along the course, as already mentioned, was clearly visible.
Regression Analysis
Multivariate logistic regression analysis was undertaken to examine relationships between casualty types, location, and gradient. No statistically significant relationships were uncovered between subgroups.
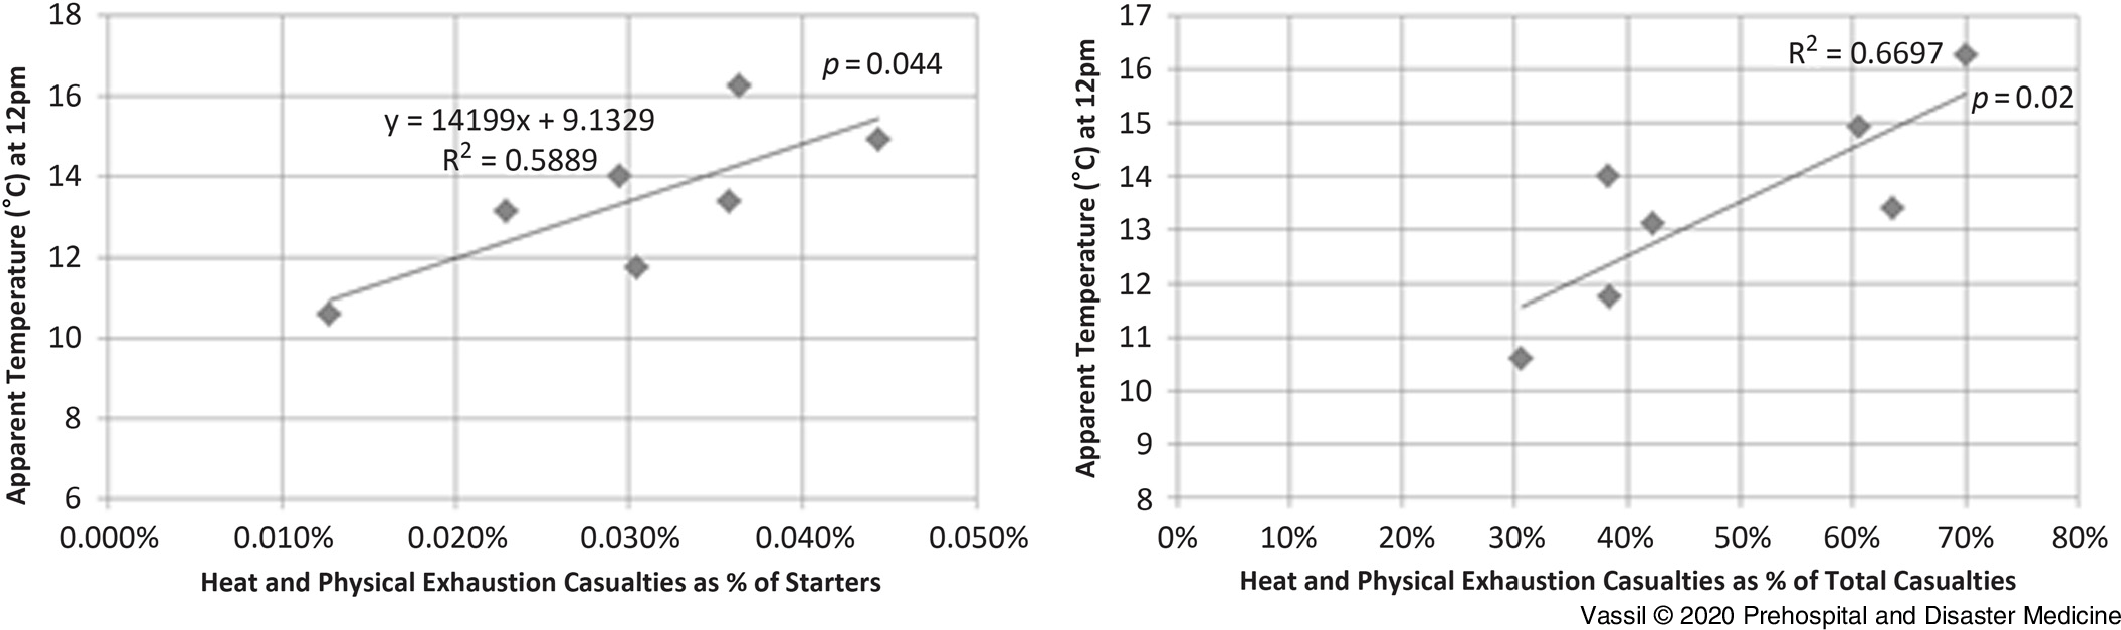
Bivariate linear regression was then used to examine the relationship between the number of casualties that occurred each year and the meteorological conditions on the day of the run. No significant relationship between overall casualty numbers and meteorological conditions was found. However, a statistically significant positive linear association between the AT and overall incidence of heat and physical exhaustion casualties (R2 = 0.59; P = .044) was found. Additional regression analysis was undertaken to determine the effects of meteorological conditions on the casualty mix that presented on race day. A statistically significant, positive relationship existed between the percentage of exhaustion casualties in the casualty mix and the AT (R2 = 0.67; P = .02).
Discussion
This study has shown that associations exist between geographic conditions, meteorological conditions, and the type, number, and location of casualties that occur at the Sydney City-2-Surf race.
In this study, the two main casualty groups found in the City-2-Surf from 2010-2016 were heat-related (39.2%) and musculoskeletal injuries (25.4%). This is consistent with previous literature in similar contexts.Reference Richards, Richards and Whittaker2–Reference Tan, Tan, Kok, Lee and Lee4 However, in all the studies reviewed, including the past City-2-Surf studies, musculoskeletal injuries were more prevalent than heat-related injuries.Reference Richards, Richards and Whittaker2–Reference Tan, Tan, Kok, Lee and Lee4 The variation in this study may be a consequence of the different features of the track, course length, and that minor musculoskeletal injuries could have presented and been managed through alternative pathways (eg, first aid resources not analyzed in this study).
The geographic distribution of casualties along the course showed some important patterns. Overall in this study, the 62.2% of casualties that occurred at the end of the race is indicative of the literature, closely agreeing with the findings of Nguyen, et alReference Nguyen, Milsten and Cushman5 that 65.8% of casualties presented at the finish rather than during the race itself. Interestingly, clusters of injury types emerged along the track over all the years studied (Figure 5), with a large cluster of falls at approximately 3km into the race corresponding with the steepest negative gradient of the track (-18%). Conversely, a cluster of cardiovascular events around 7km is corresponded with the top of “heartbreak hill,” the longest uphill climb of the course. This is the first study that has reported the location of casualties and types of casualties utilizing geolocation, and that has demonstrated such clear clustering between segments of a varied event course and type of injury over time.
Analysis of the distribution of casualties over time and distance also provides an important insight for first aid planning, allowing a determination of the usual time at which further casualties are no longer seen at various points along the race, facilitating repositioning of now unused health assets to other areas of need.
The relationship between meteorological conditions and casualty incidence at mass gatherings is widely recognized in the literature; however, there is disagreement over which meteorological variables best display this relationship.Reference Baird, O’Connor, Williamson, Sojka, Alibertis and Brady6 This study examined six different variables: air temperature, wet bulb temperature, dew point, relative humidity, WBGT, and AT, at three different times over the race: 8:00am, 10:00am, and 12:00pm, along with a day average. A positive relationship was found between the AT index at 12:00pm and the incidence of heat and physical exhaustion casualties (R2 = 0.59; P = .044; Figure 6). This finding is consistent with previously reported literature showing relationships between casualty incidence and heat index.Reference Arbon7–Reference Zeitz, Schneider, Jarrett and Zeitz10 Other meteorological measures did not show a significant correlation with casualty incidence.
Heat and Physical Casualties Treated by NSW Health (2010-2016) Analysis with Meteorological Variables.

Utilizing the linear regression model developed in Figure 6, planners can estimate the number of casualties expected for various meteorological conditions at 12:00pm, with extrapolation possible utilizing historical participant demographics. This method would allow planners to more closely match expected burden of injury for upcoming events, and place health support resources accordingly. An additional analysis of the casualty data utilizing casualty type proportions (the relative proportion of different types of casualties) was also conducted. This showed that there was a significant relationship between casualty type proportion and meteorological conditions. On cooler days, only 30% of casualties are exhaustion, while this rose to 70% on warmer days (Figure 4). These data would suggest that the mix of casualties significantly changes with meteorological conditions with additional heat burden associated with higher exhaustion and heat injury.
First aid services provided to runners during the City-2-Surf are also managed by approved first-aid organizations other than NSW Health and NSW Ambulance. Minor injuries and complaints are managed through this route, with more serious or complex injuries referred to NSW Health or NSW Ambulance services along the route, or directly to hospital via NSW Ambulance. The most important of these first aid organizations is St John’s Ambulance (Burwood, New South Wales, Australia) who have provided extensive historical support to the City-2-Surf. Casualty treatment data from St John’s Ambulance were not available for inclusion in this study, likely resulting in exclusion of a set of minor ailments and conditions not sufficiently severe to warrant formal clinical intervention, and thus an under-estimation of some musculoskeletal, dermatological, or minor heat injuries.
Further studies encompassing additional casualty data from St John’s Ambulance would be useful in gaining an even deeper understanding of injury patterns. An increased volume of casualty data would likely allow multivariate logistic regression analysis to be conducted more successfully, while in a subsequent study, further meteorological relationships can be examined, such as the effect of rainfall on casualties.
Limitations
A significant number of NSW Ambulance records were excluded in this study as they referred to race dates prior to the introduction of other clinical records necessary to allow comparison with 2010-2016 data. The inclusion of this earlier data in future studies would likely allow more detailed comparisons and statistical comparison of subcategories, and potentially improve the generalizability of the findings to other contexts. While data quality was usually excellent where present, particularly for NSW Ambulance electronic records, paper-based records required significantly more interpretation and were prone to data gaps. This did not usually relate to the variables collected for the purpose of this study, but would affect any more detailed data collection and analysis utilizing these records. In this study, the impacts of poor handwritten clinical notes or absent data were mitigated by a review of other available clinical information on record, allowing completion of critical data such as primary diagnosis. Two subject matter experts provided data clarification as required, resolving most cases and, where appropriate, confirming the need to exclude records where data quality was inadequate. While this is likely to have minimized observer bias with the primary abstractor, future studies would benefit by using independent data abstractors coupled with subject matter adjudication.
Conclusion
This study highlights the relationships that exist between geographic conditions, meteorological conditions, and the type and number of casualties that occur in the Sydney City-2-Surf race. Patterns and features of relevance to health support planning were found in the distribution of casualty types along the course, particularly apparent associations between the gradient of the course and injury category. A linear relationship between the AT at 12:00pm and the number of heat and physical exhaustion casualties may allow planners to estimate future casualty rates under similar conditions. Taken together, these findings will be of use in health support planning for future City-2-Surf races, and for similar races elsewhere in the world.
Conflicts of interest
none