


Introduction
Psychotic disorders are a group of severe mental disorders characterized by the presence of multiple psychopathological dimensions such as positive, negative, disorganization and depressive symptoms as well as impairment in cognition and psychosocial functioning. The disorders constitute one of the leading causes of disability worldwide and incur huge societal costs (Global Burden of Disease Study, 2013; Collaborators, 2015; Jin and Mosweu, Reference Jin and Mosweu2017). Although specialized early intervention services have been shown to improve outcomes of first-episode psychosis (FEP) (Correll et al., Reference Correll, Galling, Pawar, Krivko, Bonetto, Ruggeri, Craig, Nordentoft, Srihari, Guloksuz, Hui, Chen, Valencia, Juarez, Robinson, Schooler, Brunette, Mueser, Rosenheck, Marcy, Addington, Estroff, Robinson, Penn, Severe and Kane2018), evidence has consistently demonstrated that a significant proportion of FEP patients exhibit persistent functional disability even in the presence of clinical remission (Chang et al., Reference Chang, Tang, Hui, Lam, Chan, Wong, Chiu and Chen2012, Reference Chang, Chu, Kwong, Wong, Hui, Chan, Lee and Chen2018a; Verma et al., Reference Verma, Subramaniam, Abdin, Poon and Chong2012). A recent meta-analytic review further revealed that only 38% of FEP patients have attained functional recovery over a mean follow-up of 7.2 years (Lally et al., Reference Lally, Ajnakina, Stubbs, Cullinane, Murphy, Gaughran and Murray2017), thereby indicating functional impairment as an unmet treatment need in the early stage of psychotic illness.
Recently, network analysis of psychopathology has been increasingly applied in psychiatric research (Borsboom, Reference Borsboom2017; Fried et al., Reference Fried, van Borkulo, Cramer, Boschloo, Schoevers and Borsboom2017). This novel psychometric approach conceptualizes mental disorders as complex dynamic systems of interacting and possibly self-reinforcing symptoms (Borsboom and Cramer, Reference Borsboom and Cramer2013; McNally, Reference McNally2016). This is in sharp contrast with the traditional disease model which assumes co-occurrence of psychiatric symptoms and other illness-related deficits emerge from an underlying latent common cause (Borsboom and Cramer, Reference Borsboom and Cramer2013). Network approach confers several methodological advantages on psychopathological investigation. First of all, this is an atheoretical, data-driven approach which requires no a priori model of cause-effect relationships among variables (Borsboom and Cramer, Reference Borsboom and Cramer2013). The inter-relationships among variables can be constructed, estimated and visualized in the form of network structure. Most importantly, the analysis provides information on the relative importance of different variables in the network (Borsboom and Cramer, Reference Borsboom and Cramer2013; McNally, Reference McNally2016). This facilitates identification of the most central symptoms in the network which are pivotal in influencing other symptoms and illness-related variables, and may thus represent as potential therapeutic targets for effective intervention. In fact, network analysis has been regarded as a promising approach in elucidating complex interplay among a broad range of clinical and cognitive variables associated with psychotic disorders (Isvoranu et al., Reference Isvoranu, Boyette, Guloksuz, Borsboom, Tamminga, Ivleva, Reininghaus and van Os2017a), in particular their differential relationships with functional outcome (Galderisi et al., Reference Galderisi, Rucci, Kirkpatrick, Mucci, Gibertoni, Rocca, Rossi, Bertolino, Strauss, Aguglia, Bellomo, Murri, Bucci, Carpiniello, Comparelli, Cuomo, De Berardis, Dell'Osso, Di Fabio, Gelao, Marchesi, Monteleone, Montemagni, Orsenigo, Pacitti, Roncone, Santonastaso, Siracusano, Vignapiano, Vita, Zeppegno and Maj2018).
Until now, there have been relatively few studies using network approach to examine psychopathology and other illness-related variables in psychotic disorders (Levine and Leucht, Reference Levine and Leucht2016; Isvoranu et al., Reference Isvoranu, van Borkulo, Boyette, Wigman, Vinkers and Borsboom2017b; van Rooijen et al., Reference van Rooijen, Isvoranu, Meijer, van Borkulo, Ruhe and de Haan2017, Reference van Rooijen, Isvoranu, Kruijt, van Borkulo, Meijer, Wigman, Ruhé and de Haan2018; Galderisi et al., Reference Galderisi, Rucci, Kirkpatrick, Mucci, Gibertoni, Rocca, Rossi, Bertolino, Strauss, Aguglia, Bellomo, Murri, Bucci, Carpiniello, Comparelli, Cuomo, De Berardis, Dell'Osso, Di Fabio, Gelao, Marchesi, Monteleone, Montemagni, Orsenigo, Pacitti, Roncone, Santonastaso, Siracusano, Vignapiano, Vita, Zeppegno and Maj2018; Hasson-Ohayon et al., Reference Hasson-Ohayon, Goldzweig, Lavi-Rotenberg, Luther and Lysaker2018; Klippel et al., Reference Klippel, Wiechtbauer, Reininghaus, Wigman, van Borkulo, Myin-Germeys and Wichers2018; Strauss et al., Reference Strauss, Esfahlani, Galderisi, Mucci, Rossi, Bucci, Rocca, Maj, Kirkpatrick, Ruiz and Sayama2018a). Several methodological issues pertinent to previous network analytic studies have also been noted. First, all of these past studies focused on patients with chronic illness. Network structure and the differential degrees of centrality among clinical, cognitive and functional variables manifested in the early stage of psychotic illness remain to be clarified. Second, prior reports were over-represented by male patients, with a proportion ranging between 65.3% and 100% of the entire study sample. Third, most studies limited their network analysis to psychopathology without taking into consideration cognitive deficits which are, nonetheless, a core feature of psychotic disorders. Thus far, only one past study has incorporated psychosocial functioning in network analysis (Galderisi et al., Reference Galderisi, Rucci, Kirkpatrick, Mucci, Gibertoni, Rocca, Rossi, Bertolino, Strauss, Aguglia, Bellomo, Murri, Bucci, Carpiniello, Comparelli, Cuomo, De Berardis, Dell'Osso, Di Fabio, Gelao, Marchesi, Monteleone, Montemagni, Orsenigo, Pacitti, Roncone, Santonastaso, Siracusano, Vignapiano, Vita, Zeppegno and Maj2018). Given that better understanding of the inter-relationships among symptoms, cognition and functioning in the initial stage of illness is crucial to early intervention for psychosis, applying network analysis in FEP samples will facilitate identification of treatment targets and development of effective interventions to promote early functional recovery.
To this end, we employed network approach to investigate the inter-relationships among a wide array of variables encompassing symptom dimensions, premorbid adjustment, duration of untreated psychosis (DUP), cognitive functions, subjective quality-of-life (QoL) and psychosocial functioning in a large, representative cohort of Chinese adult patients presenting with FEP to a specialized early intervention program. Specifically, the current study aimed to (1) construct a network structure and examine interactions among the aforementioned clinical, cognitive and functional variables; and (2) identify the most central variables within the generated network, especially in relation to their associations with psychosocial functioning. Owing to an increasing concern and debate about the limited reliability of network models on psychopathology (Borsboom et al., Reference Borsboom, Fried, Epskamp, Waldorp, van Borkulo, van der Maas and Cramer2017; Forbes et al., Reference Forbes, Wright, Markon and Krueger2017a, Reference Forbes, Wright, Markon and Krueger2017b; Steinly et al., Reference Steinly, Hoffman, Brusco and Sher2017), we performed a series of recommended statistical tests (Epskamp et al., Reference Epskamp, Borsboom and Fried2018a) to evaluate network stability and accuracy.
Methods
Participants
This study was conducted as part of the Jockey Club Early Psychosis (JCEP) project (Hui et al., Reference Hui, Chang, Chan, Lee, Tam, Lai, Wong, Tang, Li, Leung, McGhee, Sham and Chen2014), which was a territory-wide early intervention service aiming to provide phasic-specific case management to individuals aged 26–55 years presenting with first-episode DSM-IV (American Psychiatric Association, 1994) schizophrenia, schizophreniform disorder, schizoaffective disorder, brief psychotic disorder, delusional disorder, or psychotic disorder not otherwise specified (NOS) in Hong Kong. A total of 355 patients were recruited from publicly-funded generic adult psychiatric outpatient units between June 2009 and August 2011. Patients with intellectual disability, substance-induced psychosis or psychotic disorder due to general medical condition were excluded. Data of this study were derived from baseline assessments [conducted with a mean of 119.7 days (median: 88 days) after treatment initiation] of a JCEP 4-year follow-up study, and findings regarding rate and risk factors of depressive symptoms, correlates of duration of untreated psychosis (DUP) and primary negative symptoms have been reported elsewhere (Chang et al., Reference Chang, Cheung, Hui, Lin, Chan, Lee and Chen2015, Reference Chang, Lau, Chan, Hui, Chan, Lee, Lin and Chen2016a; Hui et al., Reference Hui, Lau, Leung, Chang, Tang, Wong, Chan, Lee and Chen2015). The study was approved by local institutional review boards and all of the subjects gave written informed consent before participation. Among 355 FEP patients recruited, 323 had complete data on 16 study variables used for network analyses and thus constituted as the study sample for the current investigation. Comparison between patients with complete data and those without (n = 32) revealed no significant differences in age at entry, gender, educational level and diagnostic categories.
Assessments
Diagnosis of each subject was ascertained by research psychiatrists using all available information including Chinese-bilingual Structured Clinical Interview for DSM-IV (CB-SCID-I/P; So et al., Reference So, Kam, Leung, D, Liu and Fong2003) administered at intake, informant histories and medical records. Premorbid functioning on social (sociability, peer relationships and social-sexual aspects of life) and academic (scholastic performance and adaptation to school) domains across childhood, early and late adolescence stages was measured with the Premorbid Adjustment Scale (PAS; Cannon-Spoor et al., Reference Cannon-Spoor, Potkin and Wyatt1992). An overall premorbid adjustment score was computed by averaging the ratings for the relevant subscales across developmental stages (score range 0–1, higher score indicates lower functioning). Interview for Retrospective Assessment of the Onset of Schizophrenia (IRAOS; Hafner et al., Reference Häfner, Riecher-Rössler, Hambrecht, Maurer, Meissner, Schmidtke, Fätkenheuer, Löffler and van der Heiden1992) was employed to confirm the first-episode status and to determine DUP which was defined as the time interval between the onset of psychotic symptoms and initiation of antipsychotic treatment. Psychopathology was assessed using the Positive and Negative Syndrome Scale (PANSS; Kay et al., Reference Kay, Fiszbein and Opler1987). Separate symptom dimension scores (positive symptoms, disorganization and excitement) were derived by summing the ratings of respective PANSS items (please refer to footnotes in Table 1) based on previous factor-analysis conducted in first-episode psychosis (Emsley et al., Reference Emsley, Rabinowitz and Torreman2003). Negative symptoms were examined by the Scale for the Assessment of Negative Symptoms (SANS; Andreasen, Reference Andreasen1984). As the negative symptom construct is consistently shown to comprise two distinct factors of amotivation and diminished expression (DE) (Messinger et al., Reference Messinger, Tremeau and Antonius2011; Liemburg et al., Reference Liemburg, Castelein, Stewart, van der Gaag, Aleman and Knegtering2013), we thus derived amotivation and DE scores based on the method applied by previous research (Foussias et al., Reference Foussias, Mann, Zakzanis, van Reekum and Remington2009; Chang et al., Reference Chang, Hui, Chan, Lee and Chen2016b). Amotivation score was the sum of SANS items in avolition-apathy and anhedonia-asociality subscales (excluding global items), while DE score was the sum of SANS items in Affective flattening subscale (excluding global item) and poverty of speech item in Alogia subscale. Calgary Depression Scale for Schizophrenia (CDSS; Addington et al., Reference Addington, Addington, Maticka-Tyndale and Joyce1992) was employed to assess depressive symptom severity (indexed by CDSS total score). Global psychosocial functioning was measured by the total score of Role Functioning Scale (RFS; Goodman et al., Reference Goodman, Sewell, Cooley and Leavitt1993). Short form-12 Health Survey (SF-12; Ware et al., Reference Ware, Kosinski and Keller1996) was used to evaluate subjective QoL (indexed by SF12 total score). A brief battery of cognitive assessments including digit span and digit symbol subtests of Wechsler Adult Intelligence Scale Revised (WAIS-R; Hong Kong Psychological Society, 1989a), logical memory and visual reproduction subtests of Wechsler Memory Scale Revised (WMS-R; Hong Kong Psychological Society, 1989b), category verbal fluency and Modified Wisconsin Card Sorting Test (MWCST; Nelson, Reference Nelson1976) was administered.
Demographic, clinical, functional and cognitive characteristics of patients

CDSS, Calgary Depression Scale for Schizophrenia; MWCST, Modified Wisconsin Card Sorting Test; PANSS, Positive and Negative Syndrome Scale; PAS, Premorbid Adjustment Scale; SANS, Scale for Assessment of Negative Symptoms; SF12, Short-Form 12 Health Survey; RFS, Role Functioning Scale.
a Data on gender, psychiatric diagnosis and use of second-generation antipsychotic are presented in N (%). All other data are presented in mean and standard deviations.
b Median DUP was 93 days. Interquartile range (i.e. 25–75 percentile) was 20 to 366 days.
c Schizophrenia-spectrum disorder included schizophrenia, schizoaffective disorder and schizophreniform disorder. Other non-affective psychoses included brief psychotic disorder, delusional disorder and psychotic disorder not otherwise specified (NOS).
d PANSS positive symptom dimension score was the sum of PANSS items P1, P3, P5, P6, G9 and G12; PANSS disorganization dimension score was the sum of PANSS items P2, N5, N7, G5, G10, G11 and G15; PANSS excitement dimension score was the sum of PANSS items P4, P7, G8 and G14 (Emsley et al., Reference Emsley, Rabinowitz and Torreman2003).
Statistical analysis
Network construction and analyses
Sixteen variables encompassing premorbid and onset characteristics, psychopathology, cognition, psychosocial functioning and subjective QoL were selected for network analyses. In a network, each variable was represented as a node and associations between nodes were represented as edges. Zero-order correlations were conducted to provide general representation of the pairwise associations among variables (online Supplementary Table S1). A non-paranormal transformation was performed prior to network estimation as the data were not normally distributed (Liu et al., Reference Liu, Lafferty and Wasserman2009). We then constructed a partial correlation network, in which the relationship between two nodes was estimated after controlling for the influence of all the other variables in the network (i.e. conditional independence associations), using the graphical Least Absolute Shrinkage and Selection Operator (LASSO) (Friedman et al., Reference Friedman, Hastie and Tibshirani2008) in combination with extended Bayesian information criterion (EBIC) model selection (Chen and Chen, Reference Chen and Chen2008). Graphical LASSO is an L1-regularization technique which limits the number of spurious (false-positive) edges by assigning penalties to shrink small correlations to exactly zero, and thereby generating a more interpretable and sparse network (Friedman et al., Reference Friedman, Hastie and Tibshirani2008; Epskamp and Fried, Reference Epskamp and Fried2018). EBIC is a goodness-of-fit measure for model selection and uses hyperparameter γ to control its degree of preference for more parsimonious models with fewer edges (Chen and Chen, Reference Chen and Chen2008). Following the recommendation by Foygel and Drton (Reference Foygel and Drton2010), we set hyperparameter γ = 0.5 which was shown to yield accurate network estimations with a good balance between sensitivity and specificity of identifying true edges. The network layout was derived from the Fruchterman–Reingold algorithm (Fruchterman and Reingold, Reference Fruchterman and Reingold1991), which places nodes with stronger and more numerous associations more centrally within the network and weakly connected nodes on the periphery.
To assess and quantify the importance of individual nodes in a generated network, we computed three centrality indices of strength, closeness and betweenness for each node (Barrat et al., Reference Barrat, Barthelemy, Pastor-Satorras and Vespignani2004; Boccaletti et al., Reference Boccaletti, Latora, Moreno, Chavez and Hwang2006; Opsahl et al., Reference Opsahl, Agneessens and Skvoretz2010). Node strength is calculated as the sum of edge weights connected to a node, quantifying how well a node is directly connected to other nodes. Closeness is the inverse of the sum of the shortest paths from a node to all other nodes, measuring how well a node is indirectly connected to other nodes. Betweenness measures the number of times a node lies on the shortest paths between two other nodes, quantifying how important a node is in connecting other nodes. Network construction and visualization, and centrality analyses were implemented in R-package (version 3.5.2; R Core Team, 2018) qgraph (version 1.6.1; Epskamp et al., Reference Epskamp, Cramer, Waldorp, Schmittmann and Borsboom2012).
In addition, we conducted exploratory analysis comparing networks of male and female FEP patients with respect to overall network structure (i.e. distribution of edge weights) and global strength (i.e. weighted sum of the absolute connections). We performed Network Comparison Test (NCT; van Borkulo et al., Reference van Borkulo, Boschloo, Kossakowski, Tio, Schoevers, Borsboom and Waldorp2017), a permutation test which assesses differences between two networks by randomly regrouping subjects from each network repeatedly (1000 iterations). The NCT was implemented in R-package NetworkComparisonTest (version 2.0.1; van Borkulo, Reference van Borkulo2016).
Estimation of network accuracy and stability
We examined network accuracy and stability as recommended by Epskamp et al. (Reference Epskamp, Borsboom and Fried2018a), using R-package bootnet (version 1.2). First, we estimated accuracy of edge-weights by calculating their 95% confidence intervals (CIs) derived from 1000 non-parametric bootstrap samples. Second, we evaluated stability of centrality indices using case-dropping subset bootstrap procedure, in which centrality indices are repeatedly calculated from subsets of data with an increasing proportion of subjects dropped. Stability was quantified by calculating the correlation stability (CS) coefficient which is the maximum proportion of cases that can be removed from the sample to retain, with 95% certainty, a correlation of at least 0.7 between the original centrality indices (full sample) and those derived from subsamples. It is recommended that CS coefficient >0.25 is regarded as a minimum threshold for index stability, while indices with CS coefficient >0.5 are considered as sufficiently stable (Epskamp et al., Reference Epskamp, Borsboom and Fried2018a). Third, we performed bootstrapped difference tests for edge-weights and node strength, using 1000 bootstrap samples and α = 0.05, to assess whether two edge-weights or two node strengths differ significantly from one another.
Results
Characteristics of the sample
Of the 323 subjects, 43.3% were male. The mean age of the sample was 38.0 years (s.d. = 8.4) and the median DUP was 93 days (interquartile range: 20–366 days). The majority (63.5%) were diagnosed with schizophrenia-spectrum disorder (schizophrenia: n = 144; schizophreniform disorder: n = 58; schizoaffective disorder: n = 3). For other non-affective psychoses, 12.4% (n = 40) of the cohort had brief psychotic disorder, 18.6% (n = 60) had delusional disorder and 5.6% (n = 18) had psychotic disorder NOS. Data on demographics, baseline clinical characteristics, functioning and cognitive performance of the sample are summarized in Table 1.
Network structure and analyses
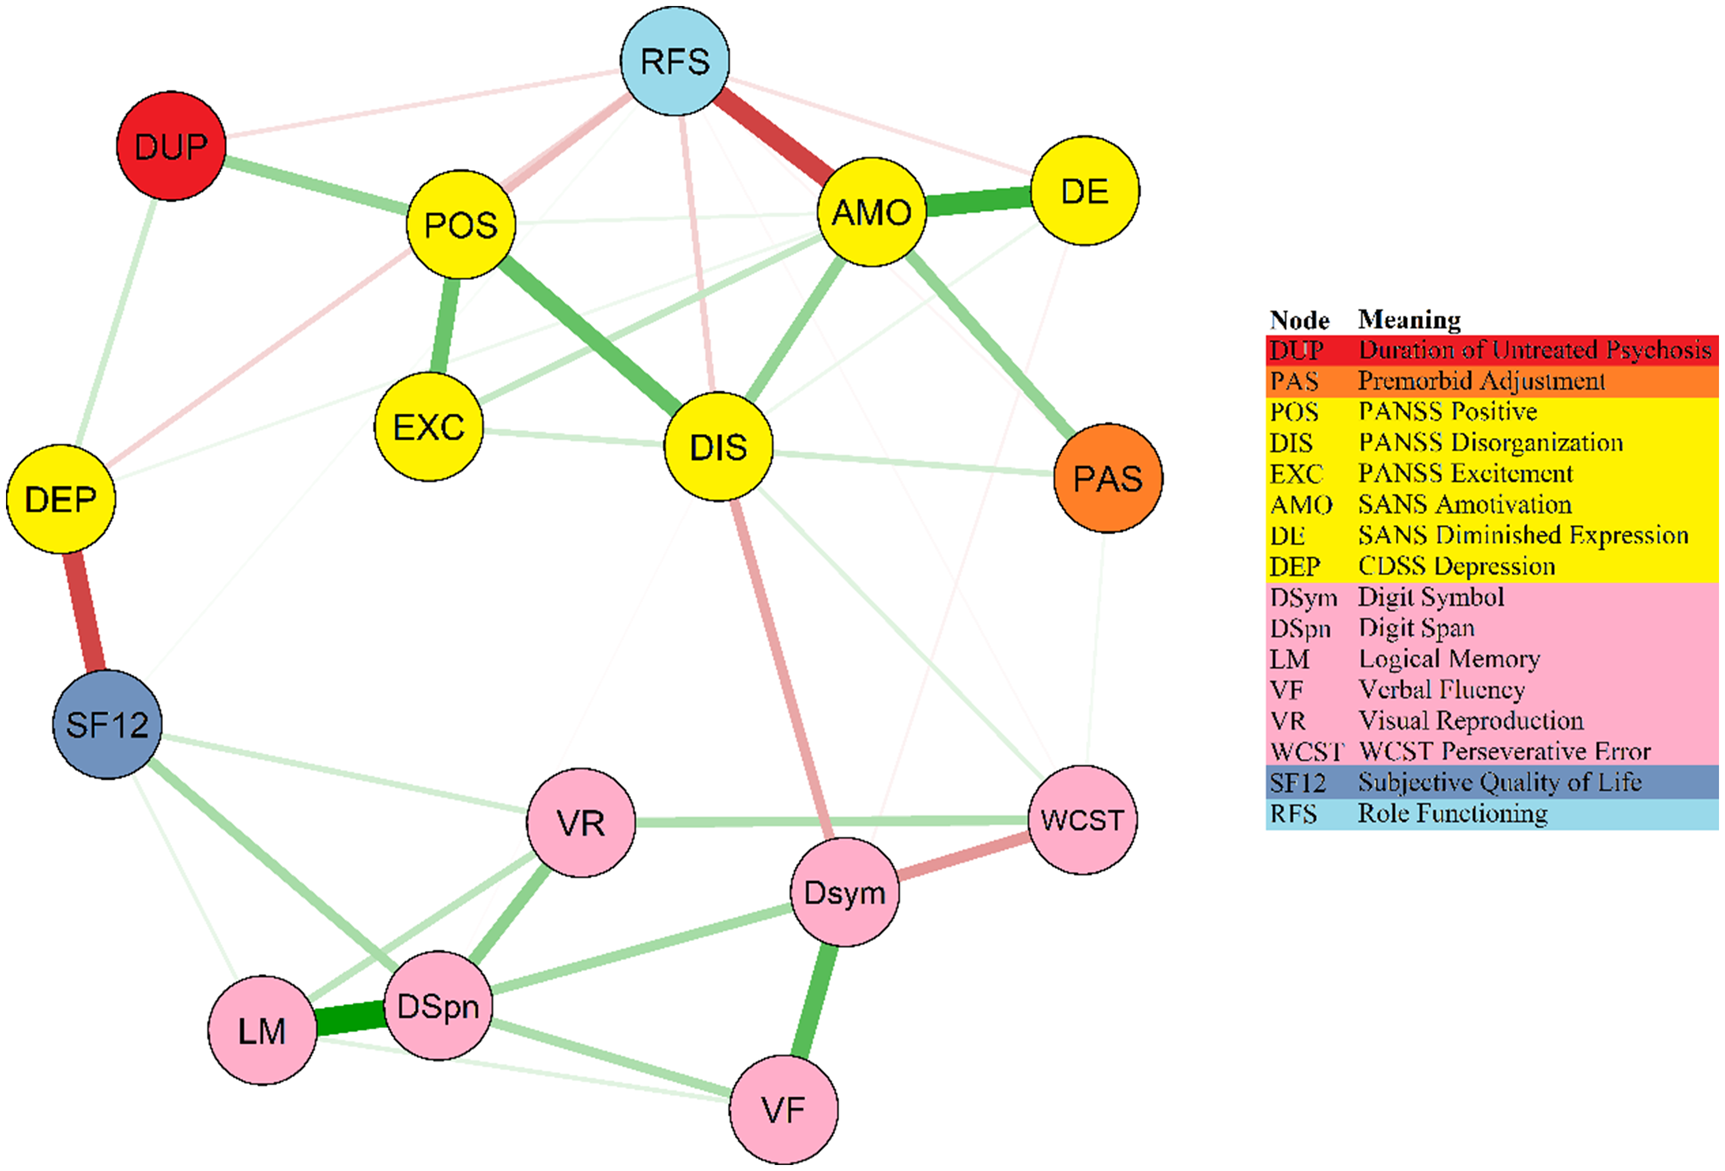
The generated network showed that nodes within the domain of cognitive functions were generally highly interconnected and clustered more closely together than those belonged to other domains (Fig. 1). Within the psychopathology domain, strong links were found between amotivation and DE, positive symptoms and disorganization, as well as positive symptoms and excitement. Moreover, we observed that several psychopathological variables had important connections to non-psychopathological nodes: amotivation was strongly (and inversely) correlated to psychosocial functioning, and also linked to premorbid adjustment; positive symptoms were connected with DUP; depression was negatively associated with subjective QoL; and disorganization was connected with cognitive variables of digit symbol and WCST perseverative errors. Alternatively, apart from a strong association with amotivation, psychosocial functioning was moderately linked to positive symptoms and was only weakly connected to other psychopathological variables and several nodes of other domains.
Network of premorbid, clinical, functional and cognitive variables in patients. Note: This is a network structure of 16 study variables. Each node represents a study variable and each edge represents a significant association between two nodes. Edge thickness reflects the magnitude of an association (thicker lines indicate stronger associations). Green lines denote positive associations, while red lines denote negative associations.
Regarding centrality analyses (Fig. 2), amotivation showed the highest node strength and relatively high closeness and betweenness indices. Amotivation was connected to all of the other psychopathological variables as well as nodes of psychosocial functioning and premorbid adjustment. In the cognitive domain, digit span demonstrated the highest centrality and was connected to most of the other cognitive variables. Disorganization and digit symbol showed the highest closeness and betweenness among all variables in the network, mainly bridging other cognitive variables to psychopathology domain and psychosocial functioning. Exploratory analysis comparing networks between genders by NCT revealed no significant group differences in both global strength (strength difference: S = 2.12, p = 0.11) and structural invariance (maximum difference in edge-weights: M = 0.22, p = 0.42).
Centrality indices of study variables within the network. Note: Centrality indices of node strength, closeness and betweenness are shown as standardized z-scores.

Network stability and accuracy
As shown in online Supplementary Fig. S1, bootstrapped 95% CIs were quite narrow, indicating that edge-weight estimates were reliable and accurate. Regarding stability of centrality indices (online Supplementary Fig. S2), node strength had CS coefficient of 0.51 and was thus considered as sufficiently stable. However, the relatively low CS coefficients for closeness (0.28) and betweenness (0.28) (albeit still above a recommended minimum threshold for index stability, i.e. 0.25) suggested that both indices may have inadequate stability and should be interpreted with caution. Inspection of bootstrapped difference test results (online Supplementary Figs S3 and S4) revealed that a large proportion of the comparisons among edge-weights and node strengths were statistically significant (i.e. reliably different from one another) in the generated network.
Discussion
In the current analysis, we employed network approach to examine complex inter-relationships among a broad range of variables including symptom dimensions, premorbid adjustment, cognitive functions, subjective QoL and psychosocial functioning in patients presenting with FEP. To the best of our knowledge, this is the first report to investigate psychopathology and other illness-related measures in FEP populations using network analysis. Generally, our results confirm, as anticipated, that cognition represents an independent construct, with highly interconnected nodes within the domain. Comparatively, psychopathological variables were spatially more diverse and had more connections with nodes that belonged to other domains. This is in fact consistent with the heterogeneous nature of psychopathology associated with psychotic disorders, and underscores the importance of incorporating symptom-dimensional approach instead of solely focusing on categorical-diagnostic perspective in psychosis research (Russo et al., Reference Russo, Levine, Demjaha, Di Forti, Bonaccorso, Fearon, Dazzan, Pariante, David, Morgan, Murray and Reichenberg2014).
Our network analysis revealed several important findings in relation to negative symptoms, in particular amotivation. First, amotivation was found to play the most central role and had the strongest associations with other nodes (as indexed by node strength) in the constructed network. In addition, we observed differential patterns of connections of amotivation and DE with other variables, lending support to the validity of the two-factor structure of negative symptoms (Messinger et al., Reference Messinger, Tremeau and Antonius2011; Liemburg et al., Reference Liemburg, Castelein, Stewart, van der Gaag, Aleman and Knegtering2013). For instance, in line with the literature (Strauss et al., Reference Strauss, Horan, Kirkpatrick, Fischer, Keller, Miski, Buchanan, Green and Carpenter2013; Chang et al., Reference Chang, Kwong, Chan, Jim, Lau, Hui, Chan, Lee and Chen2017), our results showed that premorbid adjustment was linked to amotivation but not DE. Critically, we found that psychosocial functioning was most strongly connected to amotivation in the network, and was only weakly related to DE. In fact, a growing body of research has consistently indicated the critical role of negative symptoms, especially amotivation, in the early course of psychotic illness. Negative symptoms are frequently observed in FEP and the severity of early-stage negative symptoms is found to robustly predict long-term clinical and functional outcomes (Ventura et al., Reference Ventura, Subotnik, Giltlin, Gretchen-Doorly, Ered, Villa, Hellemann and Nuechterlein2015; Chang et al., Reference Chang, Ho, Tang, Wong, Hui, Chan, Lee, Suen and Chen2018b). Recent studies demonstrated that, among the two factors of negative symptoms, amotivation is more prevalent and persistent over time (Fervaha et al., Reference Fervaha, Foussias, Agid and Remington2015; Lutgens et al., Reference Lutgens, Joober, Iyer, Lepage, Norman, Schmitz, Mustafa, Abadi and Malla2019), and a much stronger predictor of psychosocial functioning than DE in FEP patients (Fervaha et al., Reference Fervaha, Foussias, Agid and Remington2015; Chang et al., Reference Chang, Hui, Chan, Lee and Chen2016b, Reference Chang, Kwong, Or, Lau, Chan, Jim, Hui, Chan, Lee and Chen2018c). Accumulating data has further shown that amotivation independently predicts functional outcome above and beyond other symptom dimensions and cognitive impairment in FEP (Fervaha et al., Reference Fervaha, Foussias, Agid and Remington2015; Chang et al., Reference Chang, Hui, Chan, Lee and Chen2016b) and chronic schizophrenia (Foussias et al., Reference Foussias, Mann, Zakzanis, van Reekum and Remington2009; Konstantakopoulos et al., Reference Konstantakopoulos, Ploumpidis, Oulis, Patrikelis, Soumani, Papadimitriou and Politis2011). The fact that there is convergence of evidence, based on different methodological strategies, indicating the significant relationship between amotivation and psychosocial functioning in FEP highlights network analysis as an informative (and complementary) approach in disentangling complex interplay among psychopathological and other illness-related variables in psychotic disorders. It should, however, be acknowledged that our interpretation of node centrality was primarily based on strength index estimation. Our network stability analyses revealed that node strength was sufficiently stable, while closeness and betweenness had relatively low stability and hence results regarding these two indices should be treated with caution. Nonetheless, our findings are consistent with a recent psychometric study examining network accuracy and reliability which also found that node strength exhibited much greater stability than the other two centrality indices (Epskamp et al., Reference Epskamp, Borsboom and Fried2018a). It is also suggested that strength may be theoretically more relevant and clinically more useful relative to two other indices for psychopathology network (McNally, Reference McNally2016) as it reflects the probability that activation of a specific symptom will be followed by activation of its neighboring symptoms, and symptom with high strength may be identified as potentially useful treatment target for overall outcome improvement. Alternatively, owing to the paucity of existing data, further studies are warranted to verify our findings on the significance of amotivation in the psychopathological networks of first-episode populations.
Our results that depression was directly linked to subjective QoL and positive symptoms were strongly connected with DUP accord well with the literature in FEP (Renwick et al., Reference Renwick, Jackson, Foley, Owens, Ramperti, Behan, Anwar, Kinsella, Turner, Clarke and O'Callaghan2012; Penttilä et al., Reference Penttilä, Jääskeläinen, Hirvonen, Isohanni and Miettunen2014; Kwong et al., Reference Kwong, Chang, Chan, Jim, Lau, Hui, Chan, Lee and Chen2017). Our finding of a negative association between positive symptoms and real-world functioning is, however, at odds with a recent network study which revealed a lack of direct connection between these two variables in schizophrenia (Galderisi et al., Reference Galderisi, Rucci, Kirkpatrick, Mucci, Gibertoni, Rocca, Rossi, Bertolino, Strauss, Aguglia, Bellomo, Murri, Bucci, Carpiniello, Comparelli, Cuomo, De Berardis, Dell'Osso, Di Fabio, Gelao, Marchesi, Monteleone, Montemagni, Orsenigo, Pacitti, Roncone, Santonastaso, Siracusano, Vignapiano, Vita, Zeppegno and Maj2018). Yet, as the study examined chronic patients who were clinically-stable with treatment (Galderisi et al., Reference Galderisi, Rucci, Kirkpatrick, Mucci, Gibertoni, Rocca, Rossi, Bertolino, Strauss, Aguglia, Bellomo, Murri, Bucci, Carpiniello, Comparelli, Cuomo, De Berardis, Dell'Osso, Di Fabio, Gelao, Marchesi, Monteleone, Montemagni, Orsenigo, Pacitti, Roncone, Santonastaso, Siracusano, Vignapiano, Vita, Zeppegno and Maj2018), the effect of positive symptoms on functioning might be significantly less pronounced than that observed in FEP patients shortly after their initial presentation. Alternatively, our network analysis showed that digit span and digit symbol played the most central roles in the cognitive domain. In particular, digit span was directly connected with most of the cognitive variables. Digit span and digit symbol are regarded as a measure of working memory and processing speed, respectively. It is well recognized that these two cognitive processes serve as fundamental cognitive functions influencing the execution of many higher-order cognitive operations and represent core cognitive deficits in psychotic disorders (Dickinson et al., Reference Dickinson, Ramsey and Gold2007; Forbes et al., Reference Forbes, Carrick, McIntosh and Lawrie2009). In fact, our results concur with the only two previous studies (Galderisi et al., Reference Galderisi, Rucci, Kirkpatrick, Mucci, Gibertoni, Rocca, Rossi, Bertolino, Strauss, Aguglia, Bellomo, Murri, Bucci, Carpiniello, Comparelli, Cuomo, De Berardis, Dell'Osso, Di Fabio, Gelao, Marchesi, Monteleone, Montemagni, Orsenigo, Pacitti, Roncone, Santonastaso, Siracusano, Vignapiano, Vita, Zeppegno and Maj2018; Hasson-Ohayon et al., Reference Hasson-Ohayon, Goldzweig, Lavi-Rotenberg, Luther and Lysaker2018) which also incorporated cognitive measures in network analysis for schizophrenia and found that working memory and processing speed are highly central variables (as indexed by node strength) within the community of cognitive functions.
Contrary to the literature which generally indicates a significant relationship between cognitive impairment and functional outcome in schizophrenia, most of the individual cognitive variables were not directly connected to psychosocial functioning in our generated network. Further inspection of the network structure suggested a bridging role of disorganization which linked cognition to other psychopathological variables and psychosocial functioning. This is consistent with a recent network study demonstrating that PANSS cognitive dimension (akin to PANSS disorganization in the current study) bridged cognitive functions with other symptom dimensions in chronic schizophrenia (Hasson-Ohayon et al., Reference Hasson-Ohayon, Goldzweig, Lavi-Rotenberg, Luther and Lysaker2018). Our results are also partially in keeping with Galderisi et al. (Reference Galderisi, Rucci, Kirkpatrick, Mucci, Gibertoni, Rocca, Rossi, Bertolino, Strauss, Aguglia, Bellomo, Murri, Bucci, Carpiniello, Comparelli, Cuomo, De Berardis, Dell'Osso, Di Fabio, Gelao, Marchesi, Monteleone, Montemagni, Orsenigo, Pacitti, Roncone, Santonastaso, Siracusano, Vignapiano, Vita, Zeppegno and Maj2018) which showed no direct connections between cognitive measures and functional variables in patients with chronic schizophrenia. In that study, cognition and psychosocial functioning nodes (especially everyday life skills) were bridged by functional capacity, which was also indirectly connected to work functioning and everyday life skills via disorganization (Galderisi et al., Reference Galderisi, Rucci, Kirkpatrick, Mucci, Gibertoni, Rocca, Rossi, Bertolino, Strauss, Aguglia, Bellomo, Murri, Bucci, Carpiniello, Comparelli, Cuomo, De Berardis, Dell'Osso, Di Fabio, Gelao, Marchesi, Monteleone, Montemagni, Orsenigo, Pacitti, Roncone, Santonastaso, Siracusano, Vignapiano, Vita, Zeppegno and Maj2018). Conversely, in line with some (Alptekin et al., Reference Alptekin, Akvardar, Akdede, Dumlu, Isik, Pirincci, Yahssin and Kitis2005; Ritsner, Reference Ritsner2007; Woon et al., Reference Woon, Chia, Chan and Sim2010), but not all previous studies (Tolman and Kurtz, Reference Tolman and Kurtz2012), our results revealed positive associations between subjective QoL and a number of cognitive variables, especially working memory (digit span). We also failed to find any significant differences between male and female FEP patients with respect to network structure and global strength in our exploratory analysis. Although gender differences have been frequently reported in the literature on FEP (Cotton et al., Reference Cotton, Lambert, Schimmelmann, Foley, Morley, McGorry and Conus2009; Chang et al., Reference Chang, Tang, Hui, Chiu, Lam, Wong, Chung, Law, Tso, Chan, Hung and Chen2011; Thorup et al., Reference Thorup, Albert, Bertelsen, Petersen, Jeppesen, Le Quack, Krarup, Jørgensen and Nordentoft2014), evidence appears to be less consistent regarding psychopathology at initial presentation than at follow-up outcomes (Ochoa et al., Reference Ochoa, Usall, Cobo, Labad and Kulkarni2012). Additionally, potential gender differences in terms of inter-relationships among clinical, cognitive and functional variables in psychotic disorders have rarely been investigated. However, it should be noted that our preliminary findings of lack of gender differences in network comparison analyses might be attributable to limited statistical power owing to our relatively small sample size for each gender. Further research with a larger sample size is thus needed to clarify gender differences in psychopathological networks of FEP patients.
Several study limitations need to be acknowledged. First, the cross-sectional nature of the current study precludes us from establishing causality among variables in the network. Second, we did not measure functional capacity and social cognition, which are found to be impaired in patients with psychotic disorders and are related to both cognitive deficits and psychosocial functioning (Bowie et al., Reference Bowie, Reichenberg, Patterson, Heaton and Harvey2006; Savla et al., Reference Savla, Vella, Armstrong, Penn and Twamley2013). Third, the potential treatment effect including pharmacological or other psychosocial interventions on the psychopathology network of FEP sample could not be estimated due to our cross-sectional analysis. Fourth, although SANS has been the most widely used scale specifically assessing negative symptoms, it may not well align with the modern conceptualizations for negative symptoms recognized by the NIMH-initiated Consensus Development Conference on Negative Symptoms in 2005 (Kirkpatrick et al., Reference Kirkpatrick, Fenton, Carpenter and Marder2006). It is also noteworthy that recent data (Strauss et al., Reference Strauss, Nunez, Ahmed, Barchard, Granholm, Kirkpatrick, Gold and Allen2018b) has suggested that the latent structure of negative symptoms might be better captured by five- rather than a two-factor model. Application of next-generation negative symptom scales (Strauss and Gold, Reference Strauss and Gold2016) developed according to the recommendations of consensus conference should be considered in future network-analysis research for a more comprehensive evaluation of negative symptoms in FEP. Fifth, our sample size was modest. Further studies with larger sample size are required to confirm our findings. Sixth, the study examined adult FEP patients within the context of a territory-wide early psychosis service for individuals aged 26–55 years (Hui et al., Reference Hui, Chang, Chan, Lee, Tam, Lai, Wong, Tang, Li, Leung, McGhee, Sham and Chen2014), therefore our results may not generalize to other first-episode cohorts with younger age of illness onset.
In conclusion, the current study is the first to examine inter-relationships among psychopathology, premorbid adjustment, cognition and psychosocial functioning in FEP using network analysis approach. Our results reveal the central role of amotivation in psychopathology network and indicate its significant association with psychosocial functioning in first-episode populations. Replication of our findings in other FEP samples using network analysis is necessary to affirm diminished motivation as a potentially important therapeutic target for promoting functional enhancement in the early course of psychotic illness. More research is also required to clarify the neurobiological underpinnings of amotivation in early psychosis, for instance impaired reward processing (Strauss et al., Reference Strauss, Waltz and Gold2014; Chang et al., Reference Chang, Waltz, Gold, Chan and Chen2016c) and suboptimal effort-based decision-making (Gold et al., Reference Gold, Waltz and Frank2015; Chang et al., Reference Chang, Chu, Treadway, Strauss, Chan, Lee, Hui, Suen and Chen2019), so as to facilitate development of effective treatments to ameliorate motivational deficits. Additionally, future research using time-series data to construct personal-level psychopathology networks (Epskamp et al., Reference Epskamp, van Borkulo, van der Veen, Servaas, Isvoranu, Riese and Cramer2018b) in FEP patients will help elucidate temporal dynamics between clinical, cognitive and functional variables on an individual basis, and hence facilitate provision of personalized treatment to improve illness prognosis.
Supplementary material
The supplementary material for this article can be found at https://doi.org/10.1017/S0033291719002113.
Acknowledgement
This study was supported by the Hong Kong Jockey Club Charities Trust (21009144). The funding body had no involvement in any aspect of the study or manuscript preparation. We thank all the coordinating clinicians and staff from the participating hospitals, clinics and medical records departments for their kind assistance. We are also grateful to the individuals who participated in the study.
Conflict of interest
E.Y.H.C. has participated in the paid advisory board for Otsuka, has received educational grant support from Janssen-Cilag, and has received research funding from Astra-Zeneca, Janssen-Cilag, Eli Lilly, Sanofi-Aventis and Otsuka. E.H.M.L has been a member of the paid advisory boards for Eli Lilly and AstraZeneca. The authors report no conflicts of interest. The authors alone are responsible for the content and writing of the paper.



