





Introduction
Infertility can be defined as the failure to become pregnant following frequent coitus without protection for a period of one year and is a common severe clinical issue affecting approximately 15% of couples worldwide (Legese et al., Reference Legese, Tura, Roba and Demeke2023). Male reproductive dysfunction is a prevalent health issue, responsible for 30–50% of infertility cases worldwide and can be caused by several reasons like testicular dysfunction, endocrine imbalance, lifestyle issues that include smoking, physical inactivity, obesity, congenital anatomical abnormalities, gonadotoxic exposure and ageing (Sang et al., Reference Sang, Ray and Wang2023; Bhattacharya et al., Reference Bhattacharya, Sharma and Majumdar2024). Semen analysis, a standard diagnostic test that examines sperm number, concentration, motility and morphology, is a fundamental instrument in the evaluation of male infertility. However, seminal fluid analysis might not be an absolute reflection of the functional capability and potential for fertilization of the spermatozoa, and tests of sperm function in addition to advanced molecular techniques need to be utilized (Eisenberg et al., Reference Eisenberg, Esteves, Lamb, Hotaling, Giwercman, Hwang and Cheng2023).
CoQ10 or ubiquinone-10 is a membrane-permeable lipophilic antioxidant that plays a central role in the mitochondrial respiratory chain and is crucial for cellular energy metabolism. CoQ10 participates in ATP synthesis in cellular energy metabolism and protects cells from oxidative damage by neutralizing free radicals (Bentinger et al., Reference Bentinger, Tekle and Dallner2010). Oxidative stress occurs when the production of reactive oxygen species (ROS) exceeds the capacity of the antioxidant defence system, leading to mitochondrial dysfunction, reduced ATP production and impaired sperm function. CoQ10 prevents cellular damage by free radicals, increasing mitochondrial efficiency and maintaining sperm cell health (Lucignani et al., Reference Lucignani, Jannello, Fulgheri, Silvani, Turetti, Gadda, Viganò, Somigliana, Montanari and Boeri2022). New studies indicate that supplementation with CoQ10 may improve sperm motility, protect sperm DNA integrity by reducing oxidative stress and subsequently boost sperm count, motility and morphology (Lucignani et al., Reference Lucignani, Jannello, Fulgheri, Silvani, Turetti, Gadda, Viganò, Somigliana, Montanari and Boeri2022; Mancuso et al., Reference Mancuso, Arato, Bellucci, Lilli, Eugeni, Aglietti, Stabile, Pistilli, Brancorsini, Gaggia, Calvitti, Baroni and Luca2023). Increased ROS levels are reported to be associated with decreased sperm motility, viability and increased DNA damage (Hussain et al., Reference Hussain, Kandeel, Metwally, Murtaza, Kalhoro, Yin, Tan, Chughtai, Yaseen, Afzal and Kalhoro2023). The antioxidant properties of CoQ10 help mitigate these adverse effects, supporting sperm quality and function (Cutini et al., Reference Cutini, Bruno, Mancini and Balercia2020; Vaamonde et al., Reference Vaamonde, Hackney, Algar-Santacruz, Garcia-Moreno, García-Manso and López-Lluch2020).
CoQ10 is produced endogenously and can also be obtained from both animal- and plant-based foods (Florou et al., Reference Florou, Anagnostis, Theocharis, Chourdakis and Goulis2020). The bioavailability of dietary CoQ10 can vary significantly depending on the type of food consumed, the cooking method and the individual’s digestive health. For example, red meat, spinach, strawberries, broccoli, cauliflower and eggs contain CoQ10, but the absorption and utilization of CoQ10 from these foods can differ among individuals (Balercia et al., Reference Balercia, Mosca, Mantero, Boscaro, Mancini, Ricciardo-Lamonica and Littarru2004). Since CoQ10 is a fat-soluble compound, its bioavailability increases when consumed with fat-containing meals. Therefore, maintaining adequate levels in the body can be achieved through dietary supplements (Bhagavan and Chopra, Reference Bhagavan and Chopra2006).
The aim of our research is to determine the potential benefits of consuming CoQ10-rich foods or CoQ10 supplements in individuals with low sperm motility. This study aims to provide comprehensive information on how CoQ10 supports sperm motility, morphology, ROS and cytotoxicity improves overall reproductive health by evaluating the bioaccessibility of CoQ10 obtained from various dietary sources.
Materials and methods
Sample collection
This study involved 75 participants who were admitted to the Infertility Clinic at Atakent Hospital, Acibadem Mehmet Ali Aydinlar University (Istanbul, Turkey). The study was approved by the Acibadem University Ethics Committee in accordance with the Declaration of Helsinki (Approval No. ATADEK-2021-01/26). Written informed consent was obtained from all participants prior to their inclusion in the study.
Sperm preparation
The study included 75 male patients diagnosed with idiopathic infertility, and their sperm samples were evaluated as per the World Health Organization (WHO) (Verwei, Reference Verwei2004) recommendations for the effect of CoQ10 on sperm motility. The samples were collected through masturbation after 3–5 days of sexual abstinence. Ejaculates were incubated at 37°C for 30 min to liquefy and then 10 µl aliquot of semen were used to examine baseline sperm parameters such as concentration and motility. All samples were prepared by the swim-up technique and then centrifuged (SL 8; Thermo Fisher Scientific Small Benchtop Centrifuge, USA, Waltham, MA) for 10 min at 500 g. The spermatozoa were incubated for 20–30 min in medium at 37°C with 5% CO2 then motility was evaluated. 0.5 mL of sperm sample were analysed for concentration and the motility was categorized into three categories: progressively motile, non-progressively motile and immotile. The sperm processing protocols included the utilization of special media for both the sperm-washing and swim-up procedures. To determine the efficacy of CoQ10, its different concentrations were supplemented in the HEPES-containing Modified HTF (Human Tubal Fluid) media as follows: CoQ10 (SAC9538; Sigma-Aldrich) concentrations: 10, 50 and 100 µM. Semen in the control group was incubated with HEPES-containing Modified HTF media.
Sperm morphology
Sperm morphology was assessed on air-dried semen smears stained using the Diff-Quick kit (Panótico Rápido® kit; Laborclin, Brazil). Air-drying slides at room temperature, followed by immersion drying in a 0.1% triarylmethane solution for 5 s, immersion for 5 s in a 0.1% xanthenes solution, distilled water and a 0.1% thiazines solution for 5 s, constituted the Diff-Quick protocol. Once the slides were prepared, they were allowed to air dry at room temperature. Morphological features of the spermatozoa were assessed using blinded observations conducted by a senior clinical embryologist using a light microscope at X1000 magnification using the oil immersion technique. At least 100 spermatozoa were analysed per sample. Classification of the sperm morphology was conducted using the Kruger Strict criteria, categorizing the spermatozoa into normal or abnormal (Verwei, Reference Verwei2004; Kamstrup et al., Reference Kamstrup, Berthelsen, Sassene, Selen and Müllertz2017).
Assessment of ROS levels in human spermatozoa
To determine the ROS levels in human sperm, intracytoplasmic hydrogen peroxide (H2O2) was measured using fluorescent dye probe, fluorescent indicator, 2’,7’-dichlorofluorescin diacetate (H2DCF-DA; Cat. No.: D399, Invitrogen) through flow cytometry (CytoFLEX, Beckman Coulter Life Sciences, CA, USA).
Sperm samples were divided into two groups: a test and control group. The control sample was directly measured by flow cytometry without applying any fluorescent dye (25 × 105 spermatozoa/mL). In the test sample, H2DCF-DA was added into the suspension of sperm at the final concentration of 10 μM (25 × 105 spermatozoa/mL). Samples were incubated in the dark at 25°C for 30 min. Subsequently, the stained spermatozoa were examined using flow cytometry. The levels of ROS were determined as a percentage and by fluorescence intensity with respect to the control group that received no treatment (Dogan et al., Reference Dogan, Aydin, Koroglu, Yilmazer, Albayrak, Cetin, Moshfeghi and Celik2024; Moshfeghi et al., Reference Moshfeghi, Yilmazer, Dogan, Aydin, Findikli and Ozbek2024; Yilmazer et al., Reference Yilmazer, Moshfeghi, Cetin and Findikli2024).
L929 fibroblast culture
The L929 (NCTC clone 929) mouse fibroblast cell line was used for cytotoxicity assay as per UNI EN Cytotoxicity ISO 10993 regulation (International Organization for Standardization, 2009). The L929 cells were grown in DMEM/F12 media at 37°C and 5% CO2 supported with 10% fetal bovine serum (FBS) and 1% penicillin/streptomycin. The confluent cells were removed from the surface of the culture through trypsinization. After centrifugation, the cell count in the resultant pellet was ascertained by a haemocytometer. The cytotoxicity tests were then conducted on the cells.
Cytotoxicity assays
L929 cells were seeded into 96-well plates (catalogue no. 167574) at a density of 1 × 10⁴ cells per well and cultured in DMEM supplemented with 2 mM L-glutamine and 10% FBS. After treatment with the prepared CoQ10 samples, the cells were incubated at 37°C in a humidified atmosphere containing 5% CO2 for 24 h. Cell viability was then evaluated using the MTT [3-(4,5-dimethylthiazol-2-yl)-2,5-diphenyltetrazolium bromide] assay. Following incubation, the cell culture medium (DMEM + 2 mM Glutamine + 10% FBS) was removed and 100 μl of fresh DMEM along with 15 μl of MTT solution were added, followed by another 2-h incubation in the dark. The absorbance levels were read in a microplate reader at 570 nm. All experiments were performed five replicates. A sample was regarded as cytotoxic if percent viability was 70% or less, and those with percent viability greater than 70% were regarded as noncytotoxic (Cannella et al., Reference Cannella, Altomare, Leonardi, Russotto, Di Bella, Mira and Guercio2020). Following the 24-h incubation, images of the L929 fibroblast cells treated with the materials were captured using a Leica DMI6000 inverted microscope.
HPLC analysis
Chemicals
CoQ10, Sodium chloride (NaCl), urea, uric acid, pancreatin (8xUSP) and alpha-amylase (1,4-α-D-Glucan-glucanohydrolase, α-Amylase from aspergillus oryzae powder, 1.5 units/mg ∼0.2 U), sodium hydroxide (NaOH), hydrogen chloride acid (HCl), potassium chloride (KCl), calcium chloride monohydrate (CaCl2.H2O), sodium bicarbonate (NaHCO3) were used from Sigma-Aldrich (St. Louis, MO, USA).
Preparation of samples
Red meat was cooked for 30 min in a preheated 180°C oven. The egg was boiled for another 5 min after the water started to boil. Cauliflower, broccoli and spinach were boiled for 5 min. Then, the samples were homogenized and prepared samples were weighed for analysis.
Preparation of solutions and standards
In vitro digestion procedure
The in vitro digestive system was used to investigate the bioaccessibility of CoQ10 in foods and dietary supplements. Experiments were implemented with minor adjustments to the earlier approach of Lee, Lee, Chung and Hur (Lee et al., Reference Lee, Lee, Chung and Hur2016). Five g of the samples were weighed into 100 mL flasks and in vitro digestion was carried out by adding mouth, gastric juice and duodenal juice, respectively. In the mouth phase, 5 mL of the mouth solution was added to 5 g of the sample in a 100 mL beaker and mixed with vortex for 1 min. Then the suspension was incubated for 5 min at 37°C in a shaking water bath. After the oral phase, 12 mL of gastric solution was added in the gastric phase. It was mixed by vortexing for 1 min, then incubated again for 2 h at 37°C in a shaking water bath. For the duodenal phase, 10 mL of duodenal phase and 5 mL of bile juice were added to the mixture obtained from the gastric phase. The mixture was incubated in a shaking water bath again at 37°C for 2 h. After the digestion process finished, the final volume was filled to 50 mL with deionized water (DI water). The samples were then centrifuged at 8000 rpm for 10 min, filtered using a 0.22-micron CA filter and kept at −80°C until analysis. The bioaccessible amount of CoQ10 was analysed by high-performance liquid chromatography (HPLC).
Digestive enzymes and organic, inorganic solutions
Mouth phase; alpha-amylase (280 mg), mucin (25 mg), NaCl (1.7 mL, 175.3 g/L), uric acid (15 g), urea (8 mL, 25 g/L) were dissolved in DI water in a 500 mL beaker. The pH was then adjusted to approximately 6.8 (± 0.2). Gastric phase; HCl (6.5 mL, 37 g/L), pepsin (2.5 g) and mucin (3 g), CaCl2.H2O (18 mL, 22 g/L), bovine serum albumin (1 g) were dissolved in DI water in a 500 mL low-form glass beaker, the final volume was adjusted with DI water. The pH was adjusted to 1.5 (± 0.02). Duodenal juice contains KCl (6.3 mL, 89.6 g/L), bovine serum albumin (2 g), CaCl2.H2O (9 mL, 22.2 g/L), pancreatin (1 g) and lipase (1.5 g). The components were dissolved with DI water in a flask and the volume was prepared by completing it with DI water. The pH was adjusted to 8.0 (± 0.2). Bile juice is dissolved in NaHCO3 (68.3 mL, 84.7 g/L), bovine serum albumin (1.8 g), CaCl2.H2O (10 mL, 22.2 g/L) and bile (30 g) in a 500 mL beaker in DI water and the volume was made up with DI water. The pH was adjusted to 7.0 (± 0.2) (Yaman and Mızrak, Reference Yaman and Mızrak2019).
Chromatographic conditions
CoQ10 amounts were performed by HPLC. 100 mg of CoQ10 standard was dissolved with a 95:5 volume solution containing n-hexane-tetrahydrofuran and made up to 100 mL. A solution containing 95:5 n-hexane-tetrahydrofuran was prepared for extraction of CoQ10. This solution was added to 5 g for each sample and mixed by vortexing for 1 min. After that the samples were centrifuged at 8000 rpm for 10 min. 2 mL of the liquid part was taken into glass tubes and evaporated under nitrogen flow at 40°C, then dissolved with a 95:5 hexane-tetrahydrofuran solution, filtered with 0.22-micron PTFE filter and taken into vials for HPLC analysis. The Shimadzu Nexera-i HPLC system with UV-DAD detector (270 nm) (Shimadzu Corporation, Kyoto, Japan) was used for CoQ10 determination. 500 mL of acetonitrile, 450 mL of tetrahydrofuran and 50 mL of water were used to produce the mobile phase. A Luna C18 column was used for separation and column oven temperature was set 25°C (Supplementary Figure 1A–1B). 1 mL/min was the flow rate that was set (Temova-Rakuša et al., Reference Temova-Rakuša, Srečnik and Roškar2017).
Statistical analysis
All statistical procedures and graphical representations were performed using GraphPad 8.0 integrated program (GraphPad Software, Inc., CA, USA). The normality of the data distribution was assessed using the Shapiro–Wilk test. Statistical significance between the control and CoQ10-treated groups (10, 50 and 100 µM) was determined using one-way analysis of variance (ANOVA) and non-parametric Mann–Whitney U test. Results were given as mean value ± standard error (X ± SE). To identify specific differences between the groups while controlling multiple comparisons, Dunnett’s post hoc test was applied. For all analyses, A p-value < 0.05 was considered statistically significant.
Results
Demographic data
The age of the patients ranged from 23 to 40 years, with a mean age of and standard error 30.6 ± 0.93 years. The body mass index (BMI) varied from 20.4 to 29.4 kg/m2, with a mean BMI of 23.89 ± 0.44 kg/m2. In terms of lifestyle factors, 52.8% of the participants were smokers, while 47.2% were non-smokers. Alcohol consumption was reported by 53.7% of the patients, whereas 46.3% abstained from alcohol.
CoQ10 improve sperm cell motility
The effects of CoQ10 supplementation on sperm total and progressive motility were evaluated across different dosage groups, and the results are summarized in Table 1. In the control group, the mean total motility was 83.57 ± 2.38%, with values ranging from 50% to 99%. Supplementation with 10 µM CoQ10 resulted in a marginal increase in mean total motility to 85.52 ± 3.94%; however, this change was not statistically significant (p = 0.0993). Notably, the 50 µM CoQ10 group significantly increased total motility, reaching 88.62 ± 2.60% (p = 0.0456) compared to the control. Conversely, the highest dose of 100 µM CoQ10 did not produce a significant change, with mean total motility recorded at 85.52 ± 3.54% (p = 0.1684). Regarding progressive motility, the control group demonstrated a mean value of 71.57 ± 3.30%, with a range between 40% and 95%. The 10 µM CoQ10 supplementation led to an increase in mean progressive motility to 76.43 ± 4.41%; but this improvement was not statistically significant (p = 0.1947). The administration of 50 µM CoQ10 resulted in a significant enhancement of mean progressive motility, elevating it to 81.38 ± 3.30% (p = 0.0373). Like total motility outcomes, the 100 µM dose did not yield a significant effect on progressive motility, which was measured at 74.57 ± 4.73% (p = 0.2682) (Figure 1).
The effect of CoQ10 on sperm motility. This study evaluated the impact of varying doses of CoQ10 on sperm motility. (A) Shows the overall sperm motility for all doses of CoQ10 (10 µM, 50 µM, and 100 µM) compared to the control. An increase in motility is observed with higher doses. (B) Highlights the 10 µM dose, where no significant changes in total or progressive motility were observed compared to the control. (C) Focuses on the 50 µM dose, which led to a significant increase in total motility, although the increase in progressive motility was not statistically significant. (D) Depicts the 100 µM dose, where neither total nor progressive motility showed significant differences from the control.

Figure 1. Long description
Panel A: A bar graph shows sperm motility percentages for control and varying doses of CoQ10 (10 µM, 50 µM, and 100 µM). The y-axis represents sperm motility in percent, and the x-axis categorizes total and progressive motility for each dose. Panel B: Two bar graphs compare total and progressive motility between the control and 10 µM CoQ10. The y-axis represents motility in percent, and the x-axis differentiates control and CoQ10 10 µM. Panel C: Two bar graphs compare total and progressive motility between the control and 50 µM CoQ10. The y-axis represents motility in percent, and the x-axis differentiates control and CoQ10 50 µM. Panel D: Two bar graphs compare total and progressive motility between the control and 100 µM CoQ10. The y-axis represents motility in percent, and the x-axis differentiates control and CoQ10 100 µM.
Effect of CoQ10 supplementation on total and progressive motility in different dosage groups

Table 1. Long description
A table with descriptive statistics on total motility and progressive motility percentages across different dosage groups of CoQ10 supplementation. The table has four rows and eight columns. Column headers are Descriptive statistics, Total motility (%), Progressive motility (%), Dosage groups, Min, Max, Mean ± SE, and p Value. Row labels are Control, CoQ10 10 μM, CoQ10 50 μM, and CoQ10 100 μM. Row 1: Control, 50, 99, 83.57 ± 2.38, -, 40, 95, 71.57 ± 3.30, -. Row 2: CoQ10 10 μM, 40, 100, 85.52 ± 3.94, 0.093, 32, 100, 76.43 ± 4.41, 0.1947. Row 3: CoQ10 50 μM, 50, 100, 88.62 ± 2.60, 0.0456, 45, 99, 81.38 ± 3.30, 0.0373. Row 4: CoQ10 100 μM, 40, 99, 85.52 ± 3.54, 0.1684, 30, 98, 74.57 ± 4.73, 0.2682.
The statistical analysis was performed using the GraphPad software and the Mann–Whitney U test was applied for the comparison between groups. A p-value of less than 0.05 was considered statistically significant. *Represents the comparison between Control and CoQ10 10 µM groups, **represents the comparison between Control and CoQ10 50 µM groups and ***represents the comparison between Control and CoQ10 100 µM groups, indicating the respective p-values.
CoQ10 effective on abnormal sperm cell morphology
The effects of different doses of CoQ10 (10, 50 and 100 µM) on sperm morphology and anomalies were evaluated. As shown in Figure 2, the 50 µM dose of CoQ10 significantly reduced both acrosomal and nuclear anomalies compared to the control group. However, the 100 µM dose did not result in further reductions and instead increased tail anomalies. These findings indicate that while 50 µM of CoQ10 is effective in improving certain aspects of sperm morphology, higher doses may not provide additional benefits and could potentially introduce negative effects. No statistically significant differences were observed among the groups (p > 0.05). (Figure 2).
Effects of different doses of CoQ10 on sperm morphology and anomalies. No statistically significant differences were observed among the groups (p > 0.05).

CoQ10 reduces ROS production of human sperm
A ROS assay was conducted using flow cytometry following sperm washing. Among the treatment groups, sperm motility was highest in the CoQ10 50 µM group, which also exhibited the lowest level of ROS production. Post-washing, the average ROS level in the control group was 14.16 ± 0.15%. This value decreased to 10.61 ± 0.12% in the CoQ10 10 µM group, 5.61 ± 0.08% in the CoQ10 50 µM group and 8.48 ± 0.08% in the CoQ10 100 µM group (Figure 3). Moreover, A significant decrease in ROS levels was observed in cells treated with CoQ10 50 µM in comparison with the control group (p = 0.0274), pointing to a dose-related antioxidant effect.
(A) Flow cytometry dot plots from a single sample. (B) ROS levels compared with groups and CoQ10 50 µM showed statistically significant difference in ROS levels compared to other conditions (p = 0.0274).

CoQ10 increases sperm cell viability
At 24 and 48 h, the effects of various CoQ10 doses on the proliferation of L929 cells were evaluated. As illustrated in Supplementary Figure 2A–2B, and detailed in the accompanying Table 2, CoQ10 treatment resulted in varying levels of cell viability across the tested concentrations. At 24 h, all doses of the CoQ10 maintained high cell viability. The 10 µM dose resulted in a viability of 91.47% ± 1.02, the 50 µM dose increased viability to 95.73% ± 0.68 and the 100 µM dose resulted in 89.95% ± 0.57. These findings indicate that all treatment groups maintained relatively high cell viability. At 48 h, similar results were observed. The 10 µM dose resulted in a viability of 90.56% ± 0.59, the 50 µM dose again showed high viability at 99.32% ± 0.63 and the 100 µM dose resulted in 91.5% ± 0.59. The data suggests that CoQ10, particularly at 50 µM, supports sustained cell viability over time, with viability remaining high across all doses. At 24 h, the 50 µM dose maintained high viability with no significant difference compared to the control (p = 0.82). Similarly, at 48 h showing a highly non-significant relationship with the control group (p > 0.999). In contrast, the 10 µM and 100 µM doses exhibited significant reductions in viability at both time points (p < 0.05). (Data shown Table 2).
Descriptive analysis of the effects of CoQ10 on the viability of L929 cells at 24 and 48 hours

Table 2. Long description
The table presents data on the effects of CoQ10 on the viability of L929 cells at 24 and 48 hours. It has four rows and eight columns. The columns are labeled Hours, Groups, Min, Max, Mean ± SE, p Value for 24 h, Min, Max, Mean ± SE, p Value for 48 h. The rows are labeled Control, CoQ10 10 μM, CoQ10 50 μM, and CoQ10 100 μM. Row 1: Control, 100.00, 100.00, 100 ± 0, -, 100.00, 100.00, 100 ± 0, -. Row 2: CoQ10 10 μM, 89.79, 94.34, 91.47 ± 1.02, 0.0411, 89.31, 91.92, 90.56 ± 0.59, 0.041. Row 3: CoQ10 50 μM, 94.20, 96.97, 95.73 ± 0.68, 0.82, 98.29, 101.20, 99.32 ± 0.63, >0.999. Row 4: CoQ10 100 μM, 88.87, 91.44, 89.95 ± 0.57, 0.0078, 90.37, 93.03, 91.5 ± 0.59, 0.041. The table shows the minimum, maximum, mean, and standard error of cell viability for each group at 24 and 48 hours, along with the p-values indicating the significance of the differences compared to the control group.
The statistical analysis was performed using the GraphPad software, and the one-way Anova test was applied and followed by Dunnett’s post hoc test for multiple comparisons against the control group. A p-value of less than 0.05 was considered statistically significant.
Bioaccessibility of CoQ10 in vitro digestion
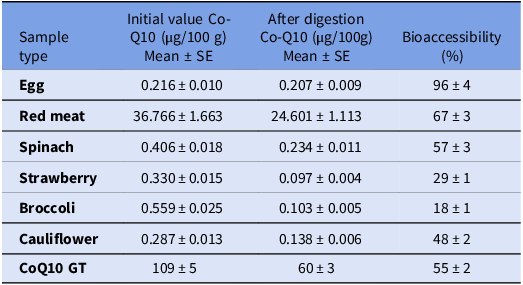
We utilized HPLC analysis to quantify the CoQ10 content in various food samples both before and after in vitro digestion. CoQ10 content and bioaccessibility of various food samples were analysed before and after in vitro digestion, as detailed in Table 3. The initial CoQ10 content varied significantly among the different food types. Among the animal-derived samples, egg had an initial Co-Q10 concentration of 0.216 ± 0.010 µg/100 g, which slightly decreased to 0.207 ± 0.009 µg/100 g after digestion, resulting in a bioaccessibility of 96 ± 4%. Red meat had the highest initial Co-Q10 concentration of all samples, with 36.766 ± 1.663 µg/100 g, and after digestion, it retained 24.601 ± 1.113 µg/100 g, with a bioaccessibility of 67 ± 3%.
CoQ10 amounts and bioaccessibility before and after digestion of foods

Table 3. Long description
The table presents data on the CoQ10 content and bioaccessibility in various food samples before and after in vitro digestion. It consists of six rows and four columns. The columns are labeled as follows: Sample type, Initial value Co-Q10 (g/100 g) Mean ± SE, After digestion Co-Q10 (g/100 g) Mean ± SE, and Bioaccessibility (%). The sample types include Egg, Red meat, Spinach, Strawberry, Broccoli, Cauliflower, and CoQ10 GT. Row 1: Egg, Initial value Co-Q10 0.216 ± 0.010, After digestion Co-Q10 0.207 ± 0.009, Bioaccessibility 96 ± 4. Row 2: Red meat, Initial value Co-Q10 36.766 ± 1.663, After digestion Co-Q10 24.601 ± 1.113, Bioaccessibility 67 ± 3. Row 3: Spinach, Initial value Co-Q10 0.406 ± 0.018, After digestion Co-Q10 0.234 ± 0.011, Bioaccessibility 57 ± 3. Row 4: Strawberry, Initial value Co-Q10 0.330 ± 0.015, After digestion Co-Q10 0.097 ± 0.004, Bioaccessibility 29 ± 1. Row 5: Broccoli, Initial value Co-Q10 0.559 ± 0.025, After digestion Co-Q10 0.103 ± 0.005, Bioaccessibility 18 ± 1. Row 6: Cauliflower, Initial value Co-Q10 0.287 ± 0.013, After digestion Co-Q10 0.138 ± 0.006, Bioaccessibility 48 ± 2. Row 7: CoQ10 GT, Initial value Co-Q10 109 ± 5, After digestion Co-Q10 60 ± 3, Bioaccessibility 55 ± 2.
Values are presented as means ± standard error (SE), with n = 3. Statistical differences between applications within the same rows are indicated by different letters. Differences were considered statistically significant based on the results of ANOVA followed by Kruskal–Wallis test (p < 0.05).
Among the plant-based sources, spinach showed an initial Co-Q10 concentration of 0.406 ± 0.018 µg/100 g, which decreased to 0.234 ± 0.011 µg/100 g after digestion, corresponding to a bioaccessibility of 57 ± 3%. Strawberries had an initial Co-Q10 content of 0.330 ± 0.015 µg/100 g, which significantly reduced to 0.097 ± 0.004 µg/100 g post-digestion, resulting in a bioaccessibility of 29 ± 1%. Broccoli, with an initial Co-Q10 concentration of 0.559 ± 0.025 µg/100 g, dropped to 0.103 ± 0.005 µg/100 g after digestion, showing the lowest bioaccessibility of 18 ± 1%. Cauliflower initially contained 0.287 ± 0.013 µg/100 g of Co-Q10, which decreased to 0.138 ± 0.006 µg/100 g after digestion, yielding a bioaccessibility of 48 ± 2%. For comparison, the CoQ10 supplement had the highest initial Co-Q10 concentration (109 ± 5 µg/100 g), which dropped to 60 ± 3 µg/100 g after digestion, with a bioaccessibility of 55 ± 2%. These results highlight significant differences in Co-Q10 content and bioaccessibility across different food types. Animal-based foods, especially red meat and eggs had higher Co-Q10 levels and greater bioaccessibility compared to plant-based sources.
Discussion
The WHO releases semen analysis as the basic tool for diagnosing male infertility by assessing parameters such as sperm concentration, morphology and motility (Patel et al., Reference Patel, Leong and Ramasamy2017). However, despite its widespread use, semen analysis is often inadequate in predicting infertility because it does not evaluate sperm function. This evaluates leaves about 50% of male infertility cases unexplained and leads classified as idiopathic infertility (Cutini et al., Reference Cutini, Bruno, Mancini and Balercia2020; Eisenberg et al., Reference Eisenberg, Esteves, Lamb, Hotaling, Giwercman, Hwang and Cheng2023). Research has defined oxidative stress as a primary condition in the aetiology of male infertility (Walke et al., Reference Walke, Gaurkar, Prasad, Lohakare and Wanjari2023). Oxidative stress increases from an imbalance between ROS and antioxidant defences, leading to increases harmful effect on reproductive health. Extreme ROS levels in seminal flow can damage sperm DNA, thereby impacting sperm quality and function (Busetto et al., Reference Busetto, Del Giudice, Virmani, Sciarra, Maggi, Ferro, Porreca, Chung, Agarwal and De Berardinis2020).
Considering the high energy demand of sperm cells for processes like fertilization and motility, suitable nutrition is an important factor to support sperm development and fertility (Jurewicz et al., Reference Jurewicz, Radwan, Sobala, Radwan, Bochenek and Hanke2018). Nutritional elements, including antioxidants systems, are vital in maintaining sperm health, protecting reproductive hormone levels and increasing semen quality. Dietary supplements rich in antioxidants can moderate oxidative stress, develop sperm quality and enhanced sperm motility (Eisenberg et al., Reference Eisenberg, Esteves, Lamb, Hotaling, Giwercman, Hwang and Cheng2023).
CoQ10 is an important nutrient present in each cell membrane and plays a vital role in cellular respiration and metabolism. CoQ10 is an antioxidant that both participates in energy production and inhibits oxidative damage by preventing lipid peroxidation of sperm membranes (Balercia et al., Reference Balercia, Mosca, Mantero, Boscaro, Mancini, Ricciardo-Lamonica and Littarru2004; Salas-Huetos et al., Reference Salas-Huetos, James, Aston, Jenkins and Carrell2019). Previous study has shown that CoQ10 supplementation can improve sperm motility, morphology and density in men with idiopathic male infertility. Moreover, CoQ10 supplementation increases levels of not only ubiquinone but also ubiquinol in semen, which ensure enhanced sperm kinetic characteristic (Balercia et al., Reference Balercia, Buldreghini, Vignini, Tiano, Paggi, Amoroso, Ricciardo-Lamonica, Boscaro, Lenzi and Littarru2009 Reference Balercia, Mosca, Mantero, Boscaro, Mancini, Ricciardo-Lamonica and Littarru). The present study showed that the 50 µM dose of CoQ10 significantly decreased acrosomal and nuclear anomalies, while the 100 µM dose introduced tail anomalies, indicating that higher doses might have contrary effects on sperm morphology.
Sperm motility is one of the critical factors determining fertility, and CoQ10 has been reported to significantly influence motility parameters, and it enhances sperm energy production. Omer el at. have reported that CoQ10 supplementation can cause improvements in sperm motility by decreasing ROS levels and supporting mitochondrial function to powers sperm movement (Omar et al., Reference Omar, Pal, Kelly, Bruins, Yuan, Diemer, Krausz, Tournaye, Kopa, Jungwirth and Minhas2019). A study involving 287 infertile men revealed that 12 months of CoQ10 supplementation significantly improved sperm motility, morphology and density (Safarinejad, Reference Safarinejad2012). Our study showed that CoQ10 supplementation, especially at 50 µM, importantly advanced total and progressive motility. However, 100 µM dose did not yield further improvements, suggesting that an optimal dose exists for enhancing motility. Our findings demonstrated that CoQ10 improved sperm cell viability, supporting and has potential in improving sperm cell health.
HPLC is employed to evaluate the bioaccessibility of nutrients and supplements. The HPLC method allows for the specified analysis of how nutrients are absorbed, utilized and metabolized in the cell after and before digestion. CoQ10, being a fat-soluble compound, requires proper digestion and absorption mechanisms to be bioavailable. Factors such as the pH during digestion and the presence of dietary fats can importantly impact its bioaccessibility. Previous studies have shown that CoQ10 bioaccessibility might variously depending on the food source or supplement form, and HPLC analysis is a gold standard method to monitor these changes (Ercan and El, Reference Ercan and El2012). Our study demonstrated that animal-based foods, including red meat and eggs, had higher CoQ10 levels and bioaccessibility compared to plant-based foods, making them more effective sources for CoQ10 intake.
Consequently, we demonstrated that the profitable effects of CoQ10 supplementation on male infertility, especially in improving sperm motility, morphology and cell viability. The optimal dose of 50 µM CoQ10 significantly developed total and progressive motility and reduced acrosomal and nuclear anomalies. Furthermore, CoQ10 was shown to support sustained cell viability, further emphasizing its role in reproductive health. The HPLC method emphasized that animal-based foods offer higher CoQ10 bioaccessibility compared to plant-based sources, making diet and supplement together more effective choices to increase CoQ10 intake. These findings indicate that CoQ10 supplementation, combined with a diet rich in CoQ10, especially animal-based diet, could be a promising approach to improving male infertility, especially in subtype of idiopathic infertility. Our study will shed light on future treatment and dietary recommendations in male infertility and contribute to the literature by shedding light on new studies on the optimal dosage and bioaccessibility of dietary CoQ10.
Supplementary material
The supplementary material for this article can be found at https://doi.org/10.1017/S096719942610063X.
Data availability statement
The data utilized and analysed during the present study is accessible from the corresponding author.
Author contributions
Yasemin Yilmazer: Conceptualization-Lead, Funding acquisition-Lead, Methodology-Equal, Project administration-Lead, Supervision-Lead, Writing – review & editing-Lead; Sermin Durak: Data curation-Equal, Formal analysis-Equal, Visualization-Equal, Writing – original draft-Equal; Mustafa Yaman: Formal analysis-Equal, Methodology-Equal, Validation-Equal, Writing – review & editing-Equal; Sinem Dogan: Conceptualization-Equal, Investigation-Equal, Resources-Equal; Aleyna Cavdar: Methodology-Equal, Writing – original draft-Equal; Busra Sagir: Data curation-Equal, Visualization-Equal, Writing – review & editing-Equal; Turgut Aydin: Formal analysis-Equal, Validation-Equal.
Funding information
This work was supported by Research Fund of the Scientific and Technological Research Council of Turkey (TUBITAK 1507) (Project No: 7218008).
Competing interests
The authors declare no conflict of interest or non-financial interests.
Ethical standards
Ethics approval has been obtained.
Consent to participate
The informed consent form has been obtained from individuals. Consent for publication has been obtained, including appropriate statements regarding the publication of an individual’s data.
Use of artificial intelligence
The authors used ChatGPT (OpenAI) solely to improve the English language and readability of the manuscript. All scientific content, data analysis, interpretation and conclusions were developed and verified by the authors, who take full responsibility for the manuscript.







 Open access

