Implications
Dietary lipid supplementation has variable effects on dairy goat milk performance and fatty acid (FA) profile, with unknown influences on hepatic and renal metabolism. The current paper evidences that dietary supplementation of extruded linseed to grazing lactating goats can enhance milk fat nutritional profile, without harming liver and kidneys. This is very important for animal health status when fat supplement is used in the farm aiming to improve the milk FA profile.
Introduction
Lipid supplementation is usually adopted to increase ration energy concentration in early lactating ruminants, which have high requirements for milk production and low dry matter (DM) intake. Several studies have showed that the use of unprotected fat supplements from whole seeds, free oil or animal sources increased milk yield and milk fat and protein concentration in dairy goats (Chilliard et al., Reference Chilliard, Ferlay, Rouel and Lamberet2003; Pulina et al., Reference Pulina, Nudda, Battacone, Fancellu and Francesconi2008). However, the use of rumen protected or inert forms of fat in the diet, if included in amounts higher than 7% of concentrate, decreased milk yield, increased milk fat concentration and did not change milk protein concentration in dairy goats (Pulina et al., Reference Pulina, Nudda, Battacone, Fancellu and Francesconi2008).
Recently, the use of oil supplementation to improve the fatty acid (FA) composition of ruminant dairy products has received great attention, because of the increasing consumer awareness of food healthiness. In dairy goats, linseed supplementation increased the levels of milk FA with potentially positive nutritional effects, such as CLA cis9trans11 and n-3 family (Nudda et al., Reference Nudda, Battacone, Usai, Fancellu and Pulina2006; Luna et al., Reference Luna, Bach, Juárez and de la Fuente2008; Bernard et al., Reference Bernard, Bonnet, Leroux, Shingfield and Chilliard2009), but animal responses varied considerably among trials. Grazing on pasture increased CLA cis9trans11 and n-3 contents in goat milk as well, even if at a lower degree than that observed in dairy sheep milk, under the same dietary regimen (Tsiplakou et al., Reference Tsiplakou, Mountzouris and Zervas2006), probably because of the different feeding behavior and metabolism of the two species.
Dietary fat supplementation can influence not only animal performance but also animal health. For example, high-fat diet (6.9% of DM) was associated with hepatic steatosis development in early-lactation cows (Lubojacká et al., Reference Lubojacká, Pechová, Dvořák, Drastich, Kummer and Poul2005; Pechova et al., Reference Pechova, Dvorak, Drastich, Lubojacka, Pavlata and Poul2006), but not in mid- to late-lactation cows (Vazquez-Añon et al., Reference Vazquez-Añon, Bertics, Luck, Grummer and Pinheiro1994). The effect of fat supplement on hepatic metabolism varies also with fat source. Liver condition was better in cows supplemented with full-fat soy than in those fed hydrolyzed palm oil (Bellová et al., Reference Bellová, Pechová, Dvořák and Pavlata2009). Hepatic lipid accumulation even decreased in transition dairy cows (Petit et al., Reference Petit, Palin and Doepel2007), when the source of dietary fat was rich in alpha-linolenic acid (18:3 n-3), for example linseed. In dairy goats, linseed has been extensively used to improve the milk FA profile, but to our knowledge its impact on hepatic and kidney metabolism has not been evaluated. The objective of this experiment is to investigate if linseed supplementation to dairy goats, used to improve milk performance, affects their liver and kidney metabolic activities.
Material and methods
Animals, design, treatments and samples collection
The experiment was conducted in a farm located in the NW of Sardinia (Italy, 41°N, 300 m a.s.l.). The experiments on the animals followed the EC Council Directive (86/609/EEC) regulating the use of animals for experimental and other scientific purposes in the European Union. Forty Saanen goats (BW 52.8 ± 6.8 kg, mean ± s.d.) in mid-lactation (120 days in milk) were randomly divided into two isoproductive groups: the control (CON; 2.29 ± 0.57 kg/day of milk) group and the group supplemented with extruded linseed (LIN; 2.32 ± 0.42 kg/day of milk). The basal diet of all animals was composed of 1.2 kg/day of ryegrass long hay and 520 g/day of pelleted concentrate (DM basis), individually administered during the two daily milkings (0730 and 1630 h). The LIN group was also supplemented with 180 g/day of extruded linseed (DM basis) per head. The extruded linseed was obtained by dry extrusion of whole linseed (Linum usitatissimum L.) at 155°C before oil extraction by mechanical press. This extruded linseed dose supplied 70 g/day of fat per head, which was double that used to modify the milk FA profile in previous studies with goats in mid- (Nudda et al., Reference Nudda, Battacone, Usai, Fancellu and Pulina2006) and early-lactation (Nudda et al., Reference Nudda, Palmquist, Battacone, Fancellu, Rassu and Pulina2008). To obtain similar energy level of diet in both groups, the CON group received an additional amount of 180 g/day of pelleted concentrate (in total 700 g/day of concentrate per head). Goats grazed on pasture (ryegrass and white clover mixture) during ∼3 h after the morning milking every day. Pasture intake was estimated to be equal to 520 g of DM based on animal energy requirements. Diets were formulated to meet the goats energy and protein requirements using the Small Ruminant Nutrition Model (Tedeschi et al., Reference Tedeschi, Cannas and Fox2010). The nutritive value of the diet, estimated by the same model, was characterized by 2.2 Mcal of metabolizable energy (ME)/kg of DM, soluble protein content higher than 33% of diet CP content and positive nitrogen rumen balance for both LIN and CON diets. Protein content of the diet was set at low values (∼120 g/kg DM) to prevent excess of soluble protein intake because of the selective behavior of grazing goats (Avondo et al., Reference Avondo, Bonanno, Pagano, Di Grigoli, Giambalvo and Alicata2007). The fat content in the complete ration was, on DM basis, 34 g/kg in the CON and 55 g/kg in the LIN group. The trial lasted 9 weeks: 1 week for adaptation and 8 weeks for data collection in May and June. During the period of adaptation each group received its respective experimental diet.
Samples of dietary ingredients (concentrate, hay and extruded linseed) were collected at the start of the trial and samples of pasture were collected at the beginning and the end of the experimental period for chemical analysis. During the trial, individual concentrate intake and the average hay group intake were measured fortnightly. Weekly individual milk yield was recorded and individual and bulk (from each treatment) milk samples were collected twice a day (i.e. at each milking). Individual milk samples added of the preservative bronopol were stored at 4°C until analyzed for fat, protein, lactose, milk urea nitrogen (MUN) and somatic cell count (SCC). Bulk milk samples without preservative were frozen at −20°C until analyzed for FA profile.
Every 2 weeks, starting from the second week of the experiment, blood samples were collected after the morning milking (at 0800 h), by jugular veinpuncture into 10-ml vacutainer tubes (Becton Dickinson, Le Pont Claix, France), were immediately placed on a box containing freezer-packs and centrifuged within 1 h of collection. The blood serum was stored at −20°C until chemical analysis.
Feed and milk analysis
The DM content of the feed was determined by oven-drying at 105°C for 24 h. Dried feed samples were analyzed for NDF, ADF and ADL using the filter bag equipment of Ankom (Ankom Technology Corp., Fairport, NY, USA), ash (Association of Official Analytical Chemists, 2000; AOAC; method 942.05), CP (AOAC, 2000; method 988.05) and lipid extract (Folch et al., Reference Folch, Lees and Sloane Stanley1957). Chemical analyses were expressed as percentages of DM.
Individual milk samples composed of morning and afternoon milkings were analyzed for fat, protein, lactose and MUN by using a Milkoscan 6000 instrument (Foss Electric, Hillerød, Denmark), and for SCC by using a Fossomatic 360 instrument (Foss Electric). The bulk milk samples collected from the LIN and CON groups were analyzed for FA profile by gas chromatography. Milk fat was extracted and FA methyl esters (FAME) were prepared and quantified by procedure detailed by Nudda et al. (Reference Nudda, Battacone, Usai, Fancellu and Pulina2006). Analysis of FAME was performed using a 3400 CX gas chromatograph (Varian Inc., Palo Alto, USA) equipped with a flame ionization detector (FID) and operated with a split ratio of 1:40. Separation was accomplished on a CP-select CB for FAME (Varian Inc.) capillary column (100 m × 0.32 mm i.d., 0.25 μm film thickness). For all samples, the following oven temperature program was implemented: 75°C for 1 min, increased at 8°C/min to 165°C, held for 35 min, increased at 5.5°C/min to 210°C, held for 1 min and finally increased at 15°C/min to 240°C and held for 15 min. The injector and detector temperatures were set at 255°C. Helium served as the carrier gas with a pressure of 3.56 bar. Retention time and area of each peak were computed using the Varian Star 3.4.1. software. Individual FAME were identified by comparing them to known standards of FAME and published isomeric profiles as detailed in Nudda et al. (Reference Nudda, Palmquist, Battacone, Fancellu, Rassu and Pulina2008).
Blood analysis
A clinical chemistry system (Dimension RXL, Dade Behring, Ventura, California) was used to quantify creatinine, bilirubin, albumin, protein, urea nitrogen (BUN), alanine transaminase (ALT), aspartate transaminase (AST), gamma glutamyl transpeptidase (GGT) and alkaline phosphatase (ALP) in serum samples.
Calculations of fat quality indexes
The following milk fat nutritional indices were considered as predictors of the atherogenic and thrombogenic potential of the diet: n-6/n-3, atherogenic index (AI), thrombogenic index (TI) and hypocholesterolemic/hypercholesterolemic ratio (h/H). The AI and TI were calculated according to Ulbricht and Southgate (Reference Ulbricht and Southgate1991) as follows: AI = [12:0 +(4 × 14:0) + 16:0]/[(∑PUFA) + (∑MUFA)], and TI = [14:0 + 16:0]/[(0.5 × ∑MUFA) + (0.5 × n-6) + (3 × n-3) + (n-3/n-6)]. The 18:0 present in the original TI formula was not included in the current formula, because it does not influence human serum cholesterol (Kelly et al., Reference Kelly, Sinclair, Mann, Turner, Abedin and Li2001). The h/H was calculated according to Fernández et al. (Reference Fernández, Ordóñez, Cambero, Santos, Pin and Hoz2007) as follows: h/H = [(sum of 18:1cis9, 18:1cis11, 18:2n-6, 18:3n-6, 18:3n-3, 20:3n-6, 20:4n-6, 20:5n-3, 22:4n-6, 22:5n-3 and 22:6n-3)/(sum of 14:0 and 16:0)].
Statistical analysis
Data of milk yield and composition and blood parameters were analyzed with a repeated measures linear mixed model using SAS version 9.2 (SAS Institute Inc., Cary, USA). The model accounted for the fixed effects of dietary treatment, time and the interaction between treatment and time, plus the random effects of goat nested within the treatment. Data referring to FA profile of bulk milk from the two groups were compared by one-way ANOVA.
Results and discussion
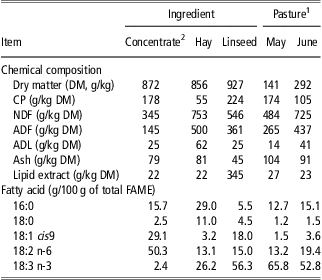
The chemical composition and FA profile of the dietary ingredients, including the extruded linseed supplied only to the LIN group, and of pasture are shown in Table 1. During the experiment, the available concentrate (700 g/day) and hay (1.2 kg/day) were completely eaten by animals of both groups. The predominant FA of the lipid fraction in hay were palmitic acid (16:0) and α-linolenic acid (18:3 cis9cis12cis15, ALA), present in similar proportions (29% and 26% of total FA, respectively). The main FA in pasture was ALA, which accounted for 66% and 53% of total FA in May and June, respectively. Differently, the most abundant FA in the commercial concentrate was linoleic acid (18:2 cis9cis12), followed by oleic acid (18:1 cis9), present at 50% and 29% of FA, respectively. The addition of extruded linseed increased the total dietary lipid content in the LIN group when compared to the CON group, because extruded linseed contained 34.5% of lipids, especially ALA (56% of FA).
Chemical composition and fatty acid profile of dietary ingredients and pasture of dairy goats
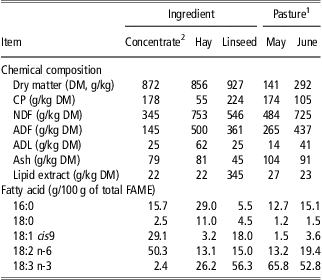
DM = dry matter; ADL = acid detergent lignin; FAME = fatty acid methyl esthers.
1Pasture composition at the beginning and at the end of the experiment.
2Commercial concentrate with the following ingredients: dehydrated alfalfa meal, wheat bran, corn gluten, sunflower seeds flour, soybean hulls, soybean flour, corn flour, sugar beet molasses, calcium carbonate from powdered calcium rocks, distilled wheat, sodium chloride and sodium bicarbonate. Minerals supplement: Fe (FeSO4) 50 mg/kg, Iodine (Ca(IO3)2) 1.6 mg/kg, MnO 100 mg/kg, Se (Na2SeO3) 0.30, ZnO 100 mg/kg, and Mo (Na2MoO4) 1.4 mg/kg. Vitamin supplement: A 51,000 UI/kg, D3 5,000 UI/kg, E 40 mg/kg, B12 0.06 mg/kg.
Milk yield and milk composition
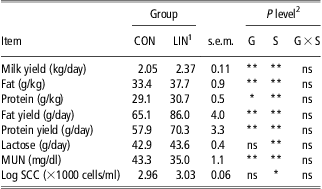
Milk yield and composition in the CON and LIN groups are reported in Table 2. All parameters were influenced by diet, except for lactose and SCC, and by sampling. The group × sampling interaction, instead, was not significant for the studied parameters.
Milk yield and composition of dairy goats fed diets with (LIN group) or without (CON group) addition of extruded linseed
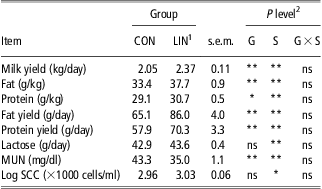
MUN = milk urea nitrogen; SCC = somatic cell count; s.e.m = standard error of mean.
1LIN = extruded linseed added at 180 g of DM/day (DM basis) which supplied 70 g/day of linseed oil per head.
2G = effect of experimental group (control v. linseed), S = effect of sampling and G × S = effect of interaction. **P < 0.01; *P < 0.05; ns = non-significant (P > 0.10).
Milk yield decreased over time in LIN and CON groups (data not showed), following the natural evolution of the lactation curve in dairy goats (Macciotta et al., Reference Macciotta, Dimauro, Steri and Cappio-Borlino2008) and the worsening of the pasture quality as season progressed, as evidenced by its chemical analysis (Table 1). In both groups, the milk fat content varied without a clear trend during the sampling period, whereas the protein content decreased during the trial, following the pattern of milk yield (data not showed).
On average, the milk yield of LIN goats was 15.4% higher (P < 0.01) than that of CON goats. Although previous studies in goats reported that linseed supplement either did not affect (Bernard et al., Reference Bernard, Bonnet, Leroux, Shingfield and Chilliard2009; Martinez Marin et al., Reference Martinez Marin, Gómez-Cortés, Gómez Castro, Juárez, Pérez Alba, Pérez Hernández and de la Fuente2011) or decreased (Luna et al., Reference Luna, Bach, Juárez and de la Fuente2008) milk yield, the increase of milk yield by LIN observed in the current study is in agreement with observations reported in dairy cows (Hurtaud et al., Reference Hurtaud, Faucon, Couvreur and Peyraud2010) and ewes (Gómez-Cortés et al., Reference Gómez-Cortés, Bach, Luna, Juárez and de la Fuente2009).
The use of extruded linseed in the LIN group also raised (P < 0.01) average milk fat concentration and fat yield. In a previous study, milk fat concentration did not change when dairy goats were supplemented with different sources of PUFA-rich vegetable oils offered in different physical forms (free oil or whole, crushed, extruded oilseed; Chilliard et al., Reference Chilliard, Ferlay, Rouel and Lamberet2003). However, more recently, milk fat concentration increased because of linseed oil supplementation in dairy goats (Bernard et al., Reference Bernard, Bonnet, Leroux, Shingfield and Chilliard2009; Martinez Marin et al., Reference Martinez Marin, Gómez-Cortés, Gómez Castro, Juárez, Pérez Alba, Pérez Hernández and de la Fuente2011). In our study, diets for LIN and CON treatments did not differ in ME content; in fact the higher content of NFC and the lower content of NDF and ADL in the CON diet, because of a higher amount of concentrate, was compensated by the higher fat content of the extruded linseed in the LIN diet (Table 1). Therefore, the differences in production levels and milk fat concentration between the two experimental groups of mid-late lactating goats were probably caused by differences in the characteristics of the nutrients, especially the energetic source, supplied with the LIN and CON diets. Dairy ewes (Zenou and Miron, Reference Zenou and Miron2005) and dairy cows (Schwab et al., Reference Schwab, Schwab, Shaver, Girard, Putnam and Whitehouse2006), from mid to late lactation, showed higher milk persistency and fat content when fed lipogenic diets (with high content of fat or soluble and high digestible fiber) than when fed glucogenic diets (with high content of starch or sugars). In fact, lipogenic diets do not stimulate insulin, thus encouraging the nutrient partitioning toward the mammary gland and activating the lipogenic gene expression at mammary gland level instead of favoring fat deposition in the adipose tissue (Bernard et al., Reference Bernard, Bonnet, Leroux, Shingfield and Chilliard2009; Bionaz et al., Reference Bionaz, Thering and Loor2012). Moreover, Shingfield et al. (Reference Shingfield, Bernard, Leroux and Chilliard2010) suggested that in goats the mammary gland mRNA and potential activity of lipoprotein lipase is not rate limiting for the uptake of long chain FAs. Therefore, when the amount of circulating FAs increases, because of lipid supplementation, the uptake of FAs by the mammary gland may also increase, leading to an increase of milk fat secretion.
An increase in average milk protein concentration (P < 0.05) and protein yield (P < 0.01) also occurred in the LIN group compared with CON group. This is in agreement with previous observations in goats supplemented with linseed or other fat supplements (Chilliard et al., Reference Chilliard, Ferlay, Rouel and Lamberet2003; Nudda et al., Reference Nudda, Battacone, Usai, Fancellu and Pulina2006; Martinez Marin et al., Reference Martinez Marin, Gómez-Cortés, Gómez Castro, Juárez, Pérez Alba, Pérez Hernández and de la Fuente2011) even if the mechanism involved in the positive responses of milk protein concentration to dietary extruded linseed supplementation is unknown. The MUN was noticeably lower (P < 0.01) in the LIN than in the CON group, as previously observed in dairy cows (Pezzi et al., Reference Pezzi, Giammarco, Vignola and Brogna2007). The effects of linseed supplementation on MUN and milk protein concentrations could be explained by a higher protein availability in the intestine in LIN goats than in CON goats. In fact, the LIN goats may have taken advantage of their higher protein supply (224 v. 178 g/kg DM of CP for extruded linseed and concentrate, respectively; Table 1), characterized by low rumen degradability because of both the extrusion treatment and the high lipid content of linseed (which can decrease fiber digestibility). In sheep, the supplementation of linseed oil at increasing doses (13, 26 or 40 ml/day) increased the duodenal flow of total N and bacterial N (Ikwuegbu and Sutton, Reference Ikwuegbu and Sutton1982). In addition, the defaunating action of FA (both as free FA or calcium salt of FA) on rumen protozoa, previously observed in rumen samples of goats (Matsumoto et al., Reference Matsumoto, Kobayashi, Takenaka and Itabashi1991), may have indirectly increased microbial protein availability in the intestine of LIN group.
Liver and kidney metabolic markers
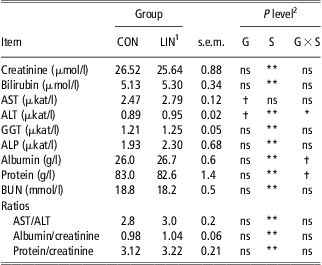
The serum concentration of markers of liver and kidney metabolism are reported in Table 3. The values observed in our trial were within the reference ranges of the biochemical parameters used for goats by the laboratory of Istituto Zooprofilattico Sperimentale per la Sardegna. The only exception was ALT, (0.89 and 0.95 μkat/l in CON and LIN, respectively) which exceeded the upper value of the interval (0.42 to 0.85 μkat/l). The GGT activity in serum did not differ between the LIN and CON groups, whereas AST and ALT tended to be higher (P < 0.10) in the LIN than in the CON group. A significant interaction between group and sampling date was observed for ALT because of an increase in its concentration between weeks 2 and 4 in the CON group. The tendency of transaminase activities (AST and ALT) to be higher in LIN could be partially related with the higher milk secretion and, consequently, a higher liver turnover metabolic rate in those animals. This is supported by the existence of positive (P < 0.01), even if weak, correlations observed between milk yield and the markers of hepatic functions, AST (r = 0.27), ALT (r = 0.46) and GGT (r = 0.45). An increase in blood transaminase activities as milk production increases has been previously documented in dairy cows by Boots and Ludwick (Reference Boots and Ludwick1970). The ALP concentration did not differ significantly between groups, even if the mean value for LIN was numerically higher than CON.
Metabolic markers of liver and kidney function in plasma of dairy goats fed diets with (LIN group) or without (CON group) addition of extruded linseed
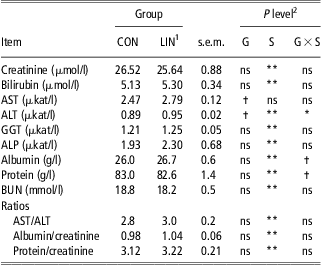
AST = aspartate transaminase; ALT = alanine transaminase; GGT = gamma glutamyl transpeptidase; ALP = alkaline phosphatase; BUN = blood urea nitrogen; s.e.m. = standard error of mean.
1LIN = extruded linseed added at 180 g of DM/day which supplied 70 g/day of linseed oil per head.
2G = effect of experimental group (control v. linseed), S = effect of sampling and G × S = effect of interaction; **P < 0.01; *P < 0.05; †P ⩽ 0.10; ns = non-significant (P > 0.10).
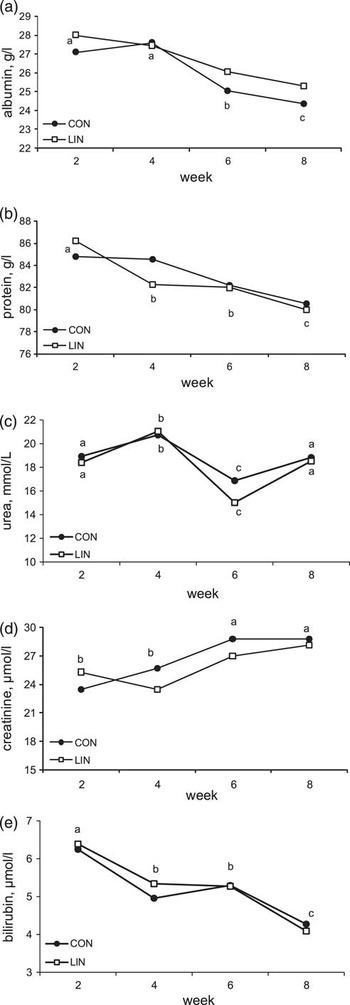
A lack of negative effects of the LIN diet on liver was also confirmed by the absence of alteration of the bilirubin concentration in serum in the LIN goats. Concentrations of creatinine, a conventional biomarker of kidney function, and of total protein and albumin were not influenced by treatments either. In addition, the albumin/creatinine and the protein/creatinine ratios were not influenced by diets, supporting the absence of clear effects of extruded linseed on kidney function. The interaction between group and sampling tended to be significant for albumin and protein.
Even if the BUN concentration did not change between groups, the MUN, which is more stable than BUN, was lower in the LIN than in the CON group. This suggests a higher efficiency in nitrogen use in LIN, which is also consistent with its higher milk protein concentration and yield. The correlation coefficients between BUN and MUN observed in both experimental groups (r = 0.46 for CON; r = 0.58 for LIN; P < 0.01) were lower compared with those reported previously in lactating goats (r = 0.76; Bava et al., Reference Bava, Rapetti, Crovetto, Tamburini, Sandrucci, Galassi and Succi2001).
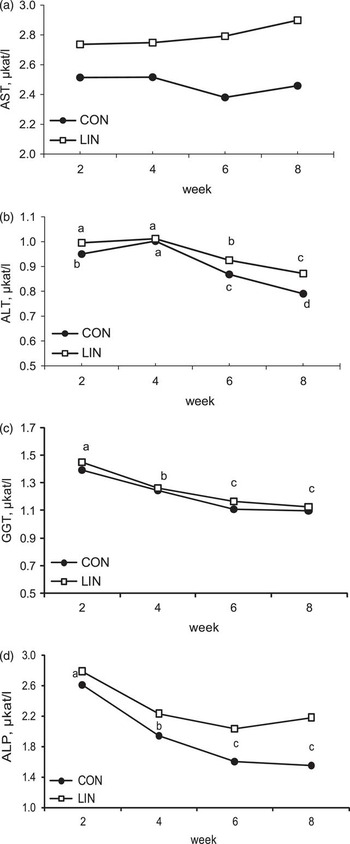
During the experimental period, all kidney and liver function biomarkers in serum changed (P < 0.01), except for AST (Table 3). In general, bilirubin, ALT, GGT, ALP, albumin and protein decreased, whereas creatinine increased over time. The serum AST did not change over time in either groups (P = 0.56; Figures 1 and 2).
Temporal evolution of aspartate transaminase (AST) (a), alanine transaminase (ALT) (b), gamma glutamyl transpeptidase (GGT) (c) and alkaline phosphatase (ALP) (d) in serum of dairy goats fed diets with (LIN) or without (CON) addition of extruded linseed (180 g of DM/day per head). For GGT and ALP, different letters indicate significant differences between weeks (P < 0.05). For ALT, different letters indicate significant differences between weeks within group (P < 0.05).

Temporal evolution of albumin (a), protein (b), blood urea nitrogen (c), creatinine (d) and bilirubin (e) in serum of dairy goats fed diets with (LIN) or without (CON) addition of extruded linseed (180 g of DM/day per head). Different letters indicate significant differences between weeks (P < 0.05).

The temporal decrease of ALT, GGT and ALP through sampling observed in both experimental groups (Figure 1b–d) followed the same pattern of the milk yield curve. The decrease in transaminase activity as lactation progressed agrees with previous observations in dairy cows (Boots and Ludwick, Reference Boots and Ludwick1970).
The temporal increase of creatinine throughout the trial (Figure 2c) occurred in both experimental groups. A marked increase of creatinine is usually associated with a decline in renal function. However, because creatinine concentration in blood is generated from muscle metabolism, its increase during lactation in the LIN and CON groups could be related to a normal muscle turnover in goats at medium-late lactation stage.
Albumin, total protein and bilirubin decreased progressively over time in both groups (Figure 2a, b, d), whereas BUN did not evidence a defined trend, likely reflecting nitrogen consumption while animals were on pasture.
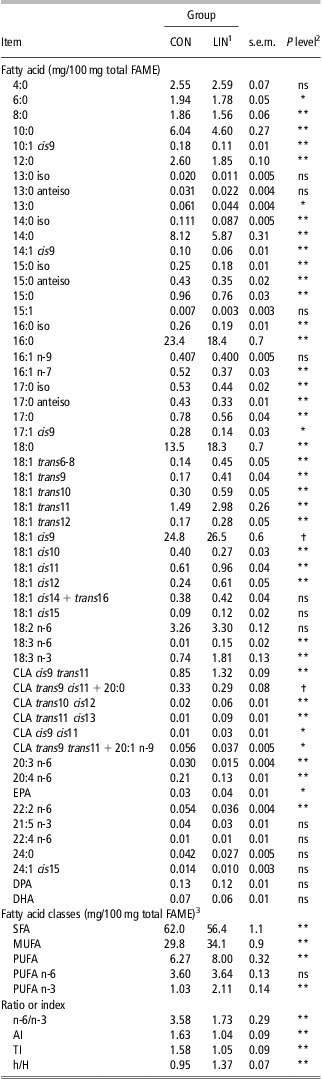
Milk FA profile
The mean concentrations of individual and classes of FA in bulk-milk fat were markedly influenced by lipid supplementation (Table 4), as extensively documented in previous experiments with goats (Nudda et al., Reference Nudda, Battacone, Usai, Fancellu and Pulina2006; Luna et al., Reference Luna, Bach, Juárez and de la Fuente2008; Bernard et al., Reference Bernard, Bonnet, Leroux, Shingfield and Chilliard2009). Milk from the LIN group had lower (P < 0.01) concentrations of short-chain FA (SCFA, −15.3%) and medium-chain FA (MCFA, −23.7%), odd-branched chain FA (OBCFA, −22.8%) and saturated FA (SFA, −9.1%), and higher (P < 0.01) proportions of long-chain FA (LCFA, +23.4%), monounsaturated FA (MUFA, +14.6%), PUFA (+27.6%) and PUFA n-3 family (+104.9%) than milk from the CON group. The lower SCFA and MCFA concentrations found in the LIN group could be explained by the inhibitory activity of LCFA on de novo synthesis of FA in the mammary gland. In terms of human health, the observed decrease of 12:0, 14:0 and 16:0 in milk of the LIN group (Table 4) indicates an improvement in milk FA profile, because of their potential raising effect on blood cholesterol (Tholstrup et al., Reference Tholstrup, Vessby and Sandstrom2003). In the 18-FA family, the concentration of 18:0 was higher (P < 0.01) in LIN than in CON group (+35.5%), and that of 18:1 cis9 tended to be higher (P < 0.10) in the LIN group (+7.1%). The amount of all identified trans 18:1 isomers increased (P < 0.01) because of the extruded linseed supplement, but their percentage in relation to the total trans 18:1 did not change. The proportion of vaccenic acid (18:1 trans11) and 18:1 trans10 was doubled by the supplementation. The value of 18:1 trans10 content was low and within the range of milk 18:1 trans10 concentrations (0 to 5.2 g/100 g FAs) that in goats are not related to milk fat depression (Shingfield et al., Reference Shingfield, Bernard, Leroux and Chilliard2010). The total CLA was increased (P < 0.01) by extruded linseed supplementation (+44.9%), with the isomer cis9 trans11 accounting for 67% and 72% of total CLA in CON and in LIN group, respectively. The observed increase (P < 0.01) in CLA cis9trans11 in the LIN group (+55.3%) was lower than that of our previous studies using half of the dose of linseed supplement used in this trial in both early-lactation (+178% compared with control; Nudda et al., Reference Nudda, Palmquist, Battacone, Fancellu, Rassu and Pulina2008) and mid-lactation (+67% compared with control; Nudda et al., Reference Nudda, Battacone, Usai, Fancellu and Pulina2006) non-grazing goats. The beneficial enhancement (P < 0.01) of the concentration of PUFA n-3 by linseed supplementation (+105%) observed in this experiment confirms previous findings in goats (Nudda et al., Reference Nudda, Battacone, Usai, Fancellu and Pulina2006; Luna et al., Reference Luna, Bach, Juárez and de la Fuente2008; Bernard et al., Reference Bernard, Bonnet, Leroux, Shingfield and Chilliard2009) and sheep (Manso et al., Reference Manso, Bodas, Vieira, Mantecón and Castro2011; Mele et al., Reference Mele, Contarini, Cercaci, Serra, Buccioni, Povolo, Conte, Funaro, Banni, Lercker and Secchiari2011). Such marked increase of PUFA n-3 in milk was related to the high concentration of ALA in the extruded linseed supplement (Tables 1 and 4). With regard to the very long chain PUFA n-3, the concentrations of docosapentaenoic acid (DPA) and docosahexaenoic acid (DHA) were not affected by diet, whereas that of eicosapentaenoic acid (EPA) was higher (P < 0.05) in LIN than in CON, even if its concentration was extremely low in both groups. Such low values are usually found in the milk of ruminants, because of the low elongation and desaturation of 18:0 and 20:0 FA in the mammary gland of these species (Gulati et al., Reference Gulati, McGrath, Wynn and Scott2003).
Fatty acid profile of bulk milk from dairy goats fed diets with (LIN group) or without (CON group) the addition of extruded linseed

FAME = fatty acid methyl esthers; CLA = conjugated linoleic acid; EPA =eicosapentaenoic acid; DPA = docosapentaenoic acid; DHA = docosahexaenoic acid; SFA = saturated fatty acids; MUFA = monounsatured fatty acids; PUFA = polyunsatured fatty acids; AI = atherogenic index; TI = thrombogenic index; h/H = hypocholesterolemic/hypercholesterolemic ratio; s.e.m. = standard error of mean.
1LIN = extruded linseed added at 180 g of DM/day which supplied 70 g/day of linseed oil per head.
2**P < 0.01; *P < 0.05; †P ⩽ 0.10; ns = non-significant (P > 0.10).
3SFA (sum of 4:0, 6:0, 8:0, 10:0, 12:0, 14:0, 15:0, 16:0, 17:0, 18:0, 22:0, 24:0 and odd-branched fatty acids); MUFA (sum of 14:1, ∑16:1, ∑17:1 and ∑18:1); PUFA (sum of total n-6, total n-3 and total isomers of CLA); PUFA n-3 = sum of 18:3n-3, 18:4n-3, 20:3n-3, 20:4n-3, 20:5n-3, 22:5n-3, 22:6n-3); PUFA n-6 = 18:3n-6, 20:2n-6, 20:3n-6, 20:4n-6, 22:2n-6, 22:4n-6.
The n-6/n-3 ratio was significantly lower (P < 0.01) in LIN than in CON group. Despite that, in both groups this index was under the value of 5, which is the nutritional value recommended for a healthy diet to reduce the risk of cardiovascular, inflammatory and autoimmune diseases and cancer, according to nutritional guidelines based on published literature (Simopoulos, Reference Simopoulos2002; Wijendran and Hayes, Reference Wijendran and Hayes2004). The AI and TI, which measure the extent of atherosclerosis and thrombosis risks, were lower (P < 0.01) and the h/H, an index of cholesterolemia, was higher (P < 0.01) in LIN than in CON group. Because these parameters are commonly used as indices of dietary fat quality, their pattern in the LIN group suggests a better fat quality of the milk produced by goats supplemented with extruded linseed. However, the predictive ability of these nutritional indexes needs to be enhanced, by using new formulas which take into account other FAs (e.g. CLA and VA), considering that Pintus et al. (Reference Pintus, Murru, Carta, Cordeddu, Batetta, Accossu, Pistis, Uda, Elena Ghiani, Mele, Secchiari, Almerighi, Pintus and Banni2012) have recently reported a negative association between CLA in the diet and blood cholesterol level in humans.
Conclusions
This study evidenced that linseed fat supplementation for 2 months improved milk performance, without effecting the general liver and kidney function in mid-lactating dairy goats grazing on natural pasture. However, further studies with a longer fat-supplementation period are necessary to corroborate the lack of influence of this supplement on animal metabolism.
The reduction of MUN in the group supplemented with linseed was an interesting finding which could be better understood by additional studies on linseed fat effects on protein metabolism in lactating goats. Finally, this study confirmed the role of extruded linseed supplementation in the improvement of the nutritional profile of milk FAs, by increasing the vaccenic acid, CLA cis9 trans and 18:3 n-3 concentrations and by improving the indexes used as markers of dietary fat quality.
Acknowledgments
The authors thank the following members of the Dipartimento di Agraria of the University of Sassari: Ana Helena Dias Francesconi for reviewing and editing the manuscript, and Antonio Mazza for giving technical assistance during the experiment. The authors are grateful to the anonymous referees for their critical comments and useful suggestions.