


Electoral campaigns are a defining feature of democratic polities. Yet scholarship on electoral campaigns, particularly on the content of campaign communications, remains disjointed. The field has not changed very much since Riker's (Reference Riker, Calvert, Mueller and Wilson1996, 4) description over a decade ago: “we have very little knowledge about the rhetorical content of campaigns, which is, however, their principal feature . . . the fact remains that we know very little about what to say in campaigns—but this is what both political scientists and candidates want to know.” Shortcomings are particularly acute in the United States for nonpresidential campaigns. “From reading our literature,” notes Perloff (Reference Perloff, Dillard and Pfau2002, 621), “you would assume that the only campaigns in America are for the presidency.”
In what follows, we advance research on campaigns, focusing on communication in U.S. congressional campaigns. We begin by offering a framework for studying campaign communication that integrates and extends prior work. The analysis focuses on the extent to which candidates take risks or play it safe in their campaign strategies. We test expectations from the framework with new data based on candidate Web sites over time, which offer an unmediated, holistic, and representative portrait of campaigns. The view from these data significantly differs from that of previous studies that rely on advertising and newspaper stories to study candidate behavior. Our efforts provide researchers with a foundation for moving toward a more complete understanding of congressional campaigns.
CONGRESSIONAL CAMPAIGN RHETORICAL STRATEGY
In many ways, the literature on congressional campaigns is progressive and wide-ranging. Scholars devote considerable attention to distinct topics, such as going negative, issue ownership, and position-taking (Franklin Reference Franklin1991; Lau and Pomper Reference Lau and Pomper2004; Petrocik Reference Petrocik1996). They also have identified important determinants of campaign strategy—most notably, showing how competition and incumbency influence rhetorical choices (Kahn and Kenney Reference Kahn and Kenney1999; Trent and Friedenberg Reference Trent and Friedenberg2008). We aim to bring these various strands of the literature together (e.g., work on negativity and issue ownership) while also generating additional insights into campaigns’ rhetorical choices. We start with a set of widely agreed-upon premises about congressional campaign behavior, from which we deduce empirical predictions.
First, a primary purpose of campaign rhetoric is to establish the criteria on which voters base their decisions. Campaigns attempt to do this by emphasizing or highlighting their preferred criteria. Evidence on this point comes from an array of literatures, including work on priming (Miller and Krosnick Reference Miller, Krosnick, Mutz, Sniderman and Brody1996), issue ownership (Petrocik Reference Petrocik1996), heresthetics (Riker Reference Riker, Calvert, Mueller and Wilson1996), campaigns (Berelson, Lazarsfeld, and McPhee Reference Berelson, Lazarsfeld and McPhee1954; Schattschneider Reference Schattschneider1960), and political polling (Druckman, Jacobs, and Ostermeier Reference Druckman, Jacobs and Ostermeier2004; Jacobs and Shapiro Reference Jacobs and Shapiro1994). Second, when it comes to congressional elections, voters tend to base their decisions on incumbency, issues, candidates’ personal features, and/or party (Druckman Reference Druckman2004; Niemi and Weisberg Reference Niemi and Weisberg1993, 99; Rahn et al. Reference Rahn, Aldrich, Borgida, Sullivan, Ferejohn and Kuklinki1990). It follows from these two premises that campaigns will emphasize incumbency, issues, personal features, and/or partisanship, depending on which of these criteria they wish voters to use.
Third, half a century of voting research shows that voters pay scant attention to campaign rhetoric, and base their decisions on a subset of accessible considerations (Iyengar and Kinder Reference Iyengar and Kinder1987; Kinder Reference Kinder, Gilbert, Fiske and Lindzey1998; Zaller Reference Zaller1992). Fourth, in congressional elections, incumbency serves as a highly accessible basis of vote choice; all else constant, voters favor incumbents (Gronke Reference Gronke2000, 140–41). This manifests itself in the well-known benefit from incumbency that provides incumbents with up to a 10-percentage-point advantage (Abramowitz, Alexander, and Gunning Reference Abramowitz, Alexander and Gunning2006; Ansolabehere and Snyder Reference Ansolabehere and Snyder2004, 487). The incumbency advantage stems, in part, from three particular candidate characteristics: voters find incumbents appealing because they possess experience in office, are familiar (e.g., have ties to the district), and have provided benefits for the district or state (e.g., organizing events concerning a local issue, casework, pork-barrel projects) (e.g., Fiorina Reference Fiorina1989; Gronke Reference Gronke2000; Jacobson Reference Jacobson2004). These assumptions imply that incumbents will emphasize experience, familiarity, and benefits, and that candidates who are not advantaged—i.e. challengers—have an incentive to (a) induce voters to attend to rhetoric and (b) use the rhetoric to cause voters to base their decisions on criteria other than incumbency.
Our final premise concerns ways in which candidates motivate voters to attend to rhetoric. One well-known approach is to employ negative language (i.e., “go negative”). Evidence on the attention-grabbing nature of negativity comes from political psychology research (Druckman and McDermott Reference Druckman and McDermott2008; Marcus, Newman, and MacKuen Reference Marcus, Neuman and MacKuen2000), as well as a long line of work in psychology showing that individuals pay more attention and give more weight to negative than to positive information (e.g., people attend more when told of 5% unemployment than when told of 95% employment) (Baumeister et al. Reference Baumeister, Bratslavsky, Fickenauer and Vohs2001; Wason Reference Wason1959).Footnote 1 Another way to stimulate attention that has become relevant in recent years is to engage voters by using new media technologies (Bucy Reference Bucy2004). This includes, for example, allowing Web site visitors to adjust content and/or interpersonally communicate with the campaign and/or other voters (e.g., message boards, forums, live chats, interactive blogs). Just as with negativity, extant research shows that allowing interaction stimulates attention and information-seeking behavior (e.g., Southwell and Lee Reference Southwell and Lee2004, 645).
From these premises, we deduce a set of predictions. First, compared to incumbents, challengers will employ significantly more negative rhetoric and provide more opportunities for voters to engage with the campaign (i.e., through interactive Internet technologies). The goal is to induce voters to attend to new information (also see Kahn and Kenney Reference Kahn and Kenney1999, Reference Kahn and Kenney2004). Second, compared to incumbents, challengers will put significantly more emphasis on issues, personal features, and party affiliation. They will do so in an attempt to shift voters’ focus away from incumbency towards alternative criteria (see, e.g., Groseclose Reference Groseclose2001). Issue strategies include emphasizing or priming issues that advantage the candidate (e.g., issues “owned” by the candidate's party), stating unambiguous issue positions that enable voters to evaluate the candidate, and publicizing endorsements from policy-oriented groups that voters can use as issue shortcuts (Downs Reference Downs1957; Lupia and McCubbins Reference Lupia and McCubbins1998; Sniderman, Brody, and Tetlock Reference Sniderman, Brody and Tetlock1991, 93–120). Strategies focusing on personal features include discussing leadership, competence, and empathy (e.g., Fenno Reference Fenno1978; Funk Reference Funk1999; Kinder Reference Kinder, Lau and Sears1986), as well as making reference to polls that demonstrate the candidate's viability and standing in the public's eyes (Lau and Redlawsk Reference Lau and Redlawsk2006).
Our third hypothesis is that, compared to challengers, incumbents will put significantly more emphasis on experience in public office, familiarity, and providing district or state benefits; as mentioned, these factors underlie the incumbent's advantage. A caveat to this prediction is that safe incumbents have little incentive to campaign actively. Incumbents enjoy an inherent advantage and, all else constant, prefer that voters do not pay attention to campaign rhetoric. In noncompetitive races—where voters often ignore the campaign (e.g., Kahn and Kenney Reference Kahn and Kenney1999, 182–83)—safe incumbents will opt to be silent on the campaign trail, refusing to engage in active advocacy (for fear of appearing insecure about the campaign) (Jacobson Reference Jacobson2004, 97; Trent and Friedenberg Reference Trent and Friedenberg2008, 100). In this case, incumbents will not necessarily put more emphasis than challengers on incumbency factors. As a campaign becomes increasingly competitive, however, incumbents have little choice but to enter the fray and increase the relative emphasis on their advantages, particularly aspects of incumbency.
Our predictions echo extant work by identifying incumbency–challenger status as a critical determinant of campaign behavior over a range of strategies (Jacobson Reference Jacobson2004, 91–98; Latimer Reference Latimer2007; Trent and Friedenberg Reference Trent and Friedenberg2008; 86–118) with competition playing a moderating role (Kahn and Kenney Reference Kahn and Kenney1999; 93–97).Footnote 2 As will soon be clear, our predictions also extend to a broad range of strategies that either are treated within distinct frameworks (e.g., going negative and issue ownership) or are not widely studied (e.g., the use of polls, endorsements, partisanship, personal feature emphasis, aspects of incumbency) (Lin Reference Lin and Kaid2004).
Moreover, there is an underlying dynamic that we believe ties our predictions together. The distinction between incumbent and challenger strategies amounts to variation in risk-taking (also see, e.g., Kahn and Kenney Reference Kahn and Kenney1999, 75–76; Lau and Pomper Reference Lau and Pomper2004, 31–32). Challenger strategies have less certain, higher variance outcomes. For example, going negative—which challengers do to stimulate attention—entails some risk; many voters disdain negativity (Geer Reference Geer2006, 1–2; Mark Reference Mark2006) and its effect remains “uncertain” (Lau and Pomper Reference Lau and Pomper2004, 74). Similarly, utilizing interactive Web technologies introduces substantial risk because candidates lose message control, with users choosing what to view (Chadwick Reference Chadwick2006, 8; Eveland and Dunwoody Reference Eveland and Dunwoody2002).
Risk dynamics also exist with the content of messages. Incumbents emphasize qualities—experience, familiarity, and district benefits—that most voters favor, and that very likely benefit incumbents. Challengers, in contrast, highlight criteria that may or may not advantage them. For example, offering precise issue positions may alienate some voters (Page Reference Page1978), providing endorsements can backfire (Lupia and McCubbins Reference Lupia and McCubbins1998, 60–61), and introducing personal features may, in the end, favor the incumbent (e.g., discussing leadership). Similarly, partisan emphasis could sway, alienate, or have no effect on leaners, whereas emphasizing partisan-owned issues could shape vote preferences, have no impact, or even deter voters who care about other issues (such as leaners or voters from the other party). In sum, risk constitutes a latent factor that links our predictions—challengers who must overcome the incumbency hurdle engage in significantly more risky behavior. This portrayal coheres with McDermott, Fowler, and Smirnov's (Reference McDermott, Fowler and Smirnov2008, 346) evolutionary theory of decision making that posits that “when political . . . survival is threatened, [politicians] appear much more likely to engage in risky actions. . . .” It also provides a generalizable portrait of behavior, one that we will empirically explore in what follows.
USING CANDIDATE WEB SITES TO STUDY CAMPAIGN STRATEGY
A central challenge for work on campaigns concerns the identification of an appropriate source of data. Lau and Pomper (Reference Lau and Pomper2004, 133–34) explain, “Campaigns are not simple, in practice or analysis . . . data—in particular, on the nature of the campaign itself—are much harder to come by” (also see Lipinski Reference Lipinski2004, 9; Simon Reference Simon2002, 94). Ideally, the data should be unmediated (i.e., directly from the campaign), complete (i.e., covering a full range of rhetorical strategies), and representative of the population of campaigns.
We submit that candidate campaign Web sites uniquely meet these criteria. First, Web sites are unmediated. Even when a campaign hires a consulting firm to help construct its Web site, it is the campaign that determines the site's content (Ireland and Nash Reference Ireland and Nash2001, 60–61). This contrasts with news media coverage of campaigns (e.g., newspapers), on which some prior work relies (e.g., Lau and Pomper Reference Lau and Pomper2004; Sigelman and Buell Reference Sigelman and Buell2003). Lipinski (Reference Lipinski2004, 10) explains, candidates’ “abilities to communicate through the mass media vary significantly [depending on] relations with local journalists. . . . Therefore any analysis of media coverage will not provide an accurate measure of the messages that [candidates] are attempting to communicate. Because of the problems associated with studying mediated communication, it is essential to examine direct methods. . . .”
Second, Web sites offer as holistic or complete a portrait of campaign strategy as is available. A “campaign goes well beyond its televised political advertisements. . . . Candidates engage in many activities—they give speeches, conduct rallies, distribute literature, and meet with local opinion leaders, editors, and other elites to seek endorsements (Shaw Reference Shaw1999). . . . To examine the effects of the campaign more broadly, we need a more comprehensive view beyond political advertisements” (Lau and Pomper Reference Lau and Pomper2004, 134). On their Web sites, campaigns can post copious information, including copies of advertisements, speeches, or other material (Ireland and Nash Reference Ireland and Nash2001, 60–61). As a result, a campaign Web site potentially captures the aggregation of campaign communications that reflect a campaign's overall rhetorical strategy. This differs from speeches or television advertisements that require candidates to choose brief snippets of their overall message; candidates cannot possibly incorporate the full range of their rhetorical strategies (e.g., references to endorsements, polls, various issues, personal features).Footnote 3
Third, virtually all congressional campaigns launch Web sites, which are critical for capturing a representative sample of the population of congressional campaigns. In contrast, many House candidates and some noncompetitive Senate candidates fail to produce television advertisements (Goldstein and Rivlin Reference Goldstein and Rivlin2005, 16; Kahn and Kenney Reference Kahn and Kenney1999, 34).Footnote 4 Similarly, major newspapers spend little time covering House races and noncompetitive Senate races. As a result, studies that rely on advertisements or media coverage use biased samples that often exclude House campaigns and less competitive (or less well-funded) Senate races. In the next section, we empirically demonstrate just how biased advertisement and newspaper coverage is, relative to Web sites.Footnote 5
To assess the validity of our claim that Web sites capture the aggregation of campaign communication aimed at voters in general (e.g., the median voter), we conducted a survey of individuals involved in the design of congressional campaign Web sites during the 2008 campaign (N = 137). We provide details of the survey in Appendix A. Here we focus on the most telling results, many of which are consistent with what Stromer-Galley et al. (Reference Stromer-Galley, Howard, Schneider and Foot2003) report from a similar survey in 2002–3.
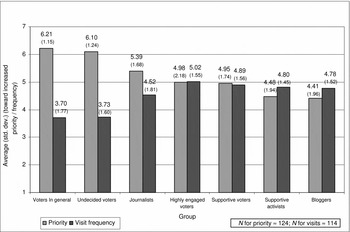
We asked site designers to rate the priority of several groups of voters as Web site target audiences; we measured this on a seven-point scale with higher scores indicating increased priority. Respondents also rated their perception of how often an average member of each group visited the site, on a seven-point scale with higher scores indicating more frequent visits. The results, which we present in Figure 1, show that those involved in the creation of the sites view “voters in general” and “undecided voters” as the primary target audiences. These two groups register significantly higher priority scores than all other groups (e.g., comparing “undecided voters” to “journalists,” gives t 123 = 3.86, p < .01 for a two-tailed test). This matches Stromer-Galley et al.'s (Reference Stromer-Galley, Howard, Schneider and Foot2003) aforementioned survey, which also finds that “undecided voters” were the top-rated audience.
Web Site Visitor Priority and Visit Frequency

Interestingly, the respondents also recognize that “voters in general” and “undecided voters” visit less frequently than all other groups. Instead, they believe “highly engaged voters” access the site most often (also see Democracy Online Project 1999), even though these voters are not the primary target of the site (e.g., comparing the frequency question for “highly engaged voters” to “undecided voters” gives t 112 = 8.97, p < .01 for a two-tailed test). This accentuates the importance of not confounding the frequency with which particular voters visit Web sites with the intentions of those designing the sites (e.g., certain groups may be more important even if they visit less often) (cf. Trent and Friedenberg Reference Trent and Friedenberg2008, 402–4). And it is the intent of the designers that is critical to us, as a window into campaign strategy.Footnote 6 In Appendix A, we describe additional survey results that also strongly suggest that Web sites are aimed at general voters (e.g., the designers view Web sites as more representative of the “entire campaign” than any other form of communication).
For a final piece of confirmatory evidence, we compared the tone of the rhetoric (i.e., negativity) on Web sites with that found in television advertisements and newspaper coverage. Although these latter two media contain limited and mediated content, respectively, we expect the general tone of the campaign—that is, negativity—to be correlated across media (e.g., although television advertisements cannot contain nearly the range of messages found on a Web site, they can be classified as negative in general tone or not). We report details, including the results, in Appendix B. The main point is that we find significant correlation in general tone across these communication channels, suggesting that Web sites capture the general rhetorical thrust of the campaign, while providing a near limitless opportunity for a campaign to directly include any information it deems relevant.
All of this evidence supports the claim that Web sites offer a valid measure of campaign strategy; they provide an unmediated, holistic, and representative portrait of messages aimed at voters in general. We now turn to a description of our data collection and approach to measurement.
WEB SITE DATA COLLECTION
Our Web site data cover three election cycles, starting in 2002, a year in which Web sites first became “a critical part of any candidate's strategy” (Chinni Reference Chinni2002, 1). In each year—2002, 2004, and 2006—we identified the universe of major party (Democrat and Republican) House and Senate candidates using the National Journal, Congressional Quarterly, and various state party home pages.Footnote 7 We included the universe of Senate candidates and then selected a systematic random sample of approximately 20% of House races, stratified by state and district to ensure regional diversity in the sample. We searched for all of the Web sites in our sample by following links from the National Journal's Web site (www.nationaljournal.com) and using search engines such as Google (www.google.com). We carefully identified candidates’ personal campaign Web sites, excluding official congressional Web sites and Web sites sponsored by other groups or individuals.
We successfully identified nearly all Senate candidate Web sites and more than 95% of House sites in our sample. The few cases where the candidates did not launch Web sites came largely from earlier year races where the candidates had no or very weak (e.g., inexperienced, low-funded) opponents. Our sample consisted of a total of 736 Web sites, with 26% coming from the Senate and 74% coming from the House.Footnote 8 Not surprisingly—given our sampling approach—our sites accurately reflect the universe of campaigns, albeit with a slight overrepresentation of competitive races.Footnote 9
Candidates Lacking Television Advertisements and News Coverage, 2002–2004

To evaluate the biasness of other approaches, we identified the candidates in our sample who produced advertisements in 2002 and 2004 (relying on the Wisconsin Advertising Project, which is fully available only for these yearsFootnote 10) and who received coverage in major newspapers in these same years. For the newspapers, we identified relevant newspapers and then searched for pertinent campaign articles that mentioned either candidate (from Labor Day until Election Day) (Lau and Pomper Reference Lau and Pomper2004; Sigelman and Buell Reference Sigelman and Buell2003).Footnote 11 We identified campaigns for which there were at least 16 articles, in accordance with Lau and Pomper's (Reference Lau and Pomper2004, 135) minimal standard for capturing campaign content. The total possible number of candidates producing television advertisements is 444, because that is the number in our sample for 2002–4; for the newspaper articles, the maximum number is 387, because we failed to identify electronically available newspapers from eight races.Footnote 12
Dependent Measures

a Data collected only in 2004 and 2006.
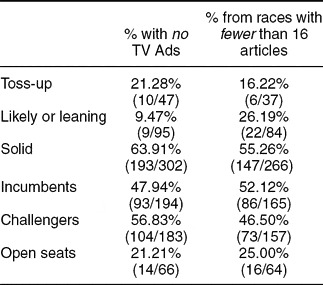
We find that nearly half of our sample would be missing if we relied on television advertisements or newspaper articles. Specifically, 47.75% (212/444) of the campaigns in our sample did not produce even a single television advertisement, and 45.22% (175/387) participated in races that did not generate the minimal standard of 16 news articles. Moreover, samples relying on these data display systematic biases. Table 1 reports the percentage of candidates who did not produce an advertisement and failed to participate in a minimally covered race, broken down by competitiveness (based on Cook's ratings; see note 9) and candidate status. Clearly, a disproportionate number of candidates without advertisements or sufficient news coverage come from the least competitive (i.e., “solid”) races—64% and 55% of candidates from these races lack advertisements and sufficient news coverage, respectively. Interestingly, however, a nontrivial number of candidates from even the most competitive races would be absent from a data set relying on advertisements or news coverage (21% and 16%, respectively). The bottom part of the table shows that only 21% and 25% of open seat candidates lack advertisements or coverage, compared to roughly 50% of incumbents and challengers; this suggests a relative overrepresentation of open seat candidates.Footnote 13 These results further accentuate the advantages of using Web sites to measure campaign strategy—unlike other approaches, we can generalize beyond highly competitive races and include a representative sample of House, and not just Senate campaigns.
Web Site Measures
To analyze the Web sites each year, we assembled teams of student coders. All coders participated in a detailed training session before being randomly assigned sets of candidate Web sites. We conducted all coding in the 10 days preceding Election Day. However, we also tracked a small sample of Web sites from after Labor Day until Election Day and found little evidence of changes that would have significantly altered our coding (i.e., changes usually concerned items such as the candidate's schedule). For the years in our sample, we thus believe that our coding approach successfully captured campaign strategy.
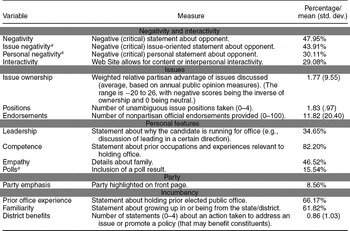
To measure our dependent variables, coders examined the front page, the page(s) devoted to fundraising, the page(s) devoted to issues, the page(s) devoted to biographical information, and any other “major” page (e.g., with a link from the front page; this included newsroom and media pages). In practice, this amounted to coding the entire self-contained site (coders did not follow links to other Web sites). We describe our specific variables for each hypothesis in Table 2.
Our first prediction states that, compared to incumbents, challengers will go negative more often and provide more opportunities for voters to engage with the campaign. We measure the latter concept by distinguishing Web sites that allow some form of interaction—regarding content or interpersonal communication—from those that do not.Footnote 14 To measure negativity, we follow Geer's (Reference Geer2006, 23) depiction of it as “any criticism leveled by one candidate against another during a campaign” (also see Buell and Sigelman Reference Buell and Sigelman2008). We used a dichotomous variable indicating whether a candidate included material on the site that was negative or critical of his or her opponent (in tone or explicitly). We opted for a dichotomous measure, rather than a count across the entire Web site, for two reasons. First, on a particular page, we found it difficult to reliably count the number of negative statements (when does a negative statement end and another one begin?). Second, using a subsample of 41 sites, we counted the number of distinct pages (e.g., the front page, personal page, issue page) that included negativity. We found very little variance, such that most candidates who went negative on their sites did so twice (most typically, on the front page and issues page). Not surprisingly, then, we find virtually identical results when using this count or employing our simpler and more reliable dichotomous indicator across the entire site.Footnote 15
In 2004 and 2006, we also coded each site for whether the negativity focused exclusively on issues (e.g., “my opponent has a bad record on taxes”), exclusively on the person (e.g., “my opponent is not trustworthy”), or on both issues and the person (e.g., Geer Reference Geer2006; Kahn and Kenney Reference Kahn and Kenney1999; Lau and Pomper Reference Lau and Pomper2004). These distinctions enable us to assess whether our prediction holds across types of negativity.
Operationalizing our second hypothesis requires measuring the aforementioned issue, personal features, and partisan variables. To capture candidate emphasis on advantageous issues, we build on issue ownership theory, which suggests that candidates benefit from highlighting issues on which their party is preferred (e.g., a focus on the environment favors Democrats whereas a focus on homeland security favors Republicans). We collected data from multiple polls on the public's perception of which party owned a host of policy issues (Hayes Reference Hayes2005, 910; Petrocik Reference Petrocik1996, 832).Footnote 16 We then computed, for each candidate, the weighted partisan advantage (according to public opinion) of the issues emphasized on their front page, biography page, and/or issues page.Footnote 17 The scores range from –20 to 26, with positive numbers indicating increased ownership of the emphasized issues by the candidate's party and negative scores the inverse. We operationalize position taking by summing the number of unambiguous issue positions (where a counter position is easily identified) offered by the candidate on the front page or issues part of the site (up to four, which captures most variation among candidates). We also counted the number of official endorsements (e.g., from the AFL-CIO, farmer groups, teachers, Right to Life, NRA, NOW, Sierra Club) anywhere on the site (up to 100).Footnote 18
Previous research offers less guidance on how to reliably measure personal feature rhetoric, leading us to develop plausible proxies. For leadership, we coded whether the candidate included a statement (on the front page or biography pages) explaining why he or she was running for office. These statements invariably invoke the desire to make a difference and help lead in a certain direction. For competence, we coded for discussion of prior relevant occupations and experiences. We measured empathy with whether the candidate offered details of his or her family. Although this last variable is fairly indirect, we suspect that candidates include this type of information in the hope of portraying themselves as “down to earth” people who are in touch with the concerns of typical families. We coded whether a candidate included poll data, which in every case demonstrated the candidate's good standing in the race. (We did not collect poll data in 2002.)Footnote 19 Finally, for party emphasis, we measured whether the candidate highlighted his or her party on the front page (i.e., in the banner at the top of the front page).
To test our incumbency hypothesis, we measured the three aforementioned incumbency features—experience in office, familiarity, and the provision of district or state benefits (which we hereafter call “district benefits”) (Jacobson Reference Jacobson2004). We used dichotomous measures to indicate whether the candidate discussed, on the front page or biography pages, having held any public office and whether he or she accentuated ties to the district/state by mentioning having grown up or lived much of his or her life in the area (thereby displaying familiarity). To measure district benefits, we summed (up to four) the number of candidate statements about an action taken that potentially benefited the constituents; examples include obtaining something for the district, organizing events or introducing legislation concerning a local issue, and meeting or working with other politicians to discuss a locally relevant issue.
To assess coding reliability, we randomly sampled approximately 30% of the Web sites and had one of two reliability coders code these sites. Specific reliability statistics are available from the authors; for all the variables used in the analyses below, we find high levels of reliability, nearly always exceeding the .80 threshold, correcting for chance agreement (Neuendorf Reference Neuendorf2002, 143; Riffe, Lacy, and Fico Reference Riffe, Lacy and Fico1998, 131).
RESULTS
Our hypotheses involve two key explanatory variables: candidate status and competition. We use dichotomous variables to distinguish challengers, incumbents, and open seat candidates. As mentioned, for competitiveness, we use Cook's ratings to classify races as 0 = solid Democratic or Republican, .33 = likely Democratic or Republican, .67 = leaning Democratic or Republican, or 1 = toss-up. Scholars commonly rely on Cook scores because they have the virtue of being exogenous to the races themselves (e.g., Goldstein and Freedman Reference Goldstein and Freedman2002; Gronke Reference Gronke2000, 100–101; Sulkin Reference Sulkin2001).Footnote 20
Candidate status and competitiveness correlate with a number of other variables shown to affect campaign behavior. Testing our hypotheses, therefore, requires the inclusion of control variables including year, office (Senate or House), party, gender, funds raised, front-runner status, and district/state partisanship. Moreover, a few of our particular measures require additional controls, such as the holding of any prior office for the incumbency measures (e.g., challengers who never held prior office cannot talk about their experiences doing so) and issue salience for the issue ownership measure (e.g., candidates might emphasize salient issues). We describe all of the control measures in Appendix C.
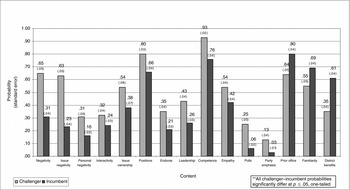
We test our first three hypotheses by regressing each dependent variable on candidate status, competition, and the controls. We display the regressions in Appendix D, where interested readers can assess the impact of the control variables. We focus here on the impact of candidate status across the dependent measures. Specifically, we use regressions akin to those in Appendix D to generate the predicted probability that an average challenger will engage in a given behavior and the predicted probability that an average incumbent will do so.Footnote 21 (For interval-level dependent variables, we focus—for presentational reasons—on the probability of being above the mean value, such as citing more than the mean number of district benefits.) We set all other variables to their mean values.
We present the results in Figure 2. They show that, in every case, there are statistically significant and substantively meaningful differences between challengers and incumbents. For example, the probability of the average challenger going negative is .65, which is dramatically higher than the incumbent likelihood of .31 (also see Druckman, Kifer, and Parkman n.d.). This same dynamic holds for both issue and personal negativity. It also occurs with Web site interactivity, with the likelihood of an average challenger employing some form of interactivity being .32, compared to .24 for the average incumbent. Even more impressively, challengers exhibit significantly greater likelihood of emphasizing every issue, personal feature, and party measure. It is striking, then, that the probabilities completely shift when it comes to the incumbency behavior of prior office experience, familiarity, and district benefits. The substantive differences range from .40 in the case of issue negativity to .10 in the case of party emphasis. Across all behaviors, the average difference probability for engaging in a behavior is .18 (std. dev. .09). This means that, all else constant, incumbents and challengers differ in their likelihood of employing different rhetorical strategies by 18% on average. The results not only constitute the first empirical confirmation for many of the individual measures (e.g., even the issue ownership literature had yet to explore variance in claims of ownership), but also, when taken together, reveal fundamental alternative approaches to campaigning.Footnote 22
Candidate Status and Campaign Content

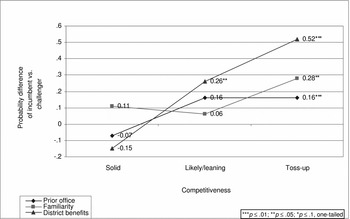
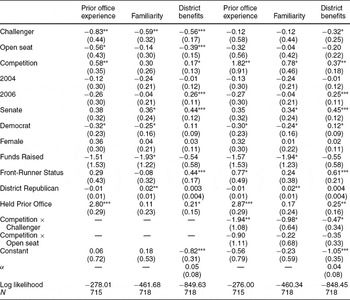
We test our next hypothesis—that incumbents place greater relative emphasis on incumbency factors as the race becomes increasingly competitive—by adding interactions between competitiveness and the candidate status variables to the incumbency regressions (again available in Appendix D). We then generate relative probabilities (i.e., incumbency probability – challenger probability) of engaging in each type of incumbency strategy for noncompetitive (solid), moderately competitive (likely/leaning), and highly competitive (toss-up) races.Footnote 23 We display the results in Figure 3, with the asterisks indicating significant differences between incumbents and challengers for the given competitiveness level. As expected, incumbents differ significantly from challengers in their likelihood of emphasizing aspects of incumbency only as the race becomes more competitive. For example, in the least competitive races, incumbents do not place significantly more emphasis than challengers on any of the variables; in fact, they put less weight on prior office and district benefits (although the differences are not significant). In contrast, in the most competitive races, we see that the incumbents are respectively 52%, 28%, and 16% more likely to highlight district benefits, familiarity, and prior office than challengers (all significant differences).
Relative Probability of Incumbent Behavior

We also coded for whether the candidate provided a campaign event schedule on his or her Web site. Consistent with the results, just reported, we find the relative likelihood of incumbents posting a schedule increases as the race becomes more competitive (i.e., in less competitive races, they are less likely to actively campaign). Specifically, incumbents are approximately 18% less likely than challengers to post a schedule in noncompetitive and leaning/likely races, but only 10% less likely in the competitive races (which is a significant change). These incumbency results support the notion that incumbents operate in two distinct political universes, depending on the competitive nature of the race. Importantly, when we explore interactions between competitiveness and candidate status for the other (challenger) behaviors, we find significance in only two cases (i.e., negativity and issue ownership).Footnote 24 This suggests that, unlike incumbents, challengers’ strategies do not substantially change based on competitiveness.
Challengers as Risk TakersFootnote 25
We previously explained that risk-taking constitutes a latent factor distinguishing challengers’ and incumbents’ strategies. Challengers employ tactics with uncertain consequences (e.g., will negativity alienate? will partisanship resonate?) whereas incumbents enjoy more certainty (e.g., nearly all voters prefer district ties, benefits, office experience). We operationalize this argument by aggregating the strategies we have explored into a single risk-taking measure. For each candidate, we summed the number of risky (“challenger”) strategies, and from that sum, subtracted the use of any of the safe (“incumbent”) strategies.Footnote 26 (We exclude issue and personal negativity as well as polling because we do not have data on these variables for 2002.) The result is a count variable ranging from −3 to 8, with higher scores indicating an increased tendency toward risk. The average is 2.28 (std dev. 2.15). In Table 3, we present results from regressing the measure on the key explanatory factors (see Appendix C for details on the independent variables).Footnote 27
Risk-Taking

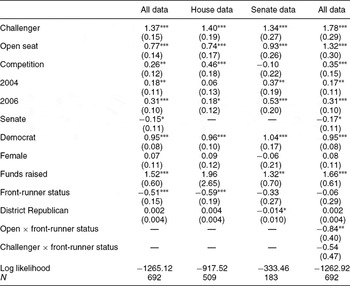
Note: The dependent variable is our index of risk-taking behavior, ranging from −3 to 8. Entries are ordered probit coefficients with standard errors in parentheses. ***p ≤ .01; **p ≤ .05; *p ≤ .10 for one-tailed tests. The coefficients and standard errors for τ1 through τ11 are as follows (reading across the table): for model 1, −2.21 (0.33), −1.45 (0.28), −0.55 (0.26), 0.16 (0.25), 0.87 (0.25), 1.48 (0.26), 2.17 (0.26), 2.69 (0.27), 3.37 (0.28), 4.03 (0.30), 4.77 (0.35); for model 2, −2.14 (0.36), −1.43 (0.32), −0.58 (0.30), 0.10 (0.30), 0.82 (0.29), 1.53 (0.30), 2.20 (0.30), 2.72 (0.31), 3.45 (0.33), 4.11 (0.35), 5.00 (0.43); for model 3, −2.35 (0.70), −1.10 (0.62), −0.28 (0.61), 0.43 (0.61), 0.83 (0.61), 1.57 (0.62), 2.14 (0.63), 2.74 (0.64), 3.41 (0.66), 3.93 (0.71); for model 4, −1.78 (0.41), −1.03 (0.37), −0.12 (0.36), 0.58 (0.36), 1.29, (0.36), 1.91 (0.36), 2.60 (0.36), 3.12 (0.37), 3.81 (0.38), 4.47 (0.39), 5.21 (0.43).
The first column of Table 3 confirms our central prediction—challengers engage in significantly more risky behavior than incumbents. Substantively, the average challenger undertakes 3.32 (standard error: 0.13) risky behaviors, whereas the average incumbent employs 1.23 (0.13).Footnote 28 The results also reveal the importance of competition, with the significance both of our competition variable and of the funds raised measure (e.g., fund raising increases in close races). Not surprisingly, front-runners avoid risk—they have no need to take chances. Risky behavior also increases with open seat candidates and Democrats (who were largely the minority party for these years) and over time. Perhaps most interesting is the (marginally) significant negative Senate effect. The average Senate candidate engages in 2.09 (0.14) risky behaviors, compared to 2.33 (0.07) for the House. Senate candidates, particularly in competitive races, may put more emphasis on less risky incumbency factors, in light of recent trends of a greater Senate incumbency advantage (Ansolabehere and Snyder Reference Ansolabehere and Snyder2002, 320).Footnote 29 In the next two columns of Table 3, we probe chamber differences further by presenting regressions separately for the House and the Senate. Although the results reveal some distinctions, the challenger–incumbent difference is robust, and in fact virtually identical across chambers.Footnote 30 It thus appears that chamber variation in risky behavior applies across candidates (and not just to incumbents or challengers).
The final regression in Table 3 explores a dynamic about which we have thus far said little—the behavior of open seat candidates. Our approach suggests that front-running open seat candidates may act like incumbents. These candidates, who in practice almost always come from the prior incumbent's party,Footnote 31 do not need to overcome an incumbency advantage, and their front-runner status means they have little incentive to take risks. We test this by adding an interaction between open seat status and front-runner status with the expectation of a significant negative coefficient (which would indicate a smaller open seat main effect). We add an analogous interaction between challengers and front-runner status, although we do not expect it to be significant. Even front-running challengers need to take steps to overcome the incumbency advantage (and thus we do not expect the challenger main effect to diminish, as would be indicated by a significant negative interaction). The results support these expectations; the open seat–front-runner interaction is highly significant and the challenger interaction is not.Footnote 32 The significant negative interaction shows that the open seat main effect dramatically shrinks for front-runners; the average front-running open seat candidate engages in 1.67 (0.27) risk behaviors compared to 3.02 (0.26) for the average trailing open seat candidate. These predicted means nicely match the aforementioned respective challenger and incumbent means of 1.23 and 3.32.Footnote 33
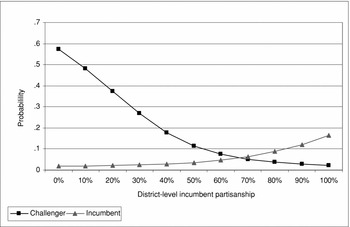
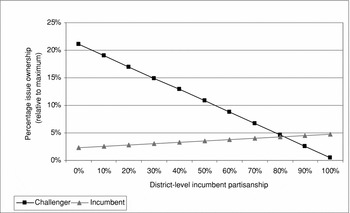
To gauge just how much risk challengers are willing to take, we now further explore partisan strategies. Emphasizing one's party and/or engaging in issue ownership (i.e., focusing on issues of particular importance to fellow partisans) become increasingly risky as the number of fellow partisans in the district/state decreases (e.g., highlighting Democratic party status is risky when there are fewer Democratic voters). In Figures 4 and 5, we plot the extent to which incumbents and challengers, on average, emphasize partisanship and engage in issue ownership (i.e., on a standardized scale where 0% indicates equal attention to owned and unowned issues and 100% equals maximum attention to owned issues).Footnote 34 The x-axis displays the percentage of the district or state that shares the incumbent's partisanship, as indicated by the standard presidential vote in the district or state measure (Carson, Engstrom, and Roberts Reference Carson, Engstrom and Roberts2006). Both figures show that, as revealed in Figure 2, challengers employ these strategies significantly more often, and that the candidates sensibly respond to district partisanship—for example, challengers become less likely to use partisan tactics when more of their constituency consists of members of the opposing party.
Party Emphasis

Issue Ownership

More important are the regions where a majority of the constituency voted for the presidential candidate of the incumbent's party (e.g., suggesting that the median voter is of the incumbent's party or perhaps an Independent), but challengers, nonetheless, continue to employ partisan approaches more than incumbents. That is, challengers put relatively more emphasis on aspects of their party despite the fact that the majority of their potential constituents are, at the very least, not strong supporters of their party. This accentuates the tremendous extent to which incumbents avoid uncertainty using incumbency-focused messages “devoid of partisan or even programmatic content” (Jacobson Reference Jacobson1992, 141). It also reflects the small choice challengers have other than to employ strategies whose ultimate outcomes are uncertain at best (perhaps reflecting some desperation).
Negativity and Content
Our portrayal of risk as the underlying latent factor behind incumbent and challenger strategies suggests a coherence to these strategies—that is, candidates’ strategies entail more than a patchwork of various points of emphasis. Consistent with this argument, we expect a connection between the type of negativity (used to stimulate attention) and the content of a candidate's message.
As discussed, a candidate can go negative by attacking the opponent on issues, personal features, or both (e.g., Geer Reference Geer2006). If, as we have argued, candidates go negative to motivate voters to attend to rhetoric that shifts the criteria of choice, then it is sensible that the type of negativity employed would cohere with the criteria the candidate emphasizes. Candidates who go negative on issues are likely to emphasize issues more than those who do not go negative on issues; candidates who go personally negative are likely to emphasize personal features more than those who do not go personally negative.Footnote 35 Extant work has yet to explore this possibility, instead treating negativity as an end in itself, rather than as part of a larger rhetorical strategy aimed at altering the criteria of electoral choice.
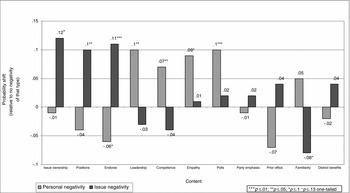
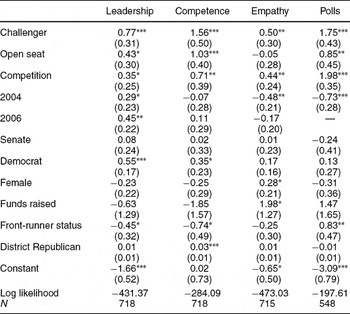
We test this by adding two variables—indicating whether the candidate went personally negative and whether the candidate went negative on issues—to the same regressions that generated the probabilities reported in Figure 2 (and that can be found in Appendix D).Footnote 36 We then compare the computed probabilities of engaging in a given type of rhetoric for candidates who went personally negative against those for candidates who did not go personally negative. We do the same for issue negativity. (Candidates may have engaged in both types of negativity.)
Figure 6 reports the changes in probability for both personal and issue negativity.Footnote 37 For example, the likelihood of emphasizing unambiguous issue positions increases by a significant 10% for candidates who go negative on issues (compared to those who do not). The results support our contention that negativity forms part of a larger campaign strategy aimed at inducing voters to base their decisions on issue and/or personal criteria. Indeed, the likelihood of engaging in each type of issue strategy—issue ownership, position-taking, and offering endorsements—significantly increases when a candidate goes negative on issues (ranging from 10% to 12% increases). Analogously, candidates who go personally negative display a significantly greater likelihood of emphasizing personal rhetoric, including leadership, competence, empathy, and polls (with the increased likelihood ranging from 7% to 10%). We find little evidence of a relationship between negativity and the incumbency-based rhetoric or party emphasis, which is not surprising, as we had no expectation of meaningful connections.
Negativity Type and Campaign Content

These results support our overall portrait of campaign strategy. Challengers and incumbents fundamentally differ in the criteria they emphasize, with challengers placing more emphasis on issues, personal features, and party, and incumbents putting more relative weight on the factors that underlie incumbency. Challengers and incumbents also differ in terms of their responsiveness to competition. Whereas challengers are consistently willing to take risks, incumbents will only do so when races tighten. These distinct tactics cohere into comprehensive campaign strategies, which basically amount to challengers opting for riskier options. That candidates connect the content of their rhetoric to its tone (i.e., type of negativity) constitutes further evidence that candidates carefully calibrate their entire strategies.
Advantages of Web Data
We argued that an advantage of the Web data—in addition to their being unmediated and holistic—is their representativeness (e.g., see Table 1). To see how this can impact substantive conclusions, consider Lau and Pomper's (Reference Lau and Pomper2004, 36) finding, based on Senate newspaper coverage from 1992 through 2002, that challengers do not significantly differ from incumbents in terms of the likelihood of going negative. This contradicts our finding (also see Kahn and Kenney Reference Kahn and Kenney1999, 74–98). In addition to using alternative media and different years, it may be that their nonfinding stems from reliance on a sample that excludes noncompetitive races (and House races) and overrepresents open seat races (see Table 1). To test this possibility, we reran our basic negativity analysis (see Figure 2; Table D-1) on the subsample of all candidates for whom we could access newspaper articles and who met the 16-article minimum used by Lau and Pomper (for 2002–4, the period for which we counted newspaper articles). We find that the challenger variable becomes insignificant (b = 0.15, se = 0.69, p < .45, for a one-tailed test).Footnote 38 When we do an analogous analysis but just for campaigns that produced television advertisements in 2002 and 2004, we find that the challenger effect just falls short of significance (b = 0.61, se = 0.56, p < .15).Footnote 39 Yet, if we analyze the full sample of our Web data for those same years, we continue to find significant challenger effects (b = 0.82, se = 0.46, p < .05).
To evaluate the overall impact of limited television and newspaper samples, we reran our basic analysis for each dependent variable using only the data that would be available based on accessible newspaper coverage with at least 16 articles, and only on the production of television advertisements. For newspapers, we find that we would have failed to find a significant challenger–incumbent distinction for eight of the dependent variables explored in Figure 2: negativity, positions, leadership, competence, polls, party emphasis, prior office, and familiarity. We would have failed to find significant effects with a sample akin to what would be available with television advertisements for six variables: negativity, personal negativity, competence, polls, prior office, and familiarity.Footnote 40 Clearly, the nature of the sample used to study campaign communications can have notable effects on the findings. Limited samples may obscure an important distinction in the way that incumbents and challengers campaign.
CONCLUSION
Campaigns are critical to democracy and thus deserve significant scholarly attention. Extant research often proceeds in a piecemeal fashion, focusing on one strategy at a time (e.g., negativity, issue ownership), and relies on less than ideal data. We have attempted to advance the study of campaigns by integrating past work and offering a new data source. In so doing, we brought together previously disparate literatures and incorporated a wide range of understudied campaign behaviors (e.g., the use of polls, personal feature emphasis). We also established the virtues of using Web data as an unmediated, holistic, and representative way to measure campaigns. As in other work, we find that challengers and incumbents behave differently, but unlike prior work, we systematically explored these differences across campaign behaviors, recognized the contingent nature of incumbent behavior (based on competition), identified a potential underlying dynamic behind strategic differences (i.e., risk-taking), and linked negativity to the content of candidates' rhetoric.
Our results suggest a number of intriguing directions for future research. First is the question of whether our findings will hold over future years, as political conditions continue to evolve. The extent and nature of the incumbency advantage changed in the 1990s with the rise of nationalized elections, active parties, and issue-oriented interest groups (Fiorina Reference Fiorina, Dodd and Oppenheimer2004; also see Koch Reference Koch2008). Although it is unclear whether these changes affected campaign strategies, it seems likely that conditions will continue to change in ways that may or may not impact strategies. Similarly, future work can identify when the same basic dynamics hold across communication channels, including television advertisements, news coverage, speeches, direct mail, and debates. Second, the ultimate success of these alternative campaign strategies remains unclear. Do incumbents who emphasize aspects of incumbency fare better than those who do not? As the literature on the effects of campaign spending (e.g., Gerber Reference Gerber2004) reveals, assessing these effects will not be straightforward. Third, we have left unanswered the question of why some challengers opt for an issue focus, whereas others emphasize personal features or party (or some mix). The sources of these choices likely lie in the nature of the candidate's constituency.
Fourth, we are struck by the similarity between our work and Groseclose's (Reference Groseclose2001) influential formal model. Groseclose examines a situation where one candidate has a potential valence advantage, such as incumbency. He shows that in an attempt to counter the valence/incumbency advantage, a challenger will take relatively extreme policy positions (i.e., diverge from the median). The challenger does this because it minimizes the salience of the valence advantage (see Groseclose Reference Groseclose2001, 864–65). Similarly, we show that to counter a valence/incumbency advantage, challengers engage in risky strategies that alter the relative importance of different considerations. For us, candidates do this by explicitly priming alternative considerations. An intriguing direction for future research would be to further integrate our approaches; for example, one could extend Groseclose's model to incorporate alternative criteria of voter choice (e.g., disaggregate his valence term), add salience weights to the criteria, and allow candidates to choose between attempts to alter salience or engage in extreme position taking. Negativity also could potentially be brought into his model by allowing candidates to go negative and then with some probability cause voters to reconsider the basis of their vote choice. On the flip side, our approach could draw on Groseclose's and incorporate position-taking and a more explicit consideration of the opponent's position and strategy.Footnote 41
Another literature with which more definitive connections should be made is work on political marketing and segmentation (e.g., Newman Reference Newman1999, Newman and Perloff Reference Newman, Perloff and Kaid2004, Palmer Reference Palmer2004). We focused on “on average” strategies, but candidates of course also fine-tune parts of their messages for particular audiences, and we imagine will do so to a greater extent in the future (e.g., in our data, candidates do not seem to be taking full advantage of targeting opportunities, as indicated by the relatively few candidates who allow interactivity on their Web sites). Also, some of the work on which we explicitly built—particularly Trent and Friedenberg (Reference Trent and Friedenberg2008)—offers additional predictions about incumbent and challenger behavior that can be tested (e.g., challengers will emphasize traditional values).
Finally, like most other work on campaign strategy, the implications of our findings for democratic responsiveness remain unclear (although see Sulkin Reference Sulkin2005). Do officeholders who emphasize issues in their campaigns pursue these issues once elected? Does highlighting certain personal features lead elected officials to behaviors aimed at sustaining those features? Do candidates who place weight on their parties subsequently behave as loyal partisans? If not, is it disingenuous of representatives to emphasize these factors? If so, what does it mean for representation that aspects of responsiveness are driven, in part, by the candidate's status as an incumbent or challenger?Footnote 42 These are critical questions about democratic representation and require an explicit link be made between work on campaigns and studies of governing behavior.
APPENDIX A: SURVEY OF WEB PRODUCERS
We conducted a survey of individuals involved in the creation of congressional campaign Web sites. We identified potential respondents by accessing the universe of U.S. Senate and House campaign Web sites in 2008. We contacted the 716 campaigns that provided a workable e-mail address or online inquiry form on October 17. We followed up, on subsequent days, by calling each campaign (when a phone number was provided). We asked that an individual involved in the creation and/or updating of the campaign's Web site either complete a confidential 5-minute on-line survey or e-mail the embedded survey back to us. We contacted each campaign up to three times (with the last contact occurring on November 5), receiving a total of 137 responses (a 19.13% response rate, which falls within a typical range; see Couper Reference Couper2008, 340).Footnote 43 The sample reflected the population of campaigns fairly well in terms of office (14% came from Senate campaigns), party (53% came from Democratic campaigns), and status (31% came from incumbents, 53% came from challengers, and 15% came from open seats). We asked respondents, on a seven-point scale, to indicate the extent to which they are informed about how the content of the site is determined, with higher scores indicating more knowledge. The average response is 6.51 (std. dev. = 1.16; N = 136).
In addition to the items described in the text, we asked respondents to rate how well various forms of communication “capture the campaign's overall strategy (e.g., the message your campaign hopes to relay to voters at large, as opposed to more targeted messages)” on a seven-point scale, with higher scores indicating fuller capture of the overall strategy. Respondents rated the Web site (mean = 5.88; std. dev. = 1.50; N = 109) as significantly more representative than all other media, followed by speeches (5.63; 1.54; 111), informal conversations (5.57; 1.66; 109), television advertisements (for those campaigns that had ads; 4.99; 2.19; 69), direct mail (4.86; 1.91; 98), and media coverage (4.72; 1.81; 107) (e.g., comparing the Web to speeches gives t 108 = 1.63, p < .11 for a two-tailed test). The lower score for television advertisements may reflect the aforementioned information constraint as well as targeting towards particular audiences (e.g., Goldstein Reference Goldstein, Goldstein and Strach2004). Relatedly, respondents reported that 91% of other campaign material included the campaign Web site's address.
Another item on the survey asked respondents to rate the importance of various goals for their Web sites on a seven-point scale, with higher scores indicating increased importance. Of note is that the top-rated activities are those aimed at information provision (e.g., about issues and personal background) and persuasion. Respondents rated fundraising and volunteer-oriented activities as dramatically (and significantly) less important (see Foot and Schneider Reference Foot and Schneider2006, 170 and Stromer-Galley et al. Reference Stromer-Galley, Howard, Schneider and Foot2003 for similar results from their 2002–3 survey).
APPENDIX B: COMPARISONS WITH TELEVISION ADVERTISING AND NEWSPAPER COVERAGE
To compare the tone of rhetoric on our Web sites with television advertising and newspaper coverage, we used data from the Wisconsin Advertising Project for 2002 and 2004 (for candidates who produced advertisements, meaning a total of 232 candidates, or 52% of the candidates in our sample) and data from our own content analysis of newspaper coverage of Senate campaigns from 2002 through 2006. (Note that this newspaper content analysis is distinct—although it overlaps—from the data presented in Table 1.) In analyzing the newspapers, we coded each distinct statement attributed to the campaign in up to 30 randomly drawn articles from the state's major newspaper, for all states that had an available electronic newspaper (a total of 157 candidates, which equals 79% of our Senate sample); (see Lau and Pomper Reference Lau and Pomper2004).Footnote 44 For the television advertising comparison, we find a highly significant relationship such that those who did not go negative on their Web sites produce, on the average, only 1.02 (se = 0.17; N = 124) negative television advertisements, compared to 1.87 (0.20; 105) negative advertisements for those who went negative on their Web sites (t 227 = 3.22, p < .01).Footnote 45 Similarly, for newspaper coverage, those who did not go negative on the Web had, on the average, only 1.29 (0.38; N = 59) negative statements attributed to them, whereas those who went negative had 4.32 (0.72; 92) attributed negative statements (t 149 = 3.18, p < .01).Footnote 46
APPENDIX C: INDEPENDENT VARIABLES
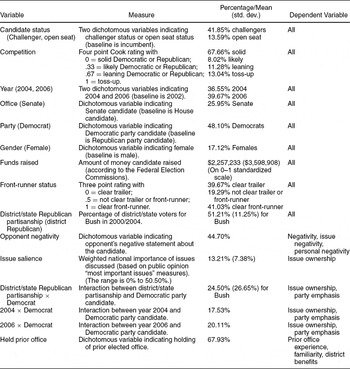
In Table C.1, we display the additional variables included in our analyses (see Appendix D), along with some descriptive statistics. All of these data are measured at the candidate level, and, unless otherwise noted, the data come from The Almanac of American Politics (complemented by the National Journal Web site). For all analyses, we included variables that prior work shows have significant effects on campaign behavior. We included additional independent variables for certain dependent variables (either because prior work on that variable suggests it, or because it strikes us as an obviously relevant factor). The last column of Table C.1 lists the dependent variable(s) for which the given variable is included.
Independent Variables

Variables included in all analyses that are dichotomous indicators include year (2004, 2006), office (Senate), party (Democrat), and gender (Female). We also include front-runner status in all analyses, because it is a prominent variable in some prior work (e.g., Buell and Sigelman Reference Buell and Sigelman2008; Skaperdas and Grofman Reference Skaperdas and Grofman1995), and it correlates with candidate status (e.g., incumbents are typically front-runners, and it also, as noted in the text, impacts the behavior of open seat candidates). We measure front-runner status by taking the difference between a candidate's support (measured in the proportion of the vote he or she received in the election) and the support for his or her opponent, and then creating three categories of “clear front-runner,” “not clear trailer or front-runner,” and “clear trailer” (e.g., Lau and Pomper Reference Lau and Pomper2004: 35).Footnote 47
We measure a campaign's resources by the amount of money each candidate raised (in millions of dollars) as reported by the Federal Election Commission (FEC). The FEC failed to report financial data for 18 of our 736 candidates. Given the importance of funds in general, we opt to report analyses with the fund-raising variable included and, thus, we exclude the 18 missing cases (resulting in an N of 718). Our results are unchanged if we exclude fundraising and run the analyses on all 736 cases.
We measure “District/State (D/S) Republican Vote,” for 2002 and 2004, with the percentage of votes in the district/state cast for George W. Bush in 2000, and for 2006 with the percentage of votes cast for Bush in 2004 (Carson, Engstrom and Roberts Reference Carson, Engstrom and Roberts2006; Lau and Pomper Reference Lau and Pomper2004). We also collected data on other district/state features such as percentage urban, percentage with high school diploma, median income, and percentage of homes in the state with Internet connections; we do not include these variables in the analyses, as their inclusion does not change the results.
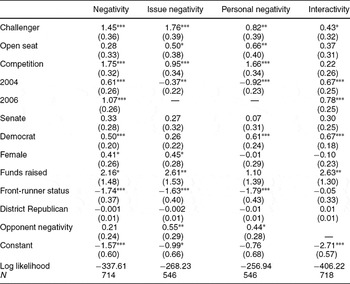
Going Negative and Interactivity (Figure 2)

Note: Entries are logit coefficients with standard errors in parentheses. ***p ≤ .01; **p ≤ .05; *p ≤ .10 for one-tailed tests.
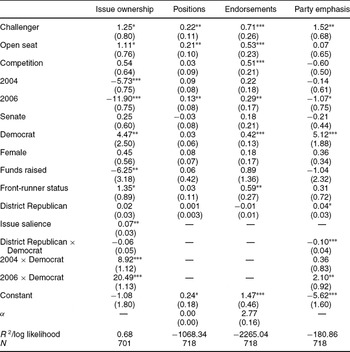
For our negativity regressions, we include a variable that indicates whether the candidate's opponent went negative on his or her Web site, because other work suggests that a negative statement triggers a negative response (see Ansolabehere and Iyengar Reference Ansolabehere and Iyengar1995; Kahn and Kenney Reference Kahn and Kenney1999; Lau and Pomper Reference Lau and Pomper2004, 33). For our issue ownership model, we add a variable to control for the salience of the issues discussed in order to test for the possibility that issue ownership stems from a party's issues being publicly salient (see Sides Reference Sides2006). We constructed our issue saliency measure based on data from Harris Interactive's “two most important issues” question.Footnote 48 Also, for our issue ownership analysis, as well as the party emphasis regression, we add three other variables. This includes an interaction between Democratic candidate status and district ideology, due to the possibility of a negative impact of district ideology (measured in the Republican direction), particularly for Democratic candidates (see Abramowitz, Alexander, and Gunning Reference Abramowitz, Alexander and Gunning2006). We also include interactions for year (2004 and 2006) and Democratic candidate status because, over the time of our data, the Democratic Party's relative approval continually grew, and thus, Democratic candidates had increasing incentives to emphasize partisan-related features.Footnote 49
Issues and Party Emphasis (Figure 2)

Note: Entries are coefficients with standard errors in brackets. Issue ownership is a least squared regression. Positions and endorsements are negative binomial regressions. Party emphasis is a logit regression. ***p ≤ .01; **p ≤ .05; *p ≤ .10 for one-tailed tests.
Personal Features (Figure 2)

Note: Entries are logit coefficients with standard errors in brackets. ***p ≤ .01; **p ≤ .05; *p ≤ .10 for one-tailed tests.

Finally, for our three incumbent dependent variables—prior office experience, familiarity, and district benefits—we add a variable indicating whether the candidate held any prior office. This is an important control to preclude the possibility that an incumbency effect does not only reflect the fact that the incumbent held a prior office and thus can emphasize those experiences.
APPENDIX D: ANALYSES
In Tables D.1–D.4, we report regressions akin to the ones used to generate the probabilities presented in Figure 2. The exceptions involve the interval level dependent variables. In this Appendix, we use the full range of these variables, but in Figure 2, we report probabilities based on regressions that transformed the variables to dichotomous measures indicating whether the candidate was below or above the mean value. Also, in this Appendix, the incumbency regressions that include interactions between candidate status and competition use the full four-point competition scale; however, as noted in the text, Figure 3 is based on a three-point competition scale that collapses likely and leaning races. All analyses for the figures are available from the authors. Also, for all analyses, we recoded the independent variables to be on 0 to 1 scales. We also use one-tailed tests, because our predictions have clear directional content (Blalock Reference Blalock1979, 163).



Comments
No Comments have been published for this article.