Introduction
In the 170 million years of earth system history since their first appearance in the Jurassic (Simmons et al. Reference Simmons, BouDagher-Fadel, Banner and Whittaker1997; Hart et al. Reference Hart, Hylton, Oxford, Price, Hudson and Swart2003), planktic foraminifers have become diversified and widely distributed in the world ocean (e.g., Norris Reference Norris1991). Moreover, because planktic foraminifers are an important open ocean calcifier, their appearance and diversification in the mid-Cretaceous was accompanied by the enhanced carbonate export from the surface to the bottom of ocean, contributing to the creation of a new mode of global carbon cycling (Zeebe and Westbroek Reference Zeebe and Westbroek2003). Carbonate export by planktic foraminifers, estimated at 23–56% of the total CaCO3 flux in the modern open ocean (Schiebel Reference Schiebel2002), is an important component of the oceanic biological pump. Their tests often sink to the seafloor and become buried in the sub-seafloor sediment reservoir, where they contribute to the long-term global carbon cycle (e.g., Ridgwell and Zeebe Reference Ridgwell and Zeebe2005). The diversification and profusion of planktic foraminifer, however, has been punctuated by major earth system turnovers, such as the Cretaceous/Paleogene boundary extinction event and the massive cryosphere expansion at the Eocene/Oligocene boundary (e.g., Leckie Reference Leckie1989; Pearson et al. Reference Pearson, McMillan, Wade, Jones, Coxall, Bown and Lear2008). Nevertheless, after each of these crises, planktic foraminifers recovered their diversity and maintained their role as a key player in the global carbon cycle. During each recovery period, the development of a new ecology accelerated foraminiferal diversification into previously unexploited or lost niches (Norris Reference Norris1996; Coxall et al. Reference Coxall, D’Hondt and Zachos2006; Aze et al. Reference Aze, Ezard, Purvis, Coxall, Stewart, Wade and Pearson2011; Ezard et al. Reference Ezard, Aze, Pearson and Purvis2011). One contributor to the diversity dynamics of planktic foraminifers was the development of photosymbiotic ecology, which is thought to offer ecological advantages to organisms inhabiting the oligotrophic open ocean. Therefore, the timing and tempo of the evolution of photosymbiotic ecology must be examined to gain an insight into the paleobiodiversity of planktic foraminifers (Ezard et al. Reference Ezard, Aze, Pearson and Purvis2011).
Because photosymbiosis is not necessarily associated with specific test morphologies, geochemical imprints on foraminiferal tests attributable to algal photosynthesis have been used to identify photosymbiosis in extinct species (e.g., D’Hondt and Zachos Reference D’Hondt and Zachos1993; D’Hondt et al. Reference D’Hondt, Zachos and Schultz1994; Norris Reference Norris1996; Houston and Huber Reference Houston and Huber1998; Bornemann and Norris Reference Bornemann and Norris2007; Wade et al. Reference Wade, Al-Sabouni, Hemleben and Kroon2008; Birch et al. Reference Birch, Coxall and Pearson2012). Knowledge about geochemical imprints of algal photosymbiosis has been obtained by culture experiments with modern foraminifers and by theoretical model simulations (e.g., Spero and DeNiro Reference Spero and DeNiro1987; Spero and Lea Reference Spero and Lea1993; Wolf-Gladrow et al. Reference Wolf-Gladrow, Bijma and Zeebe1999). Their results strongly suggest that photosymbiosis causes δ13C of each foraminiferal chamber secreted to increase (i.e., to be enriched in 13C) during ontogeny. This idea has been empirically applied to fossil specimens but not with a focus on isotopic signals within a single individual. Rather, tests in sieve-fractions of different sizes have been analyzed to construct a hypothetical ontogenetic isotope series, assuming that smaller tests are representative of the earlier stages of larger tests. For example, Norris (Reference Norris1996) achieved such hypothetical ontogenetic series by analyzing the isotopic signals of individuals from each 0.25-phi sieve-fraction from 106 through 355 µm. When applied to fossil specimens, this method requires a large number of individual tests for a single measurement (e.g., more than 80 specimens per measurement in the <100-µm size fraction [Birch et al. Reference Birch, Coxall and Pearson2012]). Individuals from smaller size fractions are often difficult to identify to species. An additional disadvantage of the sieve-fraction method is that individuals that grew in different seasons or years or at different growth rates are mixed within one sample, thus mingling the isotopic signatures of various water-mass conditions. Of the many foraminiferal isotopic analyses conducted so far, the only single-individual ontogenetic study of isotopic signals is the pioneering study of the modern symbiotic species Globigerinoides sacculifer (Spero and Lea Reference Spero and Lea1993). However, owing to the study’s focus on a few chambers secreted under laboratory conditions, and to analytical limitations at that time, each ontogenetic profile generated consists of four data points (four ontogenetic stages) at most, which is not enough for examination of the complete ontogenetic profiles. Hence, although a positive δ13C shift with the symbiont host’s growth is expected to be a proxy of algal photosymbiosis, this hypothesis needs further, systematic testing.
Here we present the ontogenetic isotope profiles of single individuals of three Recent planktic foraminiferal species. We analyzed the chamber-by-chamber δ13C and δ18O compositions of individuals of both symbiotic and asymbiotic species by using a specially designed continuous-flow isotopic ratio mass spectrometer (CF-IRMS).
Material and Methods
Planktic Foraminiferal Sample
All specimens used here were obtained from top surface sediment recovered from northern end of the Louisville Seamount Trail, about 1500 km offshore New Zealand (26°29.6′S, 174°43.75′W, water depth 1957.6 m, 0.1 mbsf), by Integrated Ocean Drilling Program (IODP) Expedition 330. The area investigated is located inside the South Pacific Subtropical Gyre, thereby representing an oligotrophic, open-ocean environment (Fig. 1, Supplementary Materials). The sample (U1372A, 1R-CC, 0.1 mbsf) has been assigned to planktic foraminiferal biostratigraphic zone PT1b, and to Holocene age by onboard paleontological and biostratigraphic analyses (Koppers et al. Reference Koppers, Yamazaki and Geldmacher2012).
Location map of the study site (Site U1372A; 26°29.6′S, 174°43.75′W, water depth 1957.6 m).

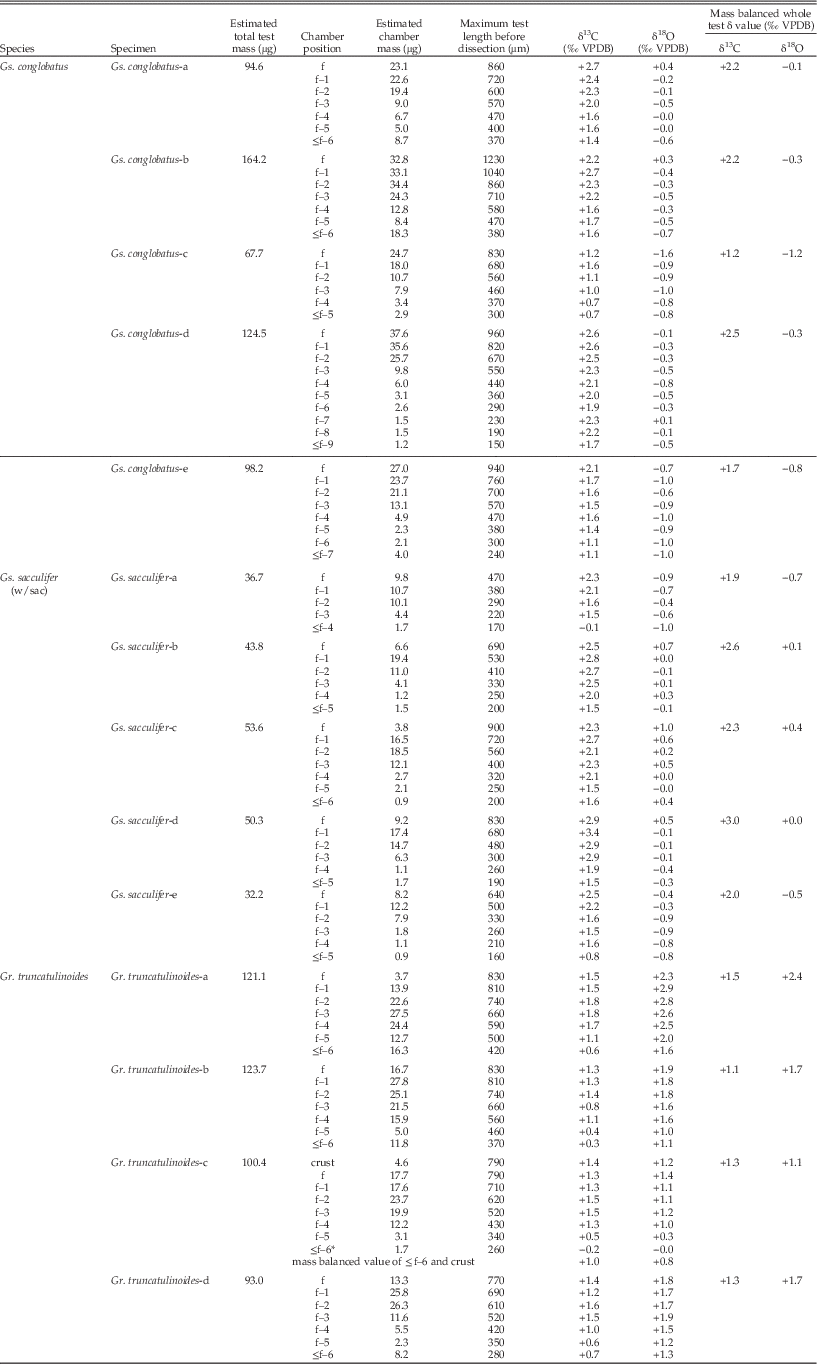
Fossil material of three Recent planktic foraminiferal species was used for isotopic analyses: Globigerinoides conglobatus (symbiotic), Gs. sacculifer (symbiotic), and Globorotalia truncatulinoides (asymbiotic) (Table 1). We chose Gs. conglobatus and Gs. sacculifer as symbiotic representatives because Gs. conglobatus is large enough to extract many growth stages by chamber dissection (see below), and Gs. sacculifer is one of the species that has been carefully investigated both isotopically and ecologically on the basis of laboratory culture under a controlled environment. Gr. truncatulinoides was selected as an asymbiotic representative for its larger test size and its abundance in the sample.
Ecology and test characteristics of species analyzed.

* Average of size increasing ratio are calculated in this study
References: 1 Bé et al. (Reference Bé, Hemleben, Anderson, Spindler, Hacunda and Tuntivate-Choy1977), 2 Bé (Reference Bé1980), 3 Saito et al. (Reference Saito, Thompson and Breger1981), 4 Kennett and Srinivasan (Reference Kennett and Srinivasan1983), 5 Gastrich (Reference Gastrich1987), 6 Hemleben et al. (Reference Hemleben, Spindler and Anderson1989), 7 Lohmann and Schweitzer (Reference Lohmann and Schweitzer1990), 8 Lohmann (Reference Lohmann1995), 9 Schiebel and Hemleben (Reference Schiebel and Hemleben2005), 10 Shaked and de Vargas (Reference Shaked and de Vargas2006), 11 Siano et al. (Reference Siano, Montresor, Probert, Not and de Vargas2010)
Chamber Dissection
In this study, we used the chamber-specific isotopic measurement similar to that used by Spero and Lea (Reference Spero and Lea1993). Each test was dissected chamber by chamber with a finely sharpened needle or ophthalmic surgical micro-blade. Each chamber was removed, from the last (most recent) chamber to the earliest chambers until the size of the individual became too small for dissection. The maximum test length before dissection of each chamber was measured by calibrated eyepiece micrometer under a stereoscopic microscope (Table 2). Prior to the measurement, all chambers dissected were ultrasonicated with pure water and observed under scanning electron and stereoscopic microscopes to confirm their exquisite preservation (Fig. 2).
Scanning electron micrographs of each species (A1, B1, C1) and examples of their chambers dissected (A2, B2, C2). All micrographs are taken without any metal spattering: A1, Globigerinoides conglobatus. B1, Globigerinoides sacculifer. C1, Globorotalia truncatulinoides. A2, specimen Gs. conglobatus-e used for isotope analyses. B2, specimen Gs. sacculifer-c. C2, specimen Gr. truncatulinoides-c (refer to Table 2 and Fig. 3 for postfix). f, final chamber; f–n (n=1, 2, 3, 4, 5, 6, 7), the n th chamber counting backward from the final chamber; ≤f–n, juvenile test from initial chamber through f–n. Scale bars, 200 µm.
Stable isotopic composition of each chamber and mass balanced isotopic value of each individual. Each chamber mass (CaCO3 mass) is calculated from pressure of purified CO2 evolved with reaction between posphoric acid and CaCO3. For explanation of f, f–1, f–2, etc., see Figure 1. *, outer crust at spiral side of chamber ≤f–6 was removed before analyses for specimen Gr. truncatlinoides-c. Standard devition (1σ) of test length is ±10 µm (n=5). Gs., Globigerinoides; Gr., Globorotalia. VPDB, Vienna Pee Dee Belemnite.
Isotopic Analysis
We performed single-chamber stable carbon and oxygen isotope analyses. δ13C and δ18O values were determined by using a specially designed continuous-flow isotope ratio mass spectrometry system (Ishimura et al. Reference Ishimura, Tsunogai and Gamo2004, Reference Ishimura, Tsunogai and Nakagawa2008) at the Geological Survey of Japan, National Institute of Advanced Industrial Science and Technology.
Each chamber dissected was put into an evacuated side-arm glass vial with anhydrous phosphoric acid (H3PO4) and reacted at 25°C for several hours under vacuum till all carbonate had reacted. The generated CO2 was purified using a stainless steel vacuum line with cryotraps. The CO2 purified was introduced to a gas chromatograph with helium carrier gas continuously flowing in the line, and then carried into the isotope-ratio mass spectrometer (Isoprime, Isoprime Ltd.).
The continuous-flow system we used enabled us to determine both δ13C and δ18O values for micro-volume carbonate samples as small as 0.2 μg with high precision and accuracy (Kimoto et al. Reference Kimoto, Ishimura, Tsunogai, Itaki and Ujiié2009; Ishimura et al. Reference Ishimura, Tsunogai, Hasegawa, Nakagawa, Oi, Kitazato, Suga and Toyofuku2012). The external precision of this system is better than ±0.15‰ for both δ13C and δ18O. NBS-19 carbonate standard was used for calibration of the Vienna Peedee belemnite (VPDB) scale. Pressure of each purified CO2 gas trapped in a fixed-volume metal tube was determined by the pressure gauge for calculating a carbonate mass of each chamber (Table 2).
Results and Discussion
The ontogenetic δ13C records of the species analyzed show that, in the two symbiotic species, δ13C values of all individuals increase with growth; δ13C increases (maximum δ13C minus minimum δ13C) by up to 1.2‰ in Gs. conglobatus and 2.4‰ in Gs. sacculifer. In contrast, in the asymbiotic species Gr. truncatulinoides, the δ13C values increase by up to 1.2‰, although the increase is observed only during earlier ontogenetic stage, and values stabilize at later ontogenetic stages (Fig. 3). Comparing the three species, asymbiotic Gr. truncatulinoides shows more negative values than symbiotic Gs. conglobatus and Gs. sacculifer.
Ontogenetic variations in δ13C (A1, B1, C1, D1) and δ18O (A2, B2, C2, D2): A, Globigerinoides conglobatus. B, Globigerinoides sacculifer. C, Globorotalia truncatulinoides. D, Results from laboratory cultured Globigerinoides sacculifer for comparison (data are from Spero and Lea Reference Spero and Lea1993). For f, f–1, f–2, etc., see Figure 1. For specimen Gr. truncatulinoides-c, outermost crust at the spiral side of the chamber ≤f–6 was removed and analyzed separately, and data are plotted next to the final chamber. Hence, the quality of data of ≤f–6 in specimen Gr. truncatulinoides-c is different from that of the other individuals; data from this specimen are therefore not connected to the adjacent f–5 plot. Symbols with the same color show results from the same individual. All error bars represent analytical error of ±0.15‰ for both δ13C and δ18O. Gs., Globigerinoides; Gr., Globorotalia. VPDB, Vienna Peedee belemnite.
δ18O values of the two symbiotic species tend to be negative and show no obvious ontogenetic trend. In asymbiotic Gr. truncatulinoides, δ18O values increase by up to 1.5‰. As in δ13C profiles, the δ18O increase is observed in earlier ontogenetic stages, and becomes stable after the increase. Moreover, δ18O values of asymbiotic Gr. truncatulinoides are considerably more positive than those in the two symbiotic species Gs. conglobatus and Gs. sacculifer.
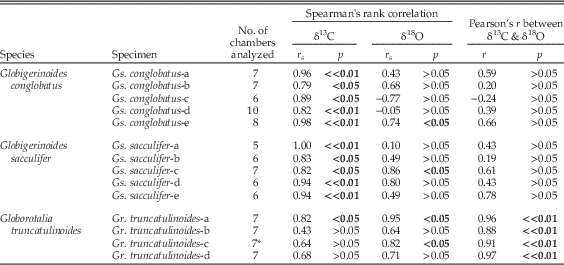
Photosymbiotic Signals in δ 13C and δ 18O of Gs. conglobatus and Gs. sacculifer.—In the two symbiotic species, δ13C values show a statistically significant increase with the ontogenetic growth stage (significant Spearman’s rank correlation (r s) between ontogenetic stages and δ13C). These statistical results are consistent in all ten symbiotic individuals analyzed in this study (p-values all <0.05, Table 3). On the other hand, the δ13C increase through ontogeny is not seen in asymbiotic Gr. truncatulinoides, except for Gr. truncatulinoides-a. In Gr. truncatulinoides-a, significant rank correlation is observed not only in δ13C, but also in δ18O. As a result, Gr. truncatulinoides-a show significant Pearson’s product-moment correlation (r) between δ13C and δ18O. This linear correlation between δ13C and δ18O has been seen in all specimens of Gr. truncatulinoides (p-values all << 0.01, Table 3). Although some specimens of symbiotic species also show positive rank correlation in δ18O, the combination of significant rank correlation in δ13C and absence of linear correlation between δ13C and δ18O can segregate symbiotic species from asymbiotic species (Table 3). From these results, we confirm that in individuals of symbiotic species, δ13C of each chamber shifts toward more positive values with growth as shown in the previous cultural experiments (Spero and Lea Reference Spero and Lea1993).
Correlation coefficients and levels of significance of isotopic results. Correlation coefficient between chamber position and δ13C, and between chamber position and δ18O are expressed by Spearman’s rank correlation coefficient (r s). Bold characters represent p-values lower than significant level of 5%. *, for specimen Gr. truncatulinoides-c, mass balanced δ value of mixture of ontogenetic chamber ≤f–6 and crust is used for calculation (see Table 2).
Here, we offer three possible explanations for the ontogenetic δ13C increase: (1) individuals migrate toward shallower depths as they grow, (2) their calcification rate deteriorates with growth, or (3) the carbon source used for calcification becomes enriched in 13C.
As for the first hypothesis, if foraminifers change their calcification depth from deeper to shallower over the course of their ontogeny, they potentially record a δ13C gradient of dissolved inorganic carbon (DIC) within a water column. Because photosynthesis of phytoplankton at shallower depth preferentially removes 12C from DIC, whereas at deeper depth, 12C is released by decomposition of organic matter (see Kroopnick Reference Kroopnick1985) (Supplementary Fig. 1), migration to shallower depths during ontogeny should result in a progressive ontogenetic increase in δ13C. If this is the case, ontogenetic decrease in δ18O of the foraminiferal test, reflecting warmer waters, should also be observed. However, as reported above, δ18O does not decrease during ontogeny in these species, which is strong evidence against hypothesis 1. Actually, surface-dwelling species appear to migrate to deeper water through their ontogeny (e.g., Hemleben et al. Reference Hemleben, Spindler and Anderson1989; Schiebel and Hemleben Reference Schiebel and Hemleben2005). Additionally, the δ13C gradient observed in DIC of the water column between 0 and 1000 m deep is significantly smaller than the ontogenetic δ13C increase recorded in foraminiferal tests (see Supplementary Fig. 1).
With regard to hypothesis 2, as is common in many organisms, the growth rate of foraminifers may be faster during younger growth stages (e.g., Berger et al. Reference Berger, Killingley and Vincent1978; Hemleben et al. Reference Hemleben, Spindler and Anderson1989). It is well known that a faster calcification rate decreases δ13C and δ18O in the precipitated carbonates, and the faster the rate, the greater the effect (McConnaughey Reference McConnaughey1989a,Reference McConnaugheyb). Therefore, a reduction of this effect as the growth and carbonate precipitation rates slow during ontogeny could cause an apparent relative increase in ontogenetic δ13C. However, because this effect causes both δ13C and δ18O to become more negative, a corresponding ontogenetic increase of δ18O should be observed as well. Thus, a positive correlation between δ13C and δ18O would support this hypothesis, but no such correlation is observed in our symbiotic specimens.
Hypothesis 3, a continuous increase of δ13C of the ambient DIC through ontogeny of foraminifers, which is then incorporated into foraminiferal tests, is plausible. The carbon isotope composition in the microenvironment around symbiotic foraminifers is significantly altered by the photosynthesis of the symbionts (Wolf-Gladrow et al. Reference Wolf-Gladrow, Bijma and Zeebe1999). Under the condition of sufficient nutrient supply by host foraminifers, in addition, when light intensity is enough for photosynthetic saturation, as is usually the case with blue-water open surface oceans (Spero and Parker Reference Spero and Parker1985), this effect is a function of photosynthetic capacity, thus symbiont density. Moreover, symbiont density increases as a function of foraminiferal test size (Spero and Parker Reference Spero and Parker1985; Faber et al. Reference Faber, Anderson, Lindsey and Caron1988); as a result, δ13C of symbiotic foraminiferal tests becomes more positive throughout the life of each individual (e.g., Spero and DeNiro Reference Spero and DeNiro1987; Spero and Williams Reference Spero and Williams1988). This symbiont-related fractionation appears to be the most plausible explanation for our findings. The negative and relatively constant δ18O values during ontogeny constitute another isotopic clue that supports this interpretation. These δ18O values can be explained by the host’s habitat depth being restricted to the shallower and warmer euphotic zone, where the photosynthetic algae can receive adequate irradiance for photosynthesis.
Although Gs. conglobatus and Gs. sacculifer show similar isotopic trend through ontogeny, the δ13C increase per ontogenetic stage, hence the total δ13C increase, is different. The increase of δ13C is more rapid in Gs. sacculifer than in Gs. conglobatus. The difference can be explained by the difference in rate of morphometric size increase. If photosymbiotically related δ13C increase is explained by the mechanism mentioned above, the δ13C increment would be a function of the increment of cytoplasm, hence the increment of foraminiferal test size. More rapid growth in test size of Gs. sacculifer than that of Gs. conglobatus (Table 1) would presumably make the effect of photosynthesis more pronounced, consequently resulting in more rapid δ13C increase in Gs. sacculifer.
Isotopic Profile of Gr. truncatulinoides
The ontogenetic carbon and oxygen isotopic profiles of asymbiotic Gr. truncatulinoides show an increasing trend at earlier stages and then become relatively flat (Fig. 3-C1. 3-C2). The critical difference between these profiles and those of the symbiotic species is that in Gr. truncatulinoides δ13C and δ18O are significantly positively correlated (r=0.88–0.97, p<<0.01, Table 3, Fig. 4).
Scatter diagram of δ13C and δ18O values of all samples analyzed in this study: circle, Globigerinoides conglobatus; diamond, Globigerinoides sacculifer; inverse triangle, Globorotalia truncatulinoides. Symbols with the same color show results from the same individual. See Figure 3 for corresponding individuals. The solid lines are regression lines obtained by a reduced major axis analysis of δ18O versus δ13C of Gr. truncatulinoides specimens. For specimen Gr. truncatulinoides-c, mass balanced δ value of mixture of ontogenetic chamber ≤f–6 and crust is used for calculating the regression line. The positive correlation is statistically significant: La, δ18O=(1.1×δ13C)+0.9 (r=0.88); Lb, δ18O=(0.8×δ13C)+0.8 (r=0.96), Lc, δ18O=(1.0×δ13C)−0.2 (r=0.91); Ld, δ18O=(0.7×δ13C)+0.8 (r=0.97). Gs., Globigerinoides; Gr., Globorotalia. VPDB, Vienna Peedee belemnite.
In planktic foraminifers, a linear correlation between δ13C and δ18O can often be explained by (1) test encrustation and (2) differences in the calcification rate.
Gr. truncatulinoides is known to precipitate a thick outer crust when it migrates into deeper, cooler waters at the end of its ontogeny (e.g., Hemleben et al. Reference Hemleben, Spindler, Breitinger and Deuser1985; Lohmann Reference Lohmann1995; Mulitza et al. Reference Mulitza, Dürkoop, Hale, Wefer and Nieber1997). Lohmann (Reference Lohmann1995) discussed that the size-related isotopic difference in Gr. truncatulinoides can be explained by a difference in the proportion of two kinds of calcite mixture: primary calcite precipitated in shallower waters and secondary calcite precipitated in deeper waters. In our method, each dissected chamber includes both the primary ontogenetic layers (primary calcite) and the outer crust (secondary calcite). Therefore, a linear correlation between δ13C and δ18O would be expected if the thickness of the outer crust relative to total test thickness co-varies with the chamber increments. Although our observations of chamber-by-chamber crust thickness under scanning electron microscope are preliminary, it appears that the proportion of outer crust thickness does not change much with the chamber increments within a single individual. Therefore, we suspect that Lohmann’s scenario of difference in proportion of two kinds of calcite mixture might not be supported by our observation. Moreover, both δ13C and δ18O of the outer crust of the specimen Gr. truncatulinoides-c analyzed in this study show positive values. Considering the depth gradients of δ13C of DIC (δ13CDIC) and δ18O of equilibrium calcite (δ18Ocal) within the water column (see Supplementary Fig. 1), if the outer crust was precipitated at greater depth, negative δ13C and positive δ18O would be expected. Lohmann’s scenario is not supported from this point as well.
Alternatively, disequilibrium isotopic fractionation attributable to a faster calcification rate is a more plausible explanation for more negative δ13C and δ18O at younger ontogenetic stages and positive correlation between them. Because, as explained in the previous section, the calcification rate may slow with growth, deterioration of calcification-related fractionation could produce the apparent positive correlation between δ13C and δ18O (Table 3, Fig. 4). A similar disequilibrium effect has been inferred for several asymbiotic species of planktic foraminifers (e.g., Globigerina bulloides [Spero and Lea Reference Spero and Lea1996]; Globorotalia scitula, Globoquadrina hexagona [Ortiz et al. Reference Ortiz, Mix, Rugh, Watkins and Collier1996]). In terms of Gr. truncatulinoides, Lohmann and Schweitzer (Reference Lohmann and Schweitzer1990) proposed that the growth rate of this species is constant through ontogeny. However, the growth rate they mentioned is in morphometric size increase per chamber, which differs from the calcification rate involved with isotopic disequilibrium. In this context, we contend that faster calcification during younger stages should occur in Gr. truncatulinoides as well, which would cause the positive correlation of δ13C and δ18O observed.
On the other hand, Spero et al. (Reference Spero, Bijma, Lea and Bemis1997) documented that change in the carbonate ion concentration, hence pH variation, can generate a positive correlation between δ13C and δ18O. However, the isotopic variation observed in our results cannot be explained by the pH range of the seawater expected during the ontogeny of Recent foraminifers analyzed (Spero et al. Reference Spero, Bijma, Lea and Bemis1997; Pelejero et al. Reference Pelejero, Calvo and Hoegh-Guldberg2010).
Conclusion and Implications
On the basis of our stable isotopic results, we are able to divide the three species analyzed into two groups. The first group is composed of the symbiotic species, Gs. conglobatus and Gs. sacculifer; in this group, δ13C increases with foraminiferal growth and δ18O tends to be negative and relatively constant. The other group consists of asymbiotic Gr. truncatulinoides and is characterized by more negative δ13C and more positive δ18O values and a positive linear correlation between δ13C and δ18O (Fig. 4). This isotopic distribution pattern is consistent with the simplified criteria proposed by Norris (Reference Norris1996) for distinguishing foraminifers with photosymbiotic ecology, though Norris (Reference Norris1996) used the sieve-fraction method in his analysis, instead of the test-dissection method used here. In addition, although foraminifers show intraspecies variations to some extent, our single-individual analyses confirmed that each individual in the same species shares the same trend in ontogenetic δ13C and δ18O signals. Additionally, interspecies isotopic signatures show isotopic segregation on the basis of the photosymbiotic nature of a given species.
One great advantage of our method is that the isotopic profile through ontogeny can be extracted from only a single individual. As a result, even rare species can be analyzed. In the sieve-fraction method, it can be difficult to distinguish smaller adults from larger adolescents, and individuals grown in different seasons are possibly mingled in a single analysis. In contrast, our method excludes these potential sources of noise. Thus, our chamber-dissection method can extract a genuine ontogenetic isotope series from a very short time slice without unnecessary noise, providing a much clearer signature of fossil algal photosymbiosis.
Moreover, the great difference between our method and the conventional sieve-fraction method is that our method can reveal intraspecies variation as well. Averaging season and age variations by analyzing many specimens in one analysis is certainly important for paleoenvironmental works intended to investigate large-scale trend in geologic time, and what is more, it is less time-consuming. However, when it comes to detailed species paleoecology, such as photosymbiosis, ontogenetic migration history, or living season, intraspecies variation and ontogenetic trends can provide important information that is never obtained by the sieve-fraction method. Using our method, one can extract as much information as possible from a single specimen.
In addition to isotopic analyses, chamber-by-chamber analyses of other proxies, such as the Mg/Ca ratio paleothermometer, would provide information about where in the water column foraminifers secrete chambers. Such basic ecological knowledge is crucial when foraminiferal isotopic information is to be used for paleoceanographic reconstruction. Meanwhile, our results should be supplemented by quantitative information obtained from culture experiments. Extrapolation from experimental results would maximize the utility of ontogenetic isotopic data and improve our understanding of the evolution of foraminiferal photosymbiotic ecology.
Acknowledgments
This study used samples from the Integrated Ocean Drilling Program; we thank the shipboard party of IODP Expedition 330. We appreciate L. de Nooijer and an anonymous reviewer for critical and fruitful comments. This study was supported by Waseda University grants (2011B-052 to Hirano, and 2011B-65 and -66 to Moriya), the Mitsui & Co., Ltd. Environment Fund (R08-C019-r to Moriya), and JSPS KAKENHI Grants (24654169 to Moriya, 21740367 to Ishimura, 24244090 to Suzuki, 22224009 to Kawahata, and 13J05477 to Takagi). The graphs were drawn with Generic Mapping Tools (Wessel and Smith Reference Wessel and Smith1998). Supplementary oceanographic data were referred from the International Argo Program and the national programs that contribute to it (http://www.argo.ucsd.edu, http://argo.jcommops.org.; the Argo Program is part of the Global Ocean Observing System), and World Ocean Database 2009 (http://www.nodc.noaa.gov/OC5/WOD09/pr_wod09.html).
Supplementary Material
Supplemental materials deposited at Dryad: doi:10.5061/dryad.p32p0