INTRODUCTION
The Tibetan Plateau is often referred to “Asia’s Water Tower” as it hosts continental glaciers of a size exceeded only by those of Antarctica and Greenland. Almost all of the major rivers in East and South Asia originate from the glaciers on the Tibetan Plateau, which provide freshwater resources to more than one-third of the world’s population (Immerzeel, Reference Immerzeel2008; Immerzeel et al., Reference Immerzeel, Beek, Van and Bierkens2010). Therefore, the future behavior of the glaciers on the Tibetan Plateau is of great importance given their potential effects on the region’s hydrology and thus the human population. Over the past few decades, glacier accumulation on the Tibetan Plateau has been affected by changing precipitation patterns (Yao et al., Reference Yao, Thompson, Yang, Yu, Gao, Guo, Yang, Duan, Zhao and Xu2012). In the southern and eastern Tibetan Plateau, the glaciers have retreated as a result of the decreased influence of monsoonal precipitation, whereas glacier accumulation in the western Tibetan Plateau (WTP) has increased because of the climatic influence of the midlatitude westerlies (Yao et al., Reference Yao, Thompson, Yang, Yu, Gao, Guo, Yang, Duan, Zhao and Xu2012). In addition to precipitation, temperature also plays a critical role in the stability of these glaciers (Bradley et al., Reference Bradley, Vuille, Diaz and Vergara2006). Meteorological observations on the Tibetan Plateau over the past few decades provide evidence of more pronounced regional warming compared with the global average (Liu et al., Reference Liu, Cheng, Yan and Yin2009), which is consistent with climate modeling results that indicate that temperature varies more significantly at higher elevations than at lower elevations (Bradley et al., Reference Bradley, Keimig and Diaz2004, Reference Bradley, Vuille, Diaz and Vergara2006). Clearly, an increased number of long, continuous, and quantitative paleotemperature records are essential for understanding past changes in the glaciers on the Tibetan Plateau.
The climate of the Tibetan Plateau is influenced by the East Asian monsoon, the Indian monsoon, and the midlatitude westerlies. The extent of monsoonal influence on the Tibetan Plateau is modulated by the average position of the midlatitude westerly jet (Schiemann et al., Reference Schiemann, Lüthi and Schär2009; Chiang et al., Reference Chiang, Fung, Wu, Cai, Edman, Liu, Day, Bhattacharya, Mondal and Labrousse2015). Combining precipitation isotope records and temperature records is likely to be important for understanding changes in the extent of monsoonal influence on the Tibetan Plateau. In addition, there is debate about Holocene temperature variations between proxy indicators and models. The former show temperature gradually decreased during the Holocene, contrary to the simulated warming results. The significant discrepancy between the reconstructed cooling and simulated warming reflect the “Holocene temperature conundrum” (Liu et al., Reference Liu, Zhu, Rosenthal, Zhang, Otto-Bliesner, Timmermann, Smith, Lohmann, Zheng and Timm2014). Because the Tibetan Plateau is very sensitive to climate change, quantitative temperature records are likely to shed light on the “Holocene temperature conundrum” (Liu et al., Reference Liu, Zhu, Rosenthal, Zhang, Otto-Bliesner, Timmermann, Smith, Lohmann, Zheng and Timm2014).
Over the past few decades, several biomarkers have been adopted to quantitatively reconstruct temperature variability in lacustrine sediments, such as the glycerol dialkyl glycerol tetraethers (GDGTs)–based proxies TEX86 (the relative distribution of cyclopentane rings in isoprenoid GDGTs), MBT (the methylation of branched GDGTs [brGDGTs]), and CBT (the cyclization ratio of brGDGTs) and the alkenone proxies
 $$U_{{37}} ^{k} ,\,U_{{37}} ^{{k'}} {\rm \,and}\,U_{{37}} ^{{ks}} $$
(Günther et al., Reference Günther, Thiele, Gleixner, Xu, Yao and Schouten2014; Wang et al., Reference Wang, Liu, Zhang, Fu and An2015; Hou et al., Reference Hou, Huang, Zhao, Liu, Colman and An2016). Although there is debate regarding the source of the brGDGTs (Blaga et al., Reference Blaga, Reichart, Schouten, Lotter, Werne, Kosten, Mazzeo, Lacerot and Sinninghe Damsté2010; Loomis et al., Reference Loomis, Russell and Sinninghe Damsté2011), the brGDGT-based proxies MBT and CBT have been demonstrated to correlate with air temperature and soil pH, respectively (Weijers et al., Reference Weijers, Schouten, van den Donker, Hopmans and Sinninghe Damsté2007c; Zink et al., Reference Zink, Vandergoes, Mangelsdorf, Dieffenbacher-Krall and Schwark2010; Pearson et al., Reference Pearson, Juggins, Talbot, Weckström, Rosén, Ryves, Roberts and Schmidt2011; Sun et al., Reference Sun, Chu, Liu, Xie, Li, Ling, Wang, Shi, Jia and Lü2011; Günther et al., Reference Günther, Thiele, Gleixner, Xu, Yao and Schouten2014). Subsequently, the MBT index was simplified to MBT′ (Peterse et al., Reference Peterse, van der Meer, Schouten, Weijers, Fierer, Jackson, Kim and Sinninghe Damsté2012). MBT/MBT′ and CBT have been adopted to reconstruct mean annual temperature variability as the soil bacteria that produce them are able to survive throughout the year (Weijers et al., Reference Weijers, Schouten, Hopmans, Geenevasen, David, Coleman, Pancost and Sinninghe Damsté2006, Reference Weijers, Schouten, Sluijs, Brinkhuis and Sinninghe Damsté2007b, Reference Weijers, Schouten, van den Donker, Hopmans and Sinninghe Damsté2007c). Calibration between brGDGT indices and mean annual air temperature (MAAT) has been established by studying lake surface sediments on the Tibetan Plateau (Günther et al., Reference Günther, Thiele, Gleixner, Xu, Yao and Schouten2014). In this study, we present records of temperature based on measurement of GDGTs and precipitation hydrogen isotopes based on sedimentary leaf waxes from the same Holocene sediment core from Aweng Co on the western side of the Tibetan Plateau. Combining temperature and precipitation isotope records from the same sediment core avoids problems caused by possible age offsets when synthesizing records obtained from different cores and sites. This article presents the first long, continuous, and quantitative temperature and precipitation isotope records from lake sediments on the WTP. The principal aims of the research are (1) to improve our understanding of the influence of the Indian summer monsoon and the midlatitude westerlies on the WTP during the Holocene; (2) to investigate the variation of mean annual temperature on the WTP, which currently is heavily biased toward winter temperature; and (3) to understand the nature of hydrologic changes on the WTP during the Holocene. The records of Aweng Co not only provide a picture of the hydrologic and thermal history of the WTP, but have also led to rethinking the impact of seasonality on proxy indicators. Furthermore, the quantitative temperature reconstruction can help to improve the accuracy of the climate models.
MATERIALS AND METHODS
Study site and sampling
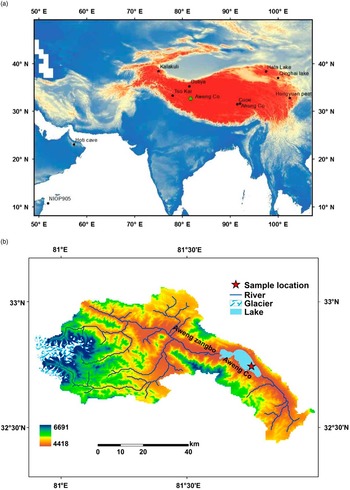
Aweng Co (32°42′N–32°49′N, 81°38′E–81°48′E; 4427 m above sea level) is a closed carbonate-type saline lake located in Rutog County on the WTP. The lake has an area of 58.6 km2, a maximum depth of 6 m, and a watershed area of 1750 km2. The regional climate is classified as alpine subfrigid and is within the semiarid monsoon zone (Wang and Dou, Reference Wang and Dou1998). A survey of the lake in 2012 indicated that the salinity of the surface lake water was 27.65 g/L, increasing to 28.16 g/L at the bottom. The pH of the lake water is 9.2. The lake is fed mainly by precipitation and by the Aweng Zangbo River, which originates from glacial meltwater. Records from a nearby meteorological station (Shiquanhe Town, data from 2011 to 2014) show that modern precipitation in the region is monsoonal, and that summer rainfall accounts for more than 80% of total annual precipitation. The only prior paleolimnological work at the site was a study of the vertical distribution of the bacterial community along a 20 cm gravity sediment core (Shi et al., Reference Shi, Sun, Liu, Hou, Zhu and Chu2014).
In 2011, a 567-cm-long sediment core, designated AWC2011-2, was retrieved using a UWITEC piston corer from a water depth of 4 m from the southeastern part of the lake (Fig. 1). The core was subsampled continuously at an interval of 1 cm, and all the samples were stored in a freezer prior to laboratory analysis.
(color online) (a) Location of Aweng Co and other records mentioned in the text. (b) Catchment of Aweng Co.

Chronology
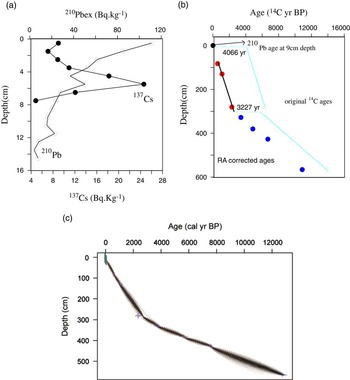
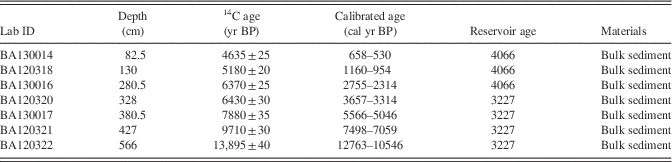
Chronological control for core AWC2011-2 is based on 210Pb and 137Cs measurements of the uppermost 15 cm of the core, together with seven accelerator mass spectrometry (AMS) radiocarbon ages from the lower part of the core (Table 1). Because of the lack of terrestrial macrofossils, the AMS ages were obtained from bulk organic carbon. The depth of 9 cm was assigned an age of AD 1950 based on the 210Pb data. The 14C ages indicate that abrupt changes in the sedimentation rate occur at a depth of 309 cm. Changes in sedimentation rate may have an important impact on carbon reservoir ages (Zhou et al., Reference Zhou, Cheng, Jull, Lu, An, Wang, Zhu and Wu2014b), and therefore, the reservoir age may have changed at ~309 cm. Extrapolation of the uppermost three 14C ages to the depth of 9 cm indicated a 14C age of 4066 yr BP, which is regarded as the reservoir age for the sediment above 309 cm. Subsequently, we extrapolated the three 14C ages down to the depth of 309 cm, which yielded a 14C age of 2566 yr BP, while extrapolation of the lower four 14C ages to 309 cm yielded an age of 5793 yr BP. Therefore, we took the difference (3227 yr) between the two ages as the reservoir age below 309 cm. This method of estimating the reservoir age below 309 cm follows the approach of Zhou et al. (Reference Zhou, Cheng, Jull, Lu, An, Wang, Zhu and Wu2014b). Finally, the reservoir age–corrected 14C data were calibrated to calendar ages, and we constructed an age model using the Bacon program (Fig. 2) (Blaauw and Christen, Reference Blaauw and Christen2011). The reservoir ages may have changed significantly in the past (Hou et al., Reference Hou, D’Andrea and Liu2012), and therefore, the chronology for the core is tentative. Consequently, this article focuses on the long-term trends of temperature and precipitation isotope variation.
(color online) Age controls for Aweng Co sediment core AWC2011-2. (a) 210Pb-dating (open circles) and 137Cs-dating (solid circles) results. (b) Original 14C ages. The upper three 14C ages were corrected for an estimated reservoir age of 4066 yr, and the lower four 14C ages by an estimated reservoir age of 3227 yr. Open circles represent measured 14C ages, and solid circles represent 14C ages corrected for reservoir age. (c) Age-depth model for core AWC2012-2 using the “Bacon” program (Blaauw and Christen, Reference Blaauw and Christen2011).

Radiocarbon ages and reservoir age for core AWC2011-2.

Analysis of deuterium-to-hydrogen ratios of sedimentary leaf waxes
Total lipids were extracted from freeze-dried lake sediments using ultrasonication and were further fractionated by flash column chromatography. Approximately 5 g of sediment samples was extracted with dichloromethane and methanol (volume ratio=2:1) for three cycles of 15 min. Total lipid extracts were fractionated into neutral and acid fractions using liquid chromatography LC-NH2 silica gel chromatography, eluted with dichloromethane:isopropanol (2:1 [v:v]) and ether:acetic acid (96:4 [v:v]), respectively. The acid fraction was methylated using anhydrous 2% HCl in methanol. Hydroxyl acids were removed using silica gel column chromatography (with dichloromethane as the solvent) to further purify the fatty acid methyl esters and avoid chromatographic coelution. Quantification and identification were carried out using gas chromatography and gas chromatography–mass spectrometry. An HP 6890 chromatograph interfaced to a Finnigan Delta+ XL stable isotope mass spectrometer through a high-temperature pyrolysis reactor was used for hydrogen isotopic analysis. The H3+ factor was determined daily prior to sample analysis (average values of 2.0 during this study). The precision (1σ) of triplicate analyses was <2‰. The accuracy was routinely checked by injection of laboratory isotopic standards between every six measurements. The δD values obtained for individual acids (as methyl esters) were corrected by mathematically removing the isotopic contributions from the added group. The δD value of the added methyl group was determined by acidifying and then methylating (together with the samples) the disodium salt of succinic acid with a predetermined δD value (Huang et al., Reference Huang, Shuman, Wang and Webb2002).
Analysis of GDGTs
Total lipids were extracted using ultrasonication and were further fractionated by flash column chromatography. Approximately 5 g of sediment samples was extracted with dichloromethane and methanol (volume ratio=2:1) for three cycles of 15 min. Total lipid extracts were further chromatographed into several fractions. We used activated (for 2 h at 150°C) Al2O3 as the stationary phase and hexane:dichloromethane (9:1, 4 column volumes) to elute the nonpolar fraction and dichloromethane:methanol (1:1, 3 column volumes) to elute the polar fraction containing the GDGTs. After evaporation of the solvents, the polar fraction was redissolved in a high-performance liquid chromatography (HPLC)–grade mixture of hexane:isopropanol (99:1) at a concentration of 2 mg/mL. The dissolved polar fraction was finally filtered through a 0.4 μm Polytetrafluoroethylene (PTFE) filter attached to a 1 mL syringe.
GDGT analysis was performed using HPLC–atmospheric-pressure chemical ionization–mass spectrometry (APCI-MS) (Agilent 1260 HPLC, MS: 6100). Separation was done on a Grace Prevail Cyano (150×2.1 mm, 3 μm), maintained at 40°C. Sample injection volume was 20 μL. GDGTs were eluted with 90% A and 10% D for 5 min, followed by a linear gradient to 18% D in 45 min, where A is Hexane (Hex) and D is Hex: isopropanol (IPA)=9:1. Detection was achieved using APCI-MS. Conditions were as follows: nebulizer pressure 60 psi, vaporizer temperature 400°C, flow rate of drying gas 6 L/min and temperature 200°C, capillary voltage 3600 V, and corona 5.5 μA. GDGTs were detected by selected ion monitoring. Quantification of GDGT compounds was achieved by integrating the areas of the [M+H]+ peaks and comparing them with an external standard curve composed of known GDGTs.
RESULTS
Temperature variability during the past 12 ka
We used a recently developed calibration between MAAT and MBT′/CBT (Günther et al., Reference Günther, Thiele, Gleixner, Xu, Yao and Schouten2014) to reconstruct the estimated MAAT variation at Aweng Co, as follows:
 $$\eqalignno{&{\rm MAAT {\,\equals\,}}{\minus}{\rm 3}{\rm .84{\plus}9}{\rm .84{\asterisk}}\,{\rm CBT{\plus}5}{\rm .92{\asterisk}}\,{\rm MBT'} \cr& \left( {R^{{\rm 2}} {\rm {\,\equals\,} 0}{\rm .59,}\,{\rm root{\minus}mean{\minus}square}\,{\rm error{\,\equals\,}1}{\rm .2^{\circ}C}} \right){\rm ,}$$
where
 $$MBT'{\,\equals\,}{{Ia{\plus}Ib{\plus}Ic} \over \displaystyle {Ia{\plus}Ib{\plus}Ic{\plus}IIa{\plus}IIb{\plus}IIc{\plus}IIIa}}$$
 $$CBT{\,\equals\,}{\minus}{\rm log}\left( {{{Ib{\plus}IIb} \over {Ia{\plus}IIa}}} \right)$$
(Roman numerals in the equations after Peterse et al., 2012.)
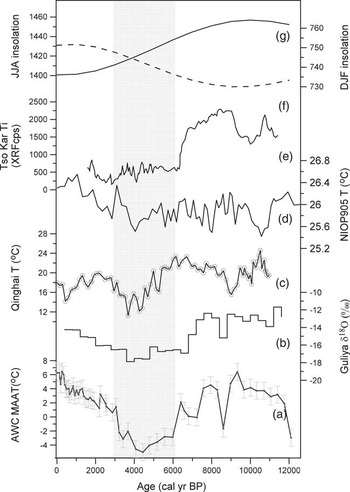
Our reconstructed MAAT record at Aweng Co fluctuates between −5°C and 6.5°C, suggesting that temperature varied significantly during the Holocene on the WTP (Fig. 3). Note that the transfer function involves a temperature uncertainty of 1.2°C. From 12 to 9 ka, the MAAT increased gradually from −3°C to 6.4°C and then commenced a generally decreasing trend until 3 ka. After the cool interval between 6 and 3 ka, which is 3°C to ~4°C lower than during both the early and late Holocene, MAAT gradually increased to the current level (Fig. 3).
Precipitation isotope variations over the past 9.8 ka
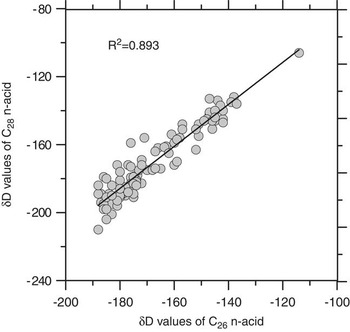
We measured deuterium-to-hydrogen (D/H) ratios for long-chain n-alkanoic acids at the sediment core AWC2011-2. Because the abundances of C30 n-acids for most samples were very low, which may yield unrealistic D/H ratios, we present the D/H ratios of the C26 and C28 n-acids. The δD values of C26 and C28 n-acids are strongly correlated (R 2=0.89; Fig. 4), suggesting that both were produced by terrestrial plants. We calculated weighted average δD values of C26 and C28 n-acids (δDwax) based on their abundance, in order to minimize the potential bias in isotope ratios between woody and herbaceous plants (Hou et al., Reference Hou, D’Andrea, MacDonald and Huang2007; Sachse et al., Reference Sachse, Billault, Bowen, Chikaraishi, Dawson, Feakins and Freeman2012; Li et al., Reference Li, Liang, Hou and Zhang2015). The δDwax fluctuated significantly over the past 10 ka, ranging from −199‰ to −110‰ (Fig. 3). δDwax was relatively low between 6 and 9 ka and then maintained generally higher values between 2.5 and 6 ka. During the past 2.5 ka, the δDwax values were rather lower, averaging −182‰.
Holocene temperature records. (a) Glycerol dialkyl glycerol tetraether–inferred temperature record from Aweng Co (AWC). (b) δ18O records from the Guliya ice core (Thompson et al., Reference Thompson, Yao, Davis, Henderson, Mosley-Thompson, Lin, Beer, Synal, Cole-Dai and Bolzan1997). (c) Alkenone-based temperature record from Qinghai Lake (Hou et al., Reference Hou, Huang, Zhao, Liu, Colman and An2016). (d) Alkenone-based temperature record from core NIOP905 core from the western Arabian Sea (Huguet et al., Reference Huguet, Kim, Sinninghe Damsté and Schouten2006). (e) Ti concentration from Tso Kar (Wünnemann et al., Reference Wünnemann, Demske, Tarasov, Kotlia, Reinhardt, Bloemendal, Diekmann, Hartmann, Krois and Riedel2010). (f) Mean winter (DJF) insolation at 30°N (Laskar et al., Reference Laskar, Robutel, Joutel, Gastineau, Correia and Levrard2004). (g) Mean summer (JJA) insolation at 30°N (Laskar et al., Reference Laskar, Robutel, Joutel, Gastineau, Correia and Levrard2004). MAAT, mean annual air temperature; XRF, X-ray fluorescence.

Relationship between the δD values of C26 and C28 n-alkanoic acids in the sediment core from Aweng Co.

DISCUSSION
MBT′-CBT indices as a proxy for MAAT
GDGT-based proxies, such as TEX86, MBT, and CBT indices, are increasingly used as proxies for paleotemperature reconstruction in marine and lake environments (Schouten et al., Reference Schouten, Hopmans, Forster, van Breugel, Kuypers and Sinninghe Damsté2003; Powers et al., Reference Powers, Johnson, Werne, Castañeda, Hopmans, Sinninghe Damsté and Schouten2005; Blaga et al., Reference Blaga, Reichart, Heiri and Sinninghe Damsté2009; Tierney and Russell, Reference Tierney and Russell2009; Loomis et al., Reference Loomis, Russell and Sinninghe Damsté2011; Wang et al., Reference Wang, Liu, Zhang, Wang, Wang, Liu and Dong2012; Liu et al., Reference Liu, Wang, Zhang, Liu and He2013; Foster et al., Reference Foster, Pearson, Juggins, Hodgson, Saunders, Verleyen and Roberts2016). TEX86 likely works well in marine and very large lakes with high proportions of isoprenoid GDGTs. However, in medium and small lakes, the abundance of isoprenoid GDGTs is very low, and thus the use of TEX86 is often not applicable (Blaga et al., Reference Blaga, Reichart, Schouten, Lotter, Werne, Kosten, Mazzeo, Lacerot and Sinninghe Damsté2010; Powers et al., Reference Powers, Werne, Vanderwoude, Sinninghe Damsté, Hopmans and Schouten2010). However, brGDGTs are ubiquitous in lake sediments and have great potential as a continental paleothermometer (Blaga et al., Reference Blaga, Reichart, Heiri and Sinninghe Damsté2009; Sinninghe Damsté et al., Reference Sinninghe Damsté, Ossebaar, Abbas, Schouten and Verschuren2009; Tierney and Russell, Reference Tierney and Russell2009). brGDGTs were initially thought to be produced mainly by soil bacteria (Weijers et al., Reference Weijers, Schouten, van den Donker, Hopmans and Sinninghe Damsté2007c, Reference Weijers, Blaga, Werne and Sinninghe Damsté2009); however, further studies suggested in situ production of brGDGTs within lake systems (Sinninghe Damsté et al., Reference Sinninghe Damsté, Ossebaar, Abbas, Schouten and Verschuren2009; Tierney and Russell, Reference Tierney and Russell2009; Blaga et al., Reference Blaga, Reichart, Schouten, Lotter, Werne, Kosten, Mazzeo, Lacerot and Sinninghe Damsté2010; Tierney et al., Reference Tierney, Russell, Eggermont, Hopmans, Verschuren and Damsté2010; Loomis et al., Reference Loomis, Russell and Sinninghe Damsté2011). Blaga et al. (Reference Blaga, Reichart, Schouten, Lotter, Werne, Kosten, Mazzeo, Lacerot and Sinninghe Damsté2010) suggested that the mixed sources of the brGDGTs in lakes may influence the accuracy of MBT/CBT as proxies for temperature. However, despite their mixed sources, the distributions of brGDGTs has been demonstrated to be mainly influenced by temperature and pH (Zink et al., Reference Zink, Vandergoes, Mangelsdorf, Dieffenbacher-Krall and Schwark2010; Pearson et al., Reference Pearson, Juggins, Talbot, Weckström, Rosén, Ryves, Roberts and Schmidt2011; Sun et al., Reference Sun, Chu, Liu, Xie, Li, Ling, Wang, Shi, Jia and Lü2011; Günther et al., Reference Günther, Thiele, Gleixner, Xu, Yao and Schouten2014). Therefore, we adopted the MBT/CBT proxy as a quantitative proxy for past temperature changes. However, the temperature uncertainty is no less than 1.2°C because of the scatter inherited in the transfer function, error in measurements, and integration.
It has been demonstrated that the MBT-CBT indices are not biased to particular seasonal temperatures, and they likely reflect mean annual soil temperature (Weijers et al., Reference Weijers, Schouten, van den Donker, Hopmans and Sinninghe Damsté2007c, Reference Weijers, Bernhardt, Peterse, Werne, Dungait, Schouten and Sinninghe Damsté2011), which has been used as a potential proxy for MAAT (Weijers et al., Reference Weijers, Schefuß, Schouten and Sinninghe Damsté2007a, Reference Weijers, Schouten, Sluijs, Brinkhuis and Sinninghe Damsté2007b; Schouten et al., Reference Schouten, Baas, Hopmans and Sinninghe Damsté2008; Tierney and Russell, Reference Tierney and Russell2009; Pearson et al., Reference Pearson, Juggins, Talbot, Weckström, Rosén, Ryves, Roberts and Schmidt2011). An investigation into the turnover time of brGDGTs in soils showed that they have a turnover time of ~17 yr, implying that the brGDGT-based proxies should reflect long-term temperature variations (Weijers et al., Reference Weijers, Wiesenberg, Bol, Hopmans and Pancost2010). Moreover, the transfer function for MBT′/CBT has been established via a comparison with MAAT (Günther et al., Reference Günther, Thiele, Gleixner, Xu, Yao and Schouten2014). Therefore, we consider that our MBT′/CBT-based temperature at Aweng Co reflects changes in annual temperature on the WTP. It should be noted here that recently improved chromatography techniques enable us to separate the 5- and 6-methyl brGDGTs (De Jonge et al., Reference De Jonge, Hopmans, Zell, Kim, Schouten and Sinninghe Damsté2014). The abundance of 6-methyl brGDGTs is well correlated with soil pH, and the exclusion of 6-methyl brGDGTs leads to a better correlation between MBT′ and MAAT (De Jonge et al., Reference De Jonge, Hopmans, Zell, Kim, Schouten and Sinninghe Damsté2014; Yang et al., Reference Yang, Lu, Ding, Lei, Dang and Xie2015). Although we did not discriminate 5- and 6-methyl brGDGTs in our measurements in 2014, we believe that our brGDGT-based temperature records should capture the long-term trend of temperature variation at Aweng Co.
Variation of MAAT at Aweng Co during the past 12 ka
The MAAT at Aweng Co generally decreased from the early to middle Holocene, which is similar to most of the temperature records from the Tibetan Plateau and may be the result of the decreasing summer insolation (Fig. 3). The δ18O record of the Guliya ice core is considered to reflect past temperature variations (Thompson et al., Reference Thompson, Yao, Davis, Henderson, Mosley-Thompson, Lin, Beer, Synal, Cole-Dai and Bolzan1997). It indicates high temperatures during the early Holocene followed by a decrease to low temperatures during the middle Holocene. Overall, this pattern of Holocene temperature variation is very similar to the Aweng Co MAAT record. The titanium concentration record at Tso Kar, which reflects changing detrital fluxes from the catchment into the lake, is strongly linked to glacier melting (Wünnemann et al., Reference Wünnemann, Demske, Tarasov, Kotlia, Reinhardt, Bloemendal, Diekmann, Hartmann, Krois and Riedel2010). The record indicates a high lake level during the early Holocene as a result of enhanced glacier melting because of high temperatures, and a lower lake level during the middle Holocene and hence less glacier melting because of low temperatures. Two recent alkenone-based temperature records from Lake Qinghai also suggest a cooling trend from the early to the middle Holocene (Wang et al., Reference Wang, Liu, Zhang, Fu and An2015; Hou et al., Reference Hou, Huang, Zhao, Liu, Colman and An2016). The similarity of these records suggests that they reflect the same climatic forcing—that is, decreasing summer insolation in the Northern Hemisphere during the early to middle Holocene (Fig. 3).
However, the late Holocene part of the MAAT record from Aweng Co differs from the records from monsoonal regions (Fig. 3) in that it increases gradually to the present. This pattern resembles the alkenone-based temperature record in sediment core NIOP905 from the Somalia Basin in the western Arabian Sea (Huguet et al., Reference Huguet, Kim, Sinninghe Damsté and Schouten2006). Aweng Co and the Somalia Basin belong to the same climate system (Chen, D., personal communication, 2016). Temperature proxies could potentially be biased because of different growing seasons of the biomarker source organisms (Huguet et al., Reference Huguet, Kim, Sinninghe Damsté and Schouten2006). Seasonal variations in phytoplankton production are less pronounced in tropical low latitudes, and a data–model comparison study suggests that the Holocene warming in the tropics was attributable to the increasing boreal winter insolation (Lorenz et al., Reference Lorenz, Kim, Rimbu, Schneider and Lohmann2006). Thus, the alkenone-based late Holocene temperature increase in core NIOP905 was attributed to the orbitally driven insolation increase during the boreal winter. Note the nearby meteorological station (Shiquanhe, data from 2011 to 2014) indicates that monthly average temperatures at or below 0°C in this region last for 7 months. Therefore, the MAAT record from Aweng Co was largely modulated by winter temperature. We consider that the late Holocene warming at Aweng Co may be attributed to increasing winter temperature in response to increasing winter insolation. Changes in the seasonality between summer and winter insolation, caused by the changing Earth orbital parameters, is one of the most important forcing mechanisms of Holocene climate change (Lorenz et al., Reference Lorenz, Kim, Rimbu, Schneider and Lohmann2006). During the early Holocene (12–6 ka) when summer insolation in the Northern Hemisphere was relatively high, the MAAT record at Aweng Co would likely be biased by summer insolation. During the middle Holocene (6–3 ka), when summer insolation decreased and winter insolation gradually increased, the MAAT record decreased significantly, suggesting that the MAAT was less biased toward summer insolation. The middle Holocene cooling on the WTP is confirmed by the Paleoclimate Modelling Intercomparison Project Phase II models, which generated much colder than modern winter temperatures and relatively lower mean annual temperatures over the WTP because of seasonal changes in insolation in the Northern Hemisphere (Jiang et al., Reference Jiang, Lang, Tian and Wang2012). As the insolation seasonality decreased during the late Holocene, MAAT in the Aweng Co gradually increased (Fig. 3).
Hydrologic changes at Aweng Co during the Holocene
Terrestrial higher plants are the dominant source of long-chain n-alkanoic acids (C26, C28, and C30) in lake sediments, and their δD values reflect changes in the δD of continental precipitation (δDp) (Huang et al., Reference Huang, Shuman, Wang and Webb2004; Sachse et al., Reference Sachse, Radke and Gleixner2006; Hou et al., Reference Hou, D’Andrea and Huang2008; Tierney et al., Reference Tierney, Russell, Huang, Damste, Hopmans and Cohen2008; Garcin et al., Reference Garcin, Schwab, Gleixner, Kahmen, Todou, Séné, Onana, Achoundong and Sachse2012; Guenther et al., Reference Guenther, Aichner, Siegwolf, Xu, Yao and Gleixner2013). Investigations of modern precipitation isotopes suggest that in the south and eastern Tibetan Plateau, which is mainly influenced by the monsoon, the δDp variation reflects changes in precipitation amount. In contrast, in the north and western Tibetan Plateau, which is influenced by the midlatitude westerlies, the δDp variation is mainly affected by temperature (Tian et al., Reference Tian, Yao, MacClune, White, Schilla, Vaughn, Vachon and Ichiyanagi2007; Gao et al., Reference Gao, Masson-Delmotte, Yao, Tian, Risi and Hoffmann2011; Yao et al., Reference Yao, Masson-Delmotte, Gao, Yu, Yang, Risi and Sturm2013). Data from a nearby meteorological station (Shiquanhe, from 2011 to 2014) show that modern precipitation in the study region is monsoonal, with summer rainfall accounting for more than 80% of the annual total precipitation. A study by Tian et al. (Reference Tian, Yao, MacClune, White, Schilla, Vaughn, Vachon and Ichiyanagi2007) indicates that the northern limit of the summer monsoon is located to the north of the Yalong Zangbo River, in the middle of the Tibetan Plateau, at around 34°N to ~35°N. Based on the study results, we consider that Aweng Co is influenced by the Indian summer monsoon and that the δDp variations at the site mainly reflect changes in precipitation amount.
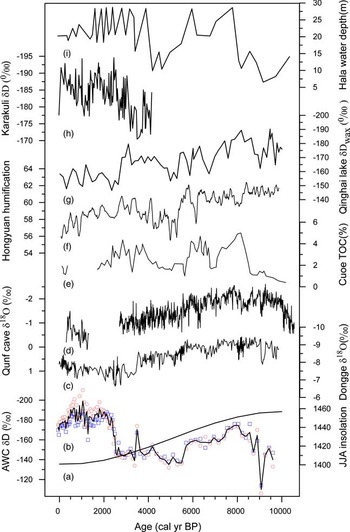
Millennial-scale variations in δDwax at Aweng Co during the early to middle Holocene exhibit features similar to the δ18O record of speleothems from Dongge Cave and Qunf Cave, suggesting a monsoonal influence during the study interval period (Fig. 5) (Dykoski et al., Reference Dykoski, Edwards, Cheng, Yuan, Cai, Zhang, Lin, Qing, An and Revenaugh2005; Fleitmann et al., Reference Fleitmann, Burns, Mangini, Mudelsee, Kramers, Villa and Neff2007). The strong Indian monsoon during the early Holocene from about 9–6 ka brought heavy precipitation to Aweng Co, and the δDwax values were lower. Subsequently, the monsoon weakened at around 6 cal ka BP, and this conclusion is supported by the record of sedimentary total organic carbon content at Cuoe Lake and by the carbonate content of Ahung Co (Morrill et al., Reference Morrill, Overpeck, Cole, Liu, Shen and Tang2006; Wu et al., Reference Wu, Lücke, Jin, Wang, Schleser, Battarbee and Xia2006). The humification index record from the Hongyuan peatland, reflecting the degree of peat decomposition, is strongly influenced by local conditions of wetness and temperature and is commonly used as a proxy for the intensity of the Indian summer monsoon (Wang et al., Reference Wang, Hong, Zhu, Hong, Lin, Xu, Leng and Mao2004; Yu et al., Reference Yu, Zhou, Franzen, Xian, Cheng and Jull2006). During the early to middle Holocene, a decrease in the degree of humification of the Hongyuan peatland suggests a weakening of the Indian summer monsoon, which is similar to the Aweng Co δDwax record. In addition, the δDwax record from Lake Qinghai, which reflects changes in growing season moisture source, also indicates a reduction in summer monsoon precipitation during the Holocene (Thomas et al., Reference Thomas, Huang, Clemens, Colman, Morrill, Wegener and Zhao2016).
Comparison of the precipitation isotope records from Aweng Co (AWC) with records of monsoonal variation since 10 ka. (a) Summer insolation (JJA) at 30°N (Laskar et al., Reference Laskar, Robutel, Joutel, Gastineau, Correia and Levrard2004). (b) Hydrogen isotope record of n-alkanoic acids at Aweng Co (red open circles represent C28 n-alkanoic acids, blue diamonds represent C26 n-alkanoic acids, and the solid line is the weighted average). (c) δ18O record from Dongge Cave (Dykoski et al., Reference Dykoski, Edwards, Cheng, Yuan, Cai, Zhang, Lin, Qing, An and Revenaugh2005). (d) δ18O record from Qunf Cave (Fleitmann et al., Reference Fleitmann, Burns, Mangini, Mudelsee, Kramers, Villa and Neff2007). (e) Total organic carbon (TOC) content at Cuoe Lake (Wu et al., Reference Wu, Lücke, Jin, Wang, Schleser, Battarbee and Xia2006). (f) Humification index at Hongyuan peatland (Yu et al., Reference Yu, Zhou, Franzen, Xian, Cheng and Jull2006). (g) Hydrogen isotope record of n-alkanoic acids from Lake Qinghai (Thomas et al., Reference Thomas, Huang, Clemens, Colman, Morrill, Wegener and Zhao2016). (h) Hydrogen isotope record of n-alkanoic acids from Lake Karakuli (Aichner et al., Reference Aichner, Feakins, Lee, Herzschuh and Liu2015). (i) Estimated water depth changes in Hala Lake (Yan and Wünnemann, Reference Yan and Wünnemann2014). (For interpretation of the references to color in this figure legend, the reader is referred to the web version of this article.)

In addition to changes in summer monsoon intensity, the meridional displacement of the seasonal cycle of the midlatitude westerlies relative to the present day may also influence precipitation δD (Nagashima et al., Reference Nagashima, Tada, Tani, Sun, Isozaki, Toyoda and Hasegawa2011; Kana et al., Reference Kana, Ryuji and Shin2013; Chiang et al., Reference Chiang, Fung, Wu, Cai, Edman, Liu, Day, Bhattacharya, Mondal and Labrousse2015). During the early Holocene when the summer insolation was high, the midlatitude westerly jet shifted northward onto the Tibetan Plateau earlier in the summer, suggesting an earlier northward transition of the summer monsoon and a longer summer monsoon season (Chiang et al., Reference Chiang, Fung, Wu, Cai, Edman, Liu, Day, Bhattacharya, Mondal and Labrousse2015). The longer summer monsoon season probably brought more precipitation to Aweng Co. Later, during the middle Holocene when summer insolation weakened, the summer season was relatively short and the monsoon influence was probably weak on the Tibetan Plateau, thereby bringing less precipitation to Aweng Co.
Most of the records indicate that the summer monsoon further weakened during the late Holocene. For example, a phase of drying after 3 ka at Cuoe Lake indicates that the influence of the Indian monsoon diminished in that region during the late Holocene (Wu et al., Reference Wu, Lücke, Jin, Wang, Schleser, Battarbee and Xia2006). Sedimentological and δDwax data from Paru Co (southeastern Tibetan Plateau) provide a Holocene perspective of Indian summer monsoon, and the results indicate that the summer monsoon trended toward drier conditions to the present since 5.2 ka (Bird et al., Reference Bird, Polisar, Lei, Thompson, Yao, Finney, Bain, Pompeani and Steinman2014). Besides, the δ18O record of speleothems from Dongge Cave and Qunf Cave, the carbonate content of Ahung Co, the humification index record from the Hongyuan peatland, and the δDwax record from Lake Qinghai all suggest a long-term trend of decreased monsoon intensity during the Holocene (Fleitmann et al., Reference Fleitmann, Burns, Mudelsee, Neff, Kramers, Mangini and Matter2003, Reference Fleitmann, Burns, Mangini, Mudelsee, Kramers, Villa and Neff2007; Wang et al., Reference Wang, Hong, Zhu, Hong, Lin, Xu, Leng and Mao2004; Dykoski et al., Reference Dykoski, Edwards, Cheng, Yuan, Cai, Zhang, Lin, Qing, An and Revenaugh2005; Morrill et al., Reference Morrill, Overpeck, Cole, Liu, Shen and Tang2006; Thomas et al., Reference Thomas, Huang, Clemens, Colman, Morrill, Wegener and Zhao2016). However, the δD values at Aweng Co exhibit an abrupt decrease at ~3 ka. Clearly, this does not reflect the direct influence of summer monsoon rainfall given the scale of the decreased monsoonal influence at that time. In addition, variations in temperature cannot fully explain the observed very large isotopic variability (up to 56‰) in such a short period. Rather, changes in the moisture source probably contributed to the observed hydrogen isotope variations at Aweng Co. During the late Holocene when the monsoon weakened, the midlatitude westerlies would have been able to penetrate into the region (An et al., Reference An, Colman, Zhou, Li, Brown, Jull and Cai2012), supplying precipitation with relatively depleted hydrogen isotope ratios (Yao et al., Reference Yao, Masson-Delmotte, Gao, Yu, Yang, Risi and Sturm2013). This is supported by the δD record of a sediment core from Lake Kalakuli, the values of which were relatively low during the late Holocene suggesting the influence of the midlatitude westerlies (Aichner et al., Reference Aichner, Feakins, Lee, Herzschuh and Liu2015). In addition, records of changing water depth at Hala Lake (in the western Qilian Mountains, Qinghai Province), based on ostracod assemblages, stable isotopes, and sediment geochemical properties from four sediment cores from different water depths, suggest that the late Holocene was characterized by extremely unstable hydrologic conditions and by rapid fluctuations in lake water depth at the site, which were mainly controlled by changes in westerly driven effective moisture (Yan and Wünnemann, Reference Yan and Wünnemann2014) (Fig. 5). Despite the influence of the midlatitude westerlies on Lake Kalakuli and Hala Lake, it is difficult to attribute the lower δDwax values to the westerly precipitation during the late Holocene as temperature increased at the same time. The imprint of the midlatitude westerlies in the Aweng Co precipitation isotope record is unclear based on our current data.
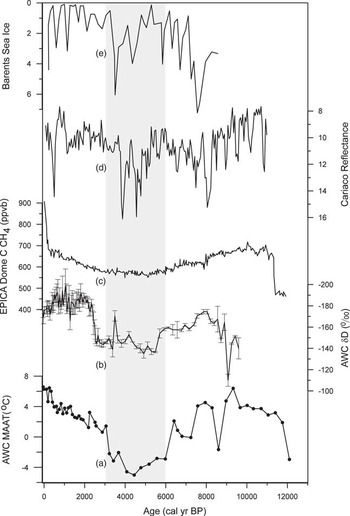
A comparison with the temperature record from Aweng Co indicates that increased temperature, as well as the related glacier melting, may also have contributed to the abrupt decrease of precipitation isotopes at Aweng Co. Elevated temperatures during the late Holocene would have accelerated melting of the local glacier, thus resulting in the increased influx of meltwater to Aweng Co via the Aweng Zangbo River. Previous results have demonstrated isotopic fractionation effects associated with processes of glacier melting (Zhou et al., Reference Zhou, Wang and Joswiak2014a). The stable isotope ratios of glacier ice are usually lower than that of the rainfall because of the low temperature of the precipitation that would result in significant isotopic fractionation. For example, δ18O and δD of precipitation in Nyalam are clearly more enriched than that of the nearby Dasuopu glacier, Xixiabangma (Tian et al., Reference Tian, Yao, White, Yu and Wang2005). In addition, the higher atmospheric CH4 concentration during the late Holocene supports the glacier melting hypothesis (Fig. 6). Thus, the observed decreased precipitation isotopes during the late Holocene may be attributed to the accelerated glacier melting because of the elevated MAAT.
Temperature and hydrologic records from Aweng Co (AWC) compared with records of atmospheric CH4, sediment reflectance from the Cariaco Basin, and sea ice in the Barents Sea. (a) Glycerol dialkyl glycerol tetraether–inferred mean annual air temperature (MAAT) record from Aweng Co. (b) Leaf wax hydrogen isotope record from Aweng Co. (c) Atmospheric methane record from the EPICA Dome C ice core (Loulergue et al., Reference Loulergue, Schilt, Spahni, Masson-Delmotte, Blunier, Lemieux, Barnola, Raynaud, Stocker and Chappellaz2008). (d) Sea ice concentration in the Barents Sea (de Vernal et al., Reference de Vernal, Hillaire-Marcel, Rochon, Fréchette, Henry, Solignac and Bonnet2013). (e) Sediment reflectance in the Cariaco Basin (Peterson et al., Reference Peterson, Haug, Hughen and Röhl2000).

The MAAT variability at Aweng Co resembles the record of CH4 concentration in the European Project for Ice Coring in Antarctica (EPICA) ice cores (Loulergue et al., Reference Loulergue, Schilt, Spahni, Masson-Delmotte, Blunier, Lemieux, Barnola, Raynaud, Stocker and Chappellaz2008), implying that the MAAT variability on the WTP was linked to variations in the concentration of atmospheric CH4. Changes in temperature and in water table variations are the main controls on CH4 emissions (Walter and Heimann, Reference Walter and Heimann2000). Consequently, it has been suggested that high-resolution methane records can be used as a proxy of Northern Hemisphere temperature fluctuations on a millennial scale (Delmotte et al., Reference Delmotte, Chappellaz, Brook, Yiou, Barnola, Goujon, Raynaud and Lipenkov2004; Loulergue et al., Reference Loulergue, Schilt, Spahni, Masson-Delmotte, Blunier, Lemieux, Barnola, Raynaud, Stocker and Chappellaz2008). Changes in temperature resulting in thawing and refreezing of the soil active layer, as well as changes in the extent of seasonal snow cover, all influence CH4 emissions. Variations in rainfall caused by changes in the strength of the monsoon can also lead to variations in atmospheric methane concentration (Ruddiman, Reference Ruddiman2000). A strong monsoon results in heavy rainfall within the region of influence, causing saturation of the ground and increases in the amount of standing water in bogs and creating an environment suitable for generating methane. During the early Holocene, the strong monsoon and the high temperature in the WTP would have contributed to the CH4 emissions as a result of an increase in the areas of standing water and the thawing of frozen soil. During the colder interval of the middle Holocene, large amounts of methane were stored in the frozen ground. The weakened monsoon brought little rainfall to the region, and the dry environment would have reduced the release of CH4 to the atmosphere. The high temperatures and resulting generation of large amounts of meltwater would have thawed the soil resulting in the emission of a large amount of methane to the atmosphere during the late Holocene.
The sediment reflectance record from of the Cariaco Basin, reflecting shifts in the Intertropical Convergence Zone (ITCZ) (Fig. 6) (Peterson et al., Reference Peterson, Haug, Hughen and Röhl2000), indicates that the ITCZ moved southward and that the Indian summer monsoon weakened continuously from 6 to 3 ka. In addition, an abrupt positive shift in the δ18O values of stalagmites at Hoti Cave (northern Oman) at ~6 ka reflects an abrupt southward movement of the ITCZ and a decrease in the dynamics of Indian summer monsoon precipitation (Fleitmann et al., Reference Fleitmann, Burns, Mangini, Mudelsee, Kramers, Villa and Neff2007), which is further supported by a depositional hiatus from 5.2 to 2.5 ka (Fleitmann et al., Reference Fleitmann, Burns, Mangini, Mudelsee, Kramers, Villa and Neff2007). During the middle to late Holocene, the ITCZ migrated southward and monsoonal precipitation gradually decreased.
A coupling of atmospheric and oceanic heat fluxes from the North Atlantic would have affected the extent of sea ice in the Barents Sea (Voronina et al., Reference Voronina, Polyak, Vernal and Peyron2001; de Vernal et al., Reference de Vernal, Hillaire-Marcel, Rochon, Fréchette, Henry, Solignac and Bonnet2013). The observed southward extension of sea ice in the Barents Sea at 3.5 and 4.3 ka (de Vernal et al., Reference de Vernal, Hillaire-Marcel, Rochon, Fréchette, Henry, Solignac and Bonnet2013) indicating an overall decrease in Atlantic water inputs to the Arctic Ocean, which is responsible for climatic amplification in the Northern Hemisphere via the sea ice albedo feedback, had a worldwide climatic effect (Voronina et al., Reference Voronina, Polyak, Vernal and Peyron2001; Renssen et al., Reference Renssen, Goosse and Fifchefet2005, Reference Renssen, Goosse and Muscheler2006; de Vernal et al., Reference de Vernal, Hillaire-Marcel, Rochon, Fréchette, Henry, Solignac and Bonnet2013). The extension of the sea ice possibly indicates cooling in the moisture source region for the midlatitude westerlies that would have potentially reached Aweng Co during the middle Holocene.
CONCLUSIONS
A quantitative temperature record and a precipitation isotope record for the Holocene have been constructed from analysis of MBT′, CBT, and sedimentary leaf waxes at Aweng Co, a small saline lake located on the WTP. The changes in the seasonality of insolation and fluctuations of the Indian monsoon were the major forcing mechanisms of climate change at Aweng Co during the Holocene. Aweng Co experienced a relatively warm and wet early Holocene (10 to ~6 ka), a cool and dry middle Holocene (6 to ~3 ka), and a relatively warm and wet late Holocene. Decreasing summer insolation and a weakened Indian monsoon contributed to the cool and dry middle Holocene. This cool and dry interval reflects a teleconnection with cold events in the North Atlantic Ocean and a southward shift of the ITCZ, as well as a decreased atmospheric methane concentration. During the early and middle Holocene, precipitation at Aweng Co was mainly influenced by fluctuations in the intensity and seasonal movement of the summer monsoon on the Tibetan Plateau. However, during the late Holocene when the Indian monsoon weakened, the precipitation isotope record at Aweng Co may have been influenced by glacier melting as a result of increased temperatures during the late Holocene.
ACKNOWLEDGMENTS
This work was supported by the “Strategic Priority Research Program (B) (Grant No. XDB01020300)” of the Chinese Academy of Sciences and by the Natural Science Foundation of China (Grant Nos. 41072120, 41321061).