





Non-technical Summary
Species diversity describes the variety and variability of biological life at a particular location and moment in time. Diversity is made up of not only the number of species present, but also how different these species are from one another, which is also referred to as disparity. Diversity and disparity are especially important in the fossil record, where they can reveal much about biology and ecology at a site. In this study, we used the exceptional mammalian fossil record of the John Day Formation, which captures over 20 million years of change from ca. 39 Ma to 18 Ma, to examine changes in diversity and disparity across space and time. We achieved this by first collecting a large dataset of fossil occurrences and first-molar teeth measurements. We then performed statistical analyses to estimate true species richness (i.e., the number of species) at sites and make comparisons to observed species richness. We then compared diversity and disparity with one another and with stratigraphy (i.e., the rock layers in which the fossils were found) and sampling effort (i.e., the degree to which a fossil site has been collected). We found that species richness has a relationship with sampling effort, while disparity does not, and richness and disparity also do not appear to have strong relationships with one another. We assess these relationships and discuss implications for the effects of various biases on measurements diversity and disparity in the fossil record.
Introduction
The John Day River Basin is a geographic region in central and eastern Oregon containing a remarkably complete section of fossiliferous strata capturing over 40 million years of biotic and abiotic change (Hunt and Stepleton, Reference Hunt and Stepleton2004; Dillhoff et al., Reference Dillhoff, Dillhoff, Dunn, Myers and Strömberg2009). Of particular note, the rich mammal record of the John Day Formation has been the focus of many decades of research and provides an excellent opportunity for investigating faunal changes across a geographically and stratigraphically constrained region (Hunt and Stepleton, Reference Hunt and Stepleton2004; Korth and Samuels, Reference Korth and Samuels2015; Retallack and Samuels, Reference Retallack and Samuels2020).
The John Day Formation records an exceptionally complete sedimentary sequence. These fossiliferous strata document biological change from the Eocene through the Miocene and have been the subject of countless investigations of paleontological and geological change (Bestland et al., Reference Bestland, Hammond, Blackwell, Kays, Retallack and Stimac2002; Hunt and Stepleton, Reference Hunt and Stepleton2004; Albright et al., Reference Albright, Woodburne, Fremd, Swisher, MacFadden and Scott2008; Dillhoff et al., Reference Dillhoff, Dillhoff, Dunn, Myers and Strömberg2009; Wheeler and Manchester, Reference Wheeler and Manchester2014; Mohr et al., Reference Mohr, Famoso, Samuels, Laib and Schmitz2025). About 14,000 acres of this geographically constrained region is administered by the National Park Service through the John Day Fossil Beds National Monument (JODA). Other sites in this study are on lands administered by the Bureau of Land Management or are on private land. Fossil collection and curation in parts of the John Day Formation is primarily performed by JODA staff, who return periodically to the same site to collect exposed fossils (Kort and Famoso, Reference Kort and Famoso2020). Sites are oftentimes collected at varying frequencies; some sites are collected annually and others at less frequent intervals.
This geographically constrained collection area provides us with a stratigraphic series of assemblages from throughout the Turtle Cove and Kimberly members of the John Day Formation, which have been continuously collected and curated by professional paleontologists. The stratigraphic resolution and geographic restriction, as well as an understanding of the paleoenvironment at the time allow us to make comparisons while controlling for factors such as environment and geography. For these reasons, the John Day region offers an opportunity for examining diversity and disparity through time in a geographically and stratigraphically constrained setting. Findings of diversity, disparity, and sampling change can then be leveraged to inform current and future fossil collecting efforts in the region.
We examined metrics of taxonomic richness and morphological disparity at sites in the John Day Formation. Measures of diversity and disparity are commonly used to gauge the biological diversity present at fossil sites and within fossil assemblages. Raw species richness counts (i.e., the number of species) are a simple and easily gathered measure that captures the total variety of species present. Raw species richness counts frequently are used as attainable and relevant measures of taxonomic diversity (Magurran, Reference Magurran2013; Chao and Chiu, Reference Chao, Chiu, Kenett, Longford, Piegorsch and Ruggeri2016). Morphological disparity, expressed as mean distance from centroid (mean DFC) captures biologically derived morphological (i.e., size and shape) variation within an assemblage (Foote, Reference Foote1997; Ciampaglio et al., Reference Ciampaglio, Kemp and McShea2001). For these reasons, raw species richness counts and mean DFC can be examined as a comparison of diversity and disparity. We also utilized coverage-based rarefaction analyses to gauge sampling completeness at each site and estimate site richness (i.e., Chao richness; Chao et al., Reference Chao, Colwell, Lin and Gotelli2009, Reference Chao, Gotelli, Hsieh, Sander, Ma, Colwell and Ellison2014) and calculate estimates of species richness utilizing subsampling methods including shareholder quorum subsampling (SQS; Alroy, Reference Alroy2010). We then compared observed species richness, estimated species richness, and morphological disparity and made interpretations in the context of stratigraphy and sampling completeness. In doing this, we also present a dataset of fossil mammal occurrences from sites in the John Day Formation with an associated morphological dataset of first-molar area.
Geologic setting
Stratigraphic information
The sites included in this study range stratigraphically from the early Oligocene-aged base of the Turtle Cove Member of the John Day Formation to the late Oligocene-aged Kimberly Member (Dillhoff et al., Reference Dillhoff, Dillhoff, Dunn, Myers and Strömberg2009; Mohr et al., Reference Mohr, Famoso, Samuels, Laib and Schmitz2025).
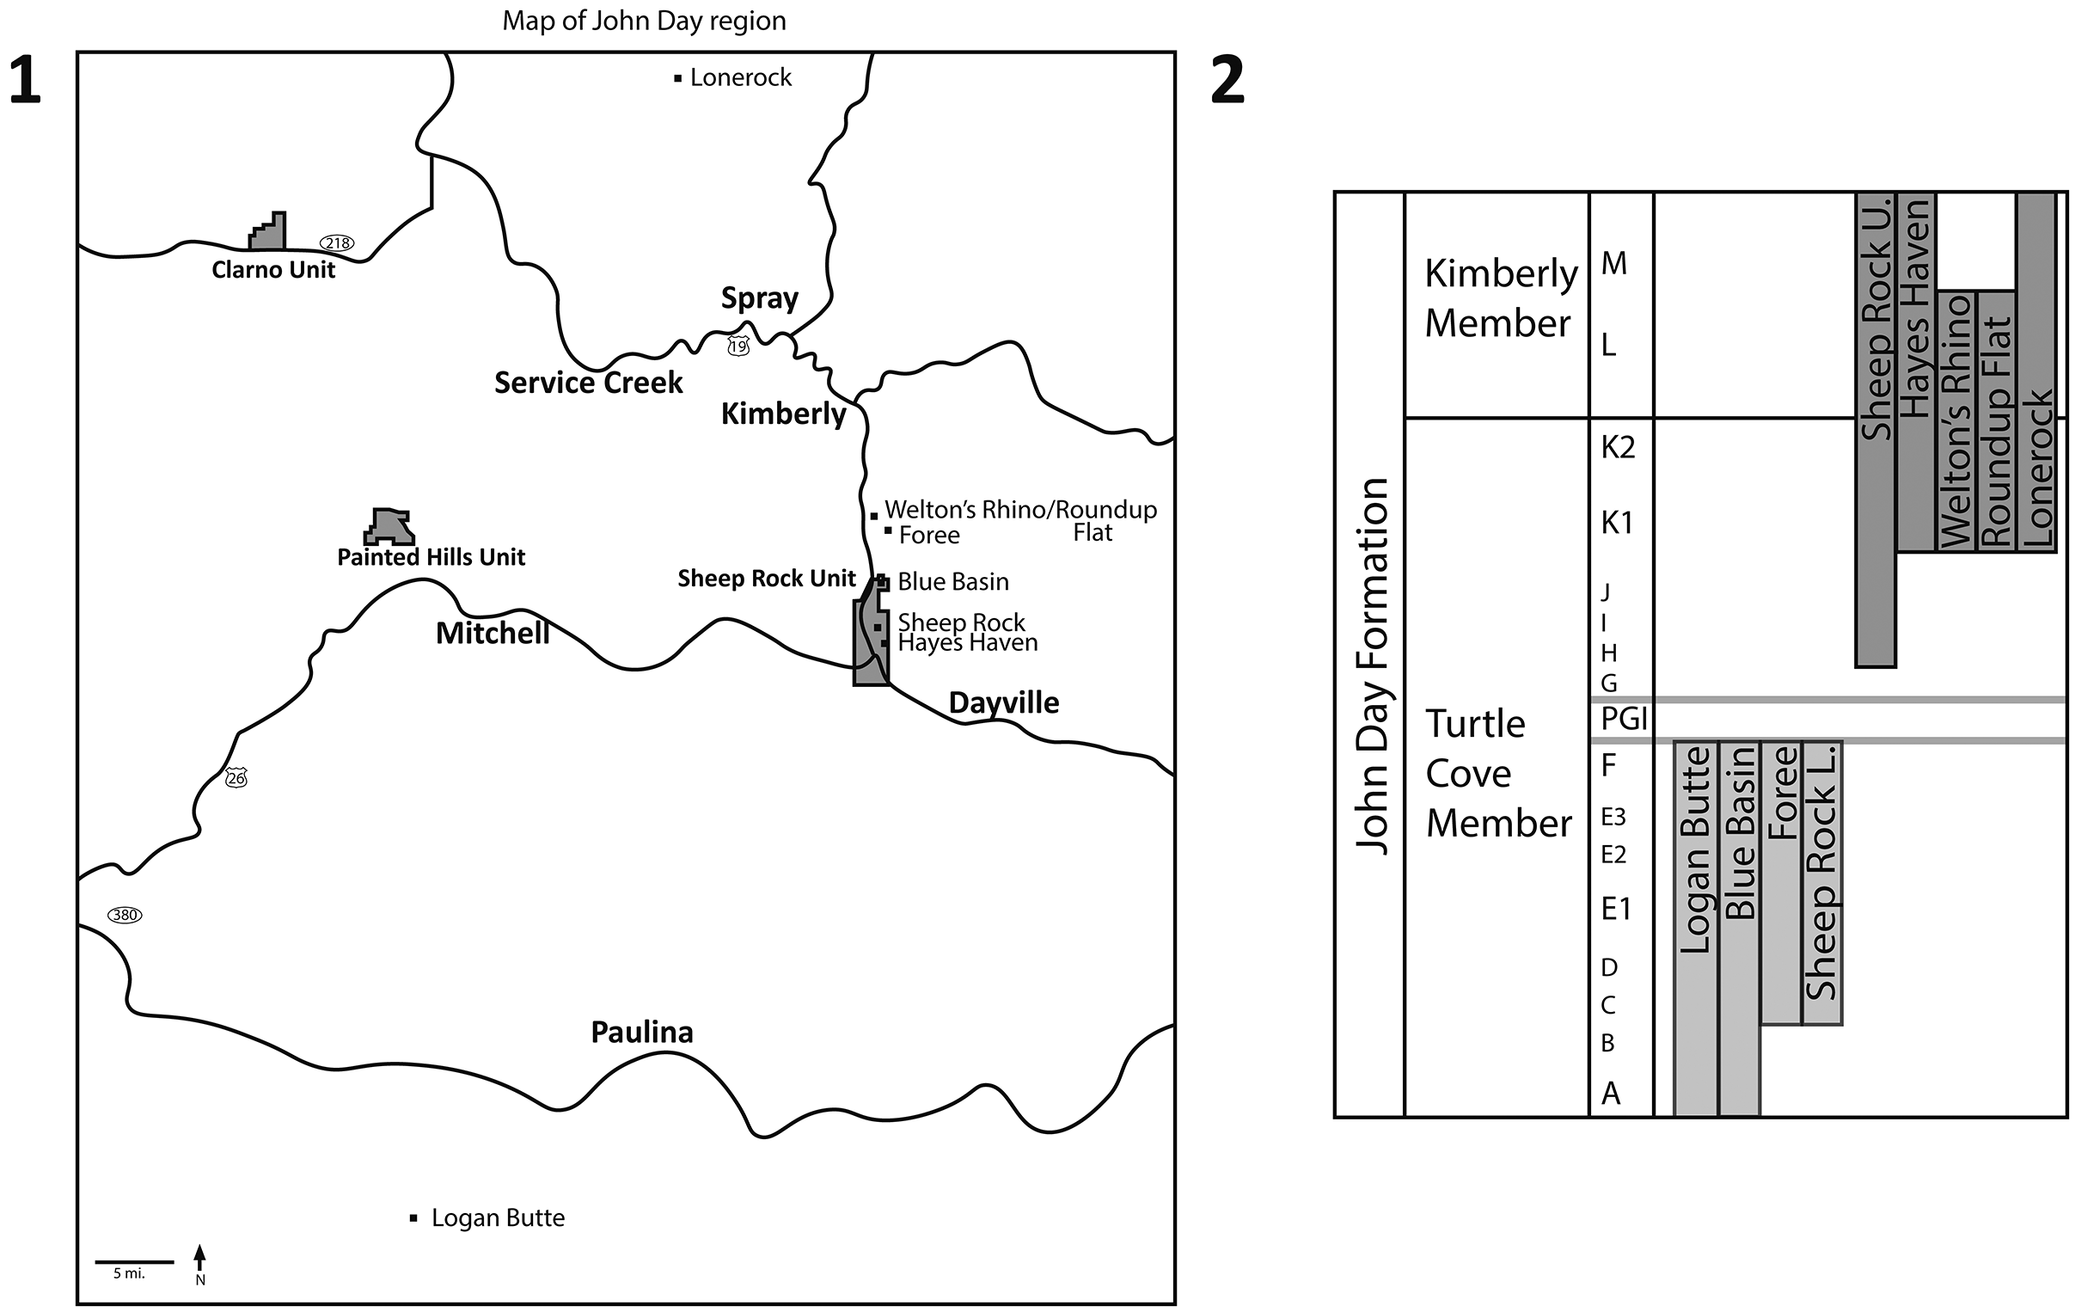
The John Day Formation is currently subdivided into seven members: Big Basin (ca. 39.67–32.15 Ma), Turtle Cove (ca. 32.15–26.58 Ma), Kimberly (ca. 26.58–25.49 Ma), Haystack Valley (ca. 24.20–23.17 Ma), Balm Creek (ca. 23.17–22.47 Ma), Johnson Canyon (ca. 22.47–21.69 Ma), and Rose Creek (ca. 18.47–18.00 Ma) (Retallack et al., Reference Retallack, Bestland and Fremd2000; Hunt and Stepleton, Reference Hunt and Stepleton2004; Albright et al., Reference Albright, Woodburne, Fremd, Swisher, MacFadden and Scott2008; Mohr et al., Reference Mohr, Famoso, Samuels, Laib and Schmitz2025). The Turtle Cove and Kimberly members consist of ~500 m of section that Albright et al. (Reference Albright, Woodburne, Fremd, Swisher, MacFadden and Scott2008) divided into 16 lithostratigraphic subunits (A–M; Fig. 1) within the area near the Sheep Rock Unit of John Day Fossil Beds National Monument. These units are not laterally continuous in other areas where the Turtle Cove Member is exposed (e.g., Painted Hills Unit, Crooked River Basin). Included within the Turtle Cove Member are several dated tuffs and the Picture Gorge ignimbrite (PGI), which is a super-volcanic event related to the Yellowstone hotspot (Seligman et al., Reference Seligman, Bindeman, McClaughry, Stern and Fisher2014). The faunas of the Turtle Cove Member are assigned to the Whitneyan and early early and late early Arikareean (Ar1 and Ar2) North American Land Mammal Ages (NALMAs; Oligocene; Rupelian Stage/Age) while the fauna of the Kimberly Member is only assigned to the late Arikareean (Ar3) NALMA (Oligocene; Chattian Stage/Age) (Albright et al., Reference Albright, Woodburne, Fremd, Swisher, MacFadden and Scott2008).
(1) Map showing the John Day and Crooked River basin areas, including the legislative boundaries of the units of the John Day Fossil Beds National Monument (shaded in gray) and sites of interest. (2) Stratigraphic section showing stratigraphic ranges of the sites of interest. Lower Turtle Cove Member sites are shown in light gray shading, upper Turtle Cove and Kimberly Member sites are shown in dark gray shading. The Picture Gorge Ignimbrite (PGI) separates the lower and upper Turtle Cove Member. Lettered units (A–M) from Albright et al. (Reference Albright, Woodburne, Fremd, Swisher, MacFadden and Scott2008).

A majority of sites included in this study, including Blue Basin, Foree, Logan Butte, Sheep Rock, Roundup Flat, Welton’s Rhino, Hayes Haven, and Lonerock are stratigraphically placed within the Turtle Cove and/or Kimberly members of the John Day Formation. The sites located in the Turtle Cove Member of the John Day Formation are split into the stratigraphically lower Turtle Cove and upper Turtle Cove/Kimberly Member depending upon their position either above or below the Picture Gorge ignimbrite. Lower Turtle Cove Member sites include Logan Butte (units A–F), Blue Basin (units A–F), and Foree (units C–F). Upper Turtle Cove and Kimberly Member sites include Hayes Haven (units K1–M), Roundup Flat (units K1–L), Welton’s Rhino (units K1–L), and Lonerock (units K1–M). The Sheep Rock locality (units C–M) falls stratigraphically in the Turtle Cove and Kimberly members, and for the purposes of this study, is divided into Sheep Rock Lower (units C–F) and Sheep Rock Upper (units H–M).
Locality information
In general, layers in the upper Turtle Cove Member tend to be much steeper than in lower layers, making the upper Turtle Cove Member sites more difficult for JODA staff to access and sample. There are also more accessible outcrops of the lower Turtle Cove than the upper Turtle Cove, which may be reflected in the sampling intensity at sites within the lower Turtle Cove compared to the upper Turtle Cove Member.
Materials and methods
The initial dataset consisted of 569 specimen occurrences of fossil mammals with preserved dentition (first molar) from 19 sites in the John Day and Crooked River basins, stemming from the orders Rodentia, Lagomorpha, Carnivora, Perissodactyla, Artiodactyla, and Eulipotyphla. These collections are housed at the museum collections of the John Day Fossil Beds National Monument (Kimberly, OR, USA). This initial dataset was cleaned as necessary: (1) sites with 5 or fewer specimen occurrences, or sites that could not be effectively geographically or stratigraphically constrained were synonymized or removed; (2) the Lonerock localities consist of a collection of several localities, all of which were considered a single Lonerock locality for the purposes of this study, given their geographic and stratigraphic proximity (Fremd and Whistler, Reference Fremd and Whistler2009); and (3) the Sheep Rock locality was divided into Sheep Rock Lower (units C-F) and Sheep Rock Upper (units H-M) localities. Following these removals and synonyms, nine localities remained representing 447 fossil mammal occurrences originating from throughout the John Day Formation (Table 1; Fig. 1). The lowest taxonomic identification, oftentimes genus or species, was used for each occurrence, but in one case a subfamily identification was used. Occurrence and morphological data are included in the Supplemental Data.
List of John Day Formation localities considered in this study, along with the number of specimen occurrences, species richness, number of singletons observed at each site, exposed outcrop area, and the formation, member, and units

Table 1. Long description
Table showing the list of localities included in this study, along with the number of occurrences, observed species richness, number of singletons, exposed outcrop area, and formation, member, and units for each site.
The remaining nine study sites represent geographically and stratigraphically constrained comparisons of varying sampling completeness. One lower Turtle Cove site, Logan Butte, is located in the Crooked River basin to the south and is included as a broader geographic comparison. Together, these sites offer a stratigraphically and geographically constrained comparison with appropriate sampling to conduct a study of the relationship between site diversity and sampling completeness.
Initial diversity (i.e., taxonomic diversity or species richness) and disparity (i.e., morphological diversity) measures were calculated for each fossil locality. Raw species richness (i.e., counts) was calculated as diversity, and mean distance from centroid (mean DFC) using first-molar area was calculated as morphological disparity (Ciampaglio et al., Reference Ciampaglio, Kemp and McShea2001). First-molar area was calculated as a proxy for body size from the anteroposterior length and labiolingual width in millimeters.
Body mass estimation from dental proxies is a common practice in paleontological study due to the paucity of the fossil record and the importance of body mass in understanding mammalian biology and ecology (Damuth and MacFadden, Reference Damuth and MacFadden1990; Hopkins, Reference Hopkins2008; Millien and Bovy, Reference Millien and Bovy2010). Both upper and lower dentitions have been used as proxies for body mass in various reconstructive studies of fossil mammals because the oral processing areas of upper and lower dentitions tend to have a close and predictable relationship with one another and with body size (Freudenthal and Martín-Suárez, Reference Freudenthal and Martín-Suárez2013; Vitek et al., Reference Vitek, Roseman and Bloch2020; Boivin et al., Reference Boivin, Álvarez, Ercoli, Moyano, Salgado-Ahumada, Tejerina and Cassini2024).
Given this close relationship between the first-molar area and body size, we take upper or lower first-molar area to be a proxy for body mass, depending on the availability of either tooth position, in an effort to increase the sample size (Freudenthal and Martín-Suárez, Reference Freudenthal and Martín-Suárez2013; Hopkins, Reference Hopkins, Croft, Su and Simpson2018; Boivin et al., Reference Boivin, Álvarez, Ercoli, Moyano, Salgado-Ahumada, Tejerina and Cassini2024). First-molar areas were then log (base 10) transformed to correct for allometry (Kerkhoff and Enquist, Reference Kerkhoff and Enquist2009; Freudenthal and Martín-Suárez, Reference Freudenthal and Martín-Suárez2013; Hopkins, Reference Hopkins, Croft, Su and Simpson2018). Mean DFC of first-molar area was then calculated. Mean DFC of first-molar area represents the mean distance from the centroid of first-molar area for each specimen occurrence at a locality. This metric captures the mean character distance of each occurrence from the centroid of all occurrences in each assemblage and quantifies the distance that an individual occurrence lies from the centroid of all occurrences. In other words, the average difference from the average size is captured, which gives a sense of the diversity of body sizes present in the sample. Size is a key component of morphological diversity, and for this reason, we use mean DFC as a morphological disparity metric (Briggs et al., Reference Briggs, Fortey and Wills1992; Wills et al., Reference Wills, Briggs and Fortey1994; Ciampaglio et al., Reference Ciampaglio, Kemp and McShea2001; McClain et al., Reference McClain, Johnson and Rex2004; Halliday and Goswami, Reference Halliday and Goswami2016; Grunert et al., Reference Grunert, Brocklehurst and Fröbisch2019).
Coverage-based rarefaction analyses were performed for each site to gauge sampling completeness using R package iNEXT version 3.0.2 and John Alroy’s 2017 code for performing SQS (Alroy, Reference Alroy2010, Reference Alroy2014; Chao et al., Reference Chao, Gotelli, Hsieh, Sander, Ma, Colwell and Ellison2014; Hsieh et al., Reference Hsieh, Ma and Chao2016, Reference Hsieh, Ma and Chao2025; Close et al., Reference Close, Evers, Alroy and Butler2018; R Core Team, 2025). SQS (quorum = 0.4) and Chao richness were calculated (Chao et al., Reference Chao, Chazdon, Colwell and Shen2006; Alroy, Reference Alroy2010, Reference Alroy2014; Close et al., Reference Close, Evers, Alroy and Butler2018). Chao richness provides an estimate of total species richness based on standardized coverage-based rarefaction and extrapolation (Chao, Reference Chao1984, Reference Chao1987; Chao et al., Reference Chao, Chazdon, Colwell and Shen2006; Hsieh et al., Reference Hsieh, Ma and Chao2016). SQS similarly estimates richness after standardization by coverage based on a percentage of taxa sampled and is commonly used in paleobiological studies that are performed on a count vector (Alroy, Reference Alroy2010, Reference Alroy2014; Holland, Reference Holland2015; Close et al., Reference Close, Evers, Alroy and Butler2018).
Repositories and institutional abbreviations
All specimens examined in this study are deposited at the museum collections of the John Day Fossil Beds National Monument (JODA).
Results
Diversity, disparity, and occurrences at John Day Formation localities
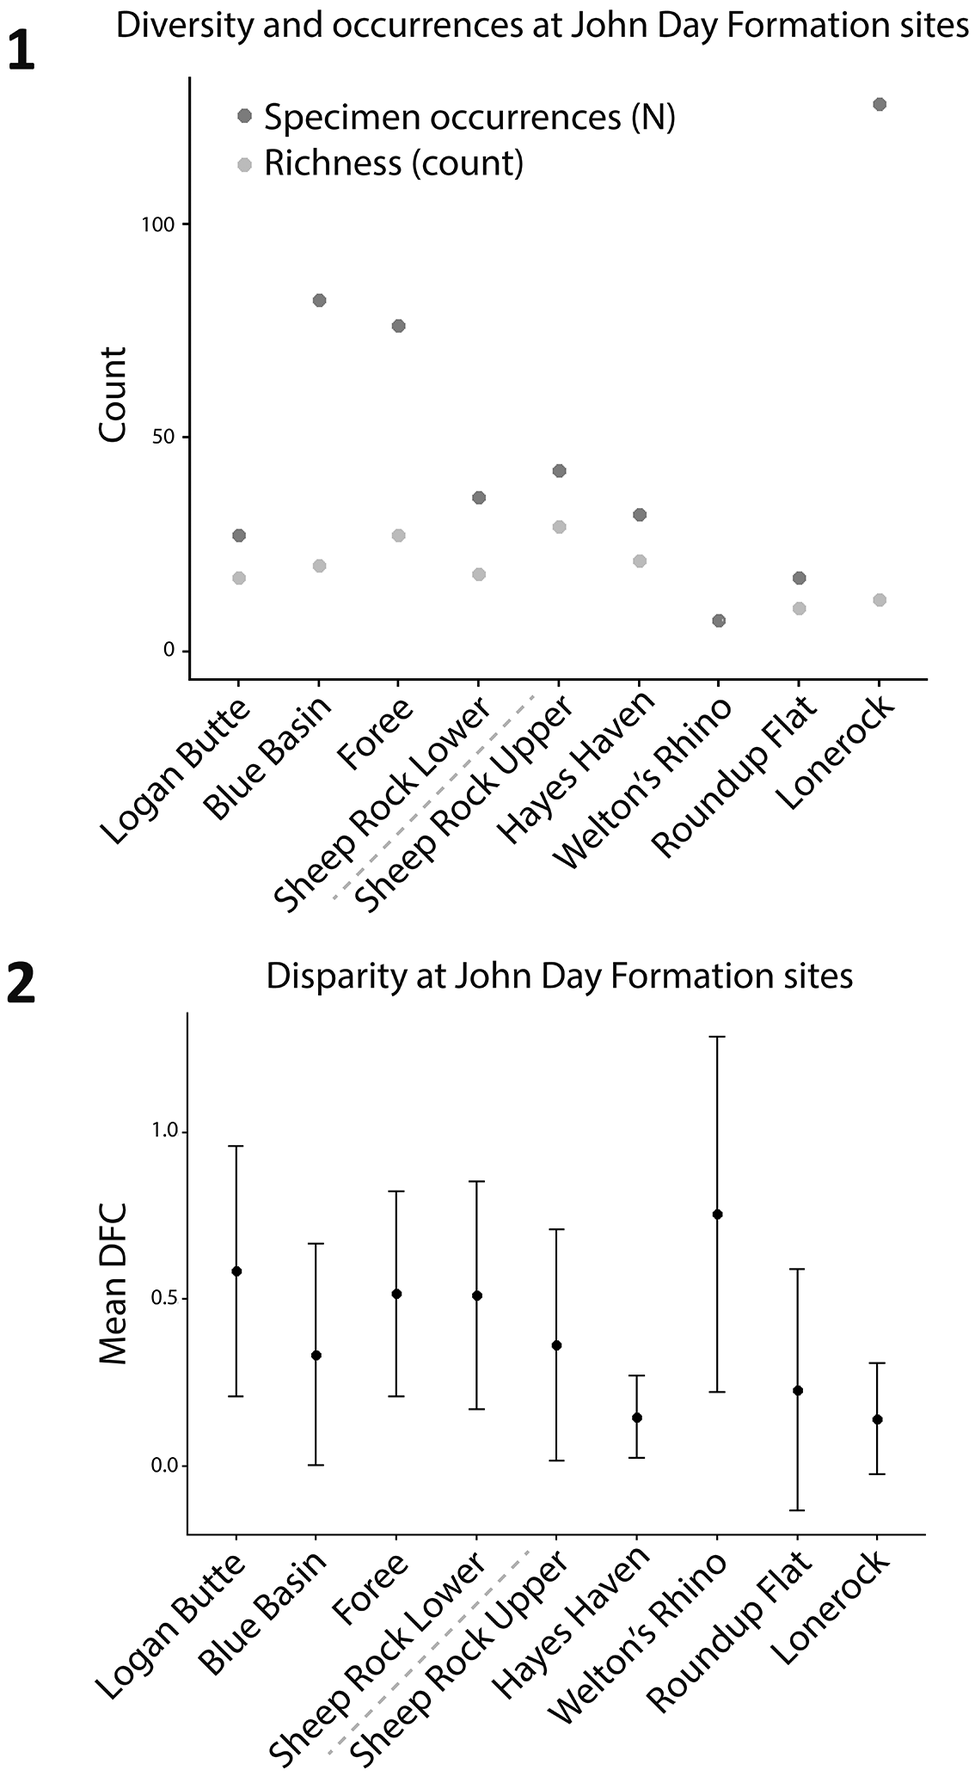
This study resulted in the collection of a large morphological dataset consisting of first-molar length and width measurements of John Day Formation mammals and allowed for the comparison of diversity and disparity at each considered site (Supplemental Data; Fig. 2). The number of specimen occurrences at each site ranges from 7 at Welton’s Rhino to 128 at Lonerock (Fig. 2.1; Table 1). We found that richness is higher at the Sheep Rock Upper locality than any other locality, with an observed species richness of 29, compared to 27 at Foree and 21 at Hayes Haven (Fig. 2.1). The remaining sites range in observed richness from 7 to 20 species.
(1) Diversity (richness count) and number of specimen occurrences at each site. (2) Disparity only at considered sites in the John Day Formation. Mean DFC values are shown in black, specimen occurrences (i.e., sample size, N) in dark gray, and observed richness counts in light gray. Standard error bars are shown for mean DFC. Dashed line indicates the division between the lower Turtle Cove Member sites (left) and the upper Turtle Cove and Kimberly Member sites (right).

Mean distance from centroid (mean DFC; i.e., morphological disparity) appears higher at the Welton’s Rhino locality than at any other locality (Fig. 2.2). Some lower Turtle Cove sites, including Logan Butte, Foree, and Sheep Rock Lower, also exhibit relatively high mean DFC, with logged values ranging from 0.58 mm (SE = 0.37) at Logan Butte to 0.52 mm and 0.51 mm at Foree (SE = 0.31) and Sheep Rock Lower (SE = 0.34), respectively. However, none of the sites exhibit mean DFC values that are significantly different at current sample sizes.
Coverage-based rarefaction and SQS
Coverage-based rarefaction curves for the considered John Day sites show varying patterns of rarefied and extrapolated diversity with differing sampling coverage at each site (Fig. 3). Some sites (i.e., Sheep Rock Upper, Sheep Rock Lower, Hayes Haven, and Welton’s Rhino) show linear relationships between sample coverage and species diversity. While other sites (i.e., Logan Butte, Foree, Blue Basin, and Lonerock) exhibit a steeper and more curved slope linking sample coverage and species diversity (Fig. 3.1). For example, Foree shows high sample coverage and high species diversity, and it is likely that rare taxa would be added with additional sampling (Fig. 3.1). Blue Basin, on the other hand, shows high sample coverage with moderate species richness, suggesting that new taxa may be added at a slower rate and that this site may be nearer to carrying capacity. Lonerock represents a site with extremely high sampling and very low richness. The rarefaction–extrapolation curve for Lonerock suggests an uneven assemblage with a few very common taxa and only a few representatives of other taxa.
Coverage-based rarefaction and extrapolation curves for the considered John Day sites from (1) the lower Turtle Cove Member and (2) the upper Turtle Cove and Kimber Member sites. The solid line represents rarefaction, while the dashed line represents extrapolation. Shaded regions represent 95% confidence intervals, and shapes represent observed sample species richness.

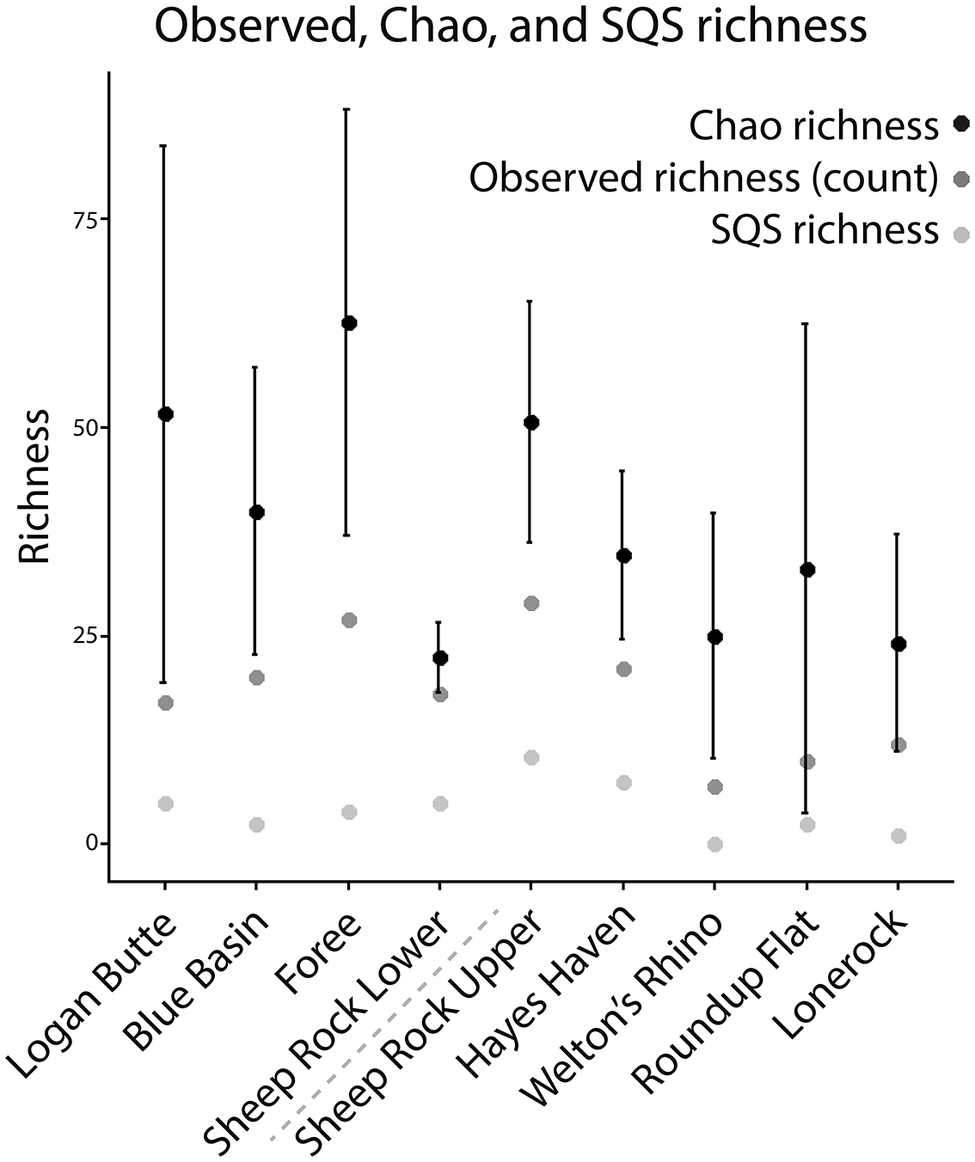
SQS subsampling appears to recover lower richness than observed at all sites, while retaining Sheep Rock Upper as the most species rich site. Chao richness suggests that most sites are expected to add many more species with additional sampling, except Sheep Rock Lower (Fig. 4).
Observed, Chao, and SQS richness plotted for the considered John Day Formation sites. Chao richness (an extrapolated estimate of true richness) is plotted in black, observed richness in dark gray, and SQS richness (a measure of richness standardized to sample coverage) in light gray. Standard error is shown for Chao richness. Dashed line indicates the division between the lower Turtle Cove Member sites (left) and the upper Turtle Cove and Kimberly Member sites (right). SQS richness at Welton’s Rhino could not be calculated due to singletons, so the value is 0.

Discussion
Richness appears to be generally highest at the most well-sampled localities (i.e., the localities with the highest number of occurrences). Blue Basin and Foree possess the highest numbers of specimen occurrences and exhibit relatively high richness (Fig. 2.1). The site exhibiting the highest richness, Sheep Rock Upper, possesses 29 species with only 42 specimen occurrences. Lonerock, the site with the highest number of specimen occurrences, interestingly exhibits a richness of just 12, which is a relatively low value in comparison to the 128 specimen occurrences from that site. Most specimen occurrences from Lonerock belong to the order Rodentia, apart from only two occurrences belonging to the order Carnivora. This skew is likely a consequence of the sampling methods employed at this site (i.e., screenwashing), the under-described nature of this assemblage, and other factors. For one, there are many isolated teeth from Lonerock that are being treated as individuals even though several of these teeth could belong to the same individual organism, which might affect the results of the rarefaction. Additionally, Lonerock represents a relatively short interval of geologic time compared to other sites in this study. Sites such as Sheep Rock, which we have split into Upper and Lower portions for the purposes of this study, represent approximately 9 million years of total time with 17 distinct horizons while Lonerock may only represent between 1 and 5 horizons.
We would expect a site with more horizons and more time represented to have higher diversity in raw richness. Additionally, the number of NALMAs and NALMA subages represented at a site and the accompanying number of transitions between NALMAs and NALMA subages may also work to artificially inflate diversity. For example, Sheep Rock Upper may have up to three distinct biozones or NALMA subages present at the site (Tedford et al., Reference Tedford, Albright, Barnosky, Ferrusquia-Villafranca, Hunt, Storer, Swisher, Voorhies, Webb, Whistler and Woodburne2004; Albright et al., Reference Albright, Woodburne, Fremd, Swisher, MacFadden and Scott2008; Famoso et al., Reference Famoso, Samuels, Hopkins, Davis, Edward and Emery2016; Mohr et al., Reference Mohr, Famoso, Samuels, Laib and Schmitz2025). While other sites (e.g., Foree) are characterized by just 1–2 biozones or NALMA subages, and Logan Butte represents just one biozone or NALMA subage (Tedford et al., Reference Tedford, Albright, Barnosky, Ferrusquia-Villafranca, Hunt, Storer, Swisher, Voorhies, Webb, Whistler and Woodburne2004; Albright et al., Reference Albright, Woodburne, Fremd, Swisher, MacFadden and Scott2008; Famoso et al., Reference Famoso, Samuels, Hopkins, Davis, Edward and Emery2016; Mohr et al., Reference Mohr, Famoso, Samuels, Laib and Schmitz2025). Although we found that Sheep Rock Upper exhibits the highest observed species richness in our considered sites, other sites with similarly high observed richness, such as Foree, are not characterized by 2–3 biozones or NALMA subages, and instead are characterized by just 1–2.
High mean distance from centroid (mean DFC) values, such as that observed at the Welton’s Rhino locality, are indicative of the assemblage’s highly taxonomically varied occurrences, in which first-molar areas differ on average from one another. Welton’s Rhino includes occurrences belonging to the orders Lagomorpha, Perissodactyla, Rodentia, and Carnivora. First-molar area at Welton’s Rhino ranges from 3.94 mm to 1449.24 mm, a range of three orders of magnitude. Intermediate mean DFC values, such as those at Blue Basin or Sheep Rock Lower, appear to indicate taxonomically broad and well-represented assemblages. Blue Basin exhibits occurrences from the orders Carnivora, Rodentia, Artiodactyla, and Perissodactyla, while Sheep Rock Lower exhibits occurrences from the orders Lagomorpha, Rodentia, Artiodactyla, Perissodactyla, and Carnivora. Smaller mean DFC values indicate less variability in the assemblage. The assemblage at Lonerock, for example, consists only of occurrences from the orders Rodentia and Carnivora, resulting in an assemblage where occurrences are oftentimes similar to one another in first-molar area, resulting in a low mean DFC value. The same is true for the assemblage at Hayes Haven, which consists only of occurrences from the orders Rodentia and Lagomorpha. Skewed taxonomic assemblages, and subsequently small morphological disparity, could potentially represent a true ecological signal such as a bird of prey roost (Mayhew, Reference Mayhew1977).
Disparity appears to have a variable relationship with sampling intensity and stratigraphy. Relatively small mean DFC is observed at Upper Turtle Cove and Kimberly Member sites (except for Welton’s Rhino). These Upper Turtle Cove and Kimberly Member sites, including Lonerock, Sheep Rock Upper, Hayes Haven, and Roundup Flat, appear to be at various stages of sampling effort according to coverage-based rarefaction curves, with additional sampling at these sites expected to yield varying numbers of new species (Fig. 3). We also observe that the site with the highest morphological disparity (Welton’s Rhino) is also the site with the lowest sampling intensity. Logan Butte, similarly, also possesses relatively low sampling intensity and high disparity. However, the JODA collections notably lack significant sampling from Logan Butte, with other institutions (i.e., the University of Oregon Museum of Natural and Cultural History, University of California Museum of Paleontology, and the University of Washington Burke Museum of Natural History and Culture) holding more robust collections from this site. Other sites, such as Roundup Flat and Hayes Haven, exhibit both low sampling intensity and low disparity. This variable pattern between sampling intensity and disparity suggests a more variable relationship between sampling and organism size because morphological disparity is dependent on the size of the organism, which is heavily biased in the fossil record and during taphonomic processes and fossil collection (Lindholm and Close, Reference Lindholm and Close2025).
Richness appears to hold a strong relationship with both stratigraphy and sampling effort in the considered John Day Formation sites, despite differences in sampling intensity and type. Sites and stratigraphic levels with intense sampling effort are typically associated with high diversity and sometimes disparity (Fig. 2). The exception to this pattern is Lonerock, which exhibits an exceedingly high number of occurrences without accompanying high observed richness, perhaps exemplifying the effects of screenwashing on assemblage diversity, or possibly indicating some true ecological signal (Fig. 2.1).
Observed taxonomic richness and morphological disparity do not appear to be correlated, with sites with the highest richness (i.e., Sheep Rock Upper and Foree) corresponding to intermediate values of mean DFC, and sites with the highest mean DFC (i.e., Welton’s Rhino and Logan Butte) corresponding to sites with low or intermediate richness. This variable relationship between taxonomic diversity and morphological disparity at these sites suggests that diversity and disparity do not maintain a consistent relationship in these John Day Formation assemblages (Ciampaglio et al., Reference Ciampaglio, Kemp and McShea2001; Grunert et al., Reference Grunert, Brocklehurst and Fröbisch2019).
Total occurrences from each site likely vary as a result of multiple factors, including sampling effort (i.e., number of person-hours spent collecting at a site or volume of specimens collected over time) and type (i.e., surface collection, screenwashing, etc.). Some of the sites considered in this study are revisited frequently by National Park Service employees and sampled for fossil remains (i.e., Blue Basin, Foree, Sheep Rock, Hayes Haven), while others are visited more infrequently due to distance or land accessibility (i.e., Roundup Flat, Welton’s Rhino, Logan Butte, Lonerock). However, differences in sampling frequency (i.e., the number of times a site is collected) do not appear to strongly affect fossil yield (i.e., the number of fossils collected overall) within the Turtle Cove Member, which suggests that sampling frequency should not affect metrics such as specimen occurrences or species richness (Kort and Famoso, Reference Kort and Famoso2020). Among the sites considered in this study, some sites, including Blue Basin, Foree, and Sheep Rock, are among the most frequently sampled, which appears to generally correspond to those sites with the highest numbers of occurrences. Additionally, there is a greater surface area of fossiliferous rock that is more easily accessible to field crews at these sites compared to some of the other sites, particularly in the lower Turtle Cove Member.
Rarefaction curves indicate that all considered sites should continue to see species diversity increase as the number of sampled individuals increases (Fig. 3; Simberloff, Reference Simberloff, Dickson, Cairns and Livingston1978; Hsieh et al., Reference Hsieh, Ma and Chao2016). The number of sampled individuals could be increased by adding specimens through additional fieldwork or from other museum collections (e.g., the University of Oregon Museum of Natural and Cultural History, University of California Museum of Paleontology, and the University of Washington Burke Museum of Natural History and Culture), although the stratigraphic resolution of these other collections may not match from collection to collection. Rarefaction curves for Sheep Rock Upper, Hayes Haven, Sheep Rock Lower, and Welton’s Rhino appear to indicate that additional sampling would likely yield fewer new species, while curves for Logan Butte, Foree, Blue Basin, and Lonerock show more steeply sloping extrapolation curves, indicating more expected new species with additional sampling (Fig. 3; Simberloff, Reference Simberloff, Dickson, Cairns and Livingston1978; Hsieh et al., Reference Hsieh, Ma and Chao2016).
Larger fossils are more easily visible to the naked eye, likely skewing the distribution among collected fossils towards larger sizes, unless methods such as screenwashing are being implemented (Eaton, Reference Eaton2004; Cooper et al., Reference Cooper, Maxwell, Crampton, Beu, Jones and Marshall2006). The distribution of collected fossils being skewed towards larger sizes would also tend to skew morphological disparity towards larger size classes and exclude the smallest fossils, likely resulting in a mean DFC value that is smaller than it would otherwise be. This skew would give smaller taxa a disproportionate effect on the assemblage morphological disparity when a smaller taxon, like those of the orders Rodentia or Lagomorpha, is recovered. No major screenwashing efforts have been undertaken at JODA, except for at Lonerock. Additionally, no productive ant hills have been identified in many of the sites in this study. Lack of ant hills may be the result of the zeolitized nature of mudstones and claystones of the Turtle Cove and Kimberly Members of the John Day Formation and the relative difficulty in breaking down these lithologies, contributing to the exclusion of parts of the assemblages that could be recovered via screenwashing (Williamson, Reference Williamson2012). Efforts towards this end could present a future research direction (Williamson, Reference Williamson2012).
Geographic location does not appear to have a strong bearing on diversity or disparity. The most geographically distant sites, Logan Butte and Lonerock, fall within the range of diversity and disparity of the remaining sites. Lonerock, however, because of the sampling reasons discussed previously, has many more occurrences than all other sites. It is also likely that the geographic size of localities affects sampling because the localities we considered tend to differ considerably in their outcrop surface areas. Blue Basin and Sheep Rock (Upper and Lower) are geographically extensive sites with exposed outcrop, each covering about 0.5 km2, whereas Welton’s Rhino covers a mere 0.06 km2. As such, surface area generally tends to align with the number of occurrences recovered at each site, with Blue Basin, Foree, and Sheep Rock being some of the most well-sampled sites, and Welton’s Rhino being one of the least sampled sites.
Conclusions
We considered nine John Day Formation sites and examined taxonomic diversity, morphological disparity, and sampling at each site. We found that John Day Formation sites are at various stages of sampling completeness, with all sites expected to yield new species diversity with additional sampling. We also found that richness appears to relate to sampling, with high richness typically being associated with the most well-sampled localities. Sampling does not appear to have as strong of a relationship with morphological disparity, with variable relationships appearing between mean DFC and sampling completeness. We suspect that disparity may be more susceptible to taphonomic biases related to size bias in the fossil record and during fossil collection, and future work could examine the effects of collection bias on assemblage morphological disparity. Taxonomic diversity and morphological disparity also do not appear to have a consistent relationship with one another, with variable relationships between the highest and lowest values of diversity and disparity.
In light of these findings, future fieldwork could target sites with the steepest extrapolated diversity curves, such as Logan Butte, Foree, Blue Basin, Roundup Flat, and Lonerock, because these sites would be expected to yield more diversity with additional sampling. However, the remaining considered sites (Welton’s Rhino, Sheep Rock sites, and Hayes Haven) are also expected to yield further diversity with sampling, but at a lower rate. Additionally, this study could be expanded with the inclusion of specimens from these sites that are held in museum collections outside of JODA.
Acknowledgments
Parts of this work were supported by the National Park Service through the Geoscientists-in-the-Parks program, a partnership between the National Park Service and Conservation Legacy. The authors thank D. Reuter for helpful discussion, and the staff of the John Day Fossil Beds National Monument for decades of dedicated fossil collection and curation. The authors are also grateful to editor S. Hopkins and reviewers P. Holroyd and D. Fraser, whose input greatly improved this work.
Author contribution
Amanda W. Peng: conceptualization, data curation, formal analysis, investigation, methodology, visualization, writing (original draft, and review and editing); Nicholas A. Famoso: conceptualization, data curation, methodology, writing (review and editing).
Competing interests
The authors declare no competing interests.
Data availability statement
Data available from Zenodo repository: https://doi.org/10.5281/zenodo.21794892.



 Open access

